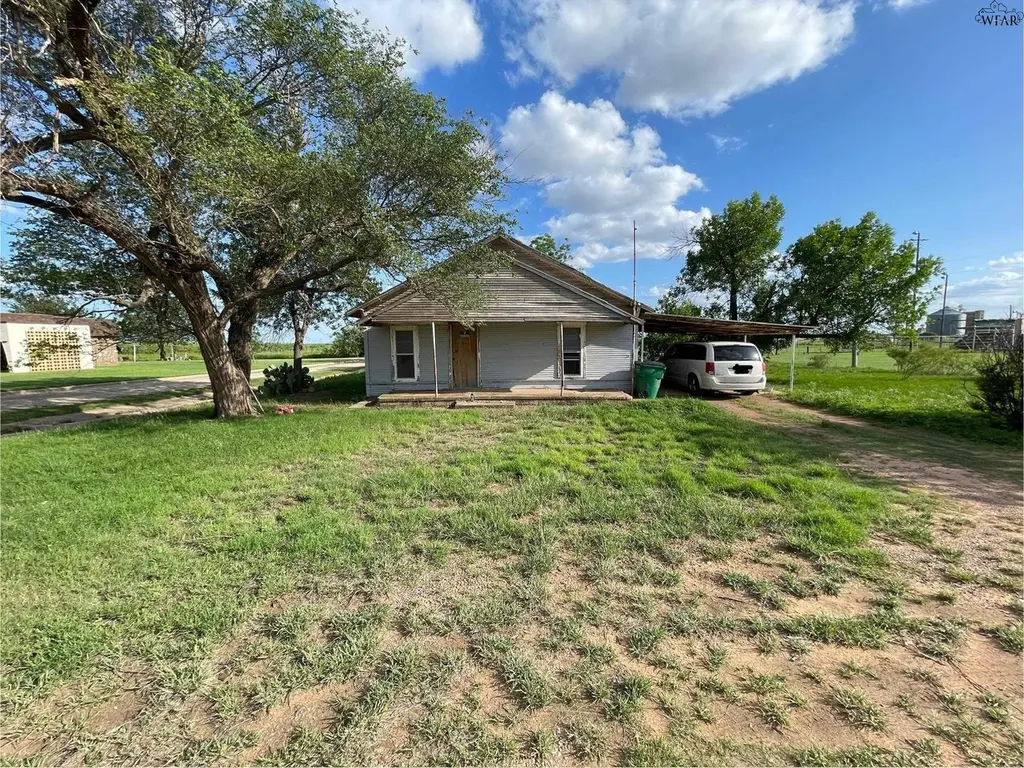
324 E California St · Crowell, TX
Flood risk 1/10 · Minimal
- FEMA flood zone
- —
- Chance of flooding over 30 yrs
- 0.0%
- Est. flood insurance / yr
- —
Fire risk 5/10 · Moderate
- Est. fire insurance / yr
- $1,222 – $2,270
Heat risk 7/10 · Major
- Hot days now (above 109°F)
- 7 days/yr
- Hot days in 30 yrs
- 20 days/yr
Wind risk 3/10 · Minor
- Chance of severe wind over 30 yrs
- 6.0%
Air-quality risk 1/10 · Minimal
- Unhealthy air days now
- 0 days/yr
- Unhealthy air days in 30 yrs
- 0 days/yr
Risk factors via First Street. Map © Google.
Why this score? — see what drove the C grade
The composite is a weighted blend of 9 inputs, each scored 0–100. Each bar is that input's sub-score; the figure is the points it added to the 100-point composite (weight × sub-score).
- Cash flow +15.0/30.0
- ARV discount +15.0/15.0
- Appreciation +5.4/10.0
- 1% rule +5.0/10.0
- DSCR +5.0/10.0
- Livability +3.4/5.0
- Schools +3.2/10.0
- Rent growth +2.5/5.0
- Condition / age +1.0/5.0
$22,500
🖨 Deal sheet 📄 Offer letter ✓ Due diligence
Listing remarks
Some structural and utility repairs have been done, but the pictures will show you can do what you would like with this house. Situated on the south edge of town with only a kids ballpark behind you. There is enough lot space you may add RV spaces generating income for you.
Key facts
- Utility repairs
- Rv spaces
- Lot space
Tags
Property features AI
Exterior
- Home design: Single-family residence; Residential property
- Construction: Single family construction
- Exterior features: Located on a corner lot
Interior
- Interior features: Corner lot location (corner of East California and South 3rd)
Neighborhood map
What this means for you Summary
Snapshot
- This is a 2-bed/2.0-bath single-family listed at $22k. Condition is rated poor.
Deal economics
- At list price, monthly cash flow is $631 ($8k/yr) — positive.
- The deal already cash-flows at list — no discount required.
- Meets the 1% rule at list price ($996 rent vs $22k).
Location & tenants
- Location reads 67/100 on livability (#511 in TX) — a middle-class / working-renter tenant base. Strengths: crime A+, cost of living A+, housing A+; Watch: health & safety C-, schools F, amenities F.
- Crowell ISD (rural): math 40% / reading 30% proficiency, ranked #917 of 1,141 in TX (top 80%) — families likely to look elsewhere, expect single-tenant / working-renter base with shorter leases.
- Market conditions: 8 active listings in the ZIP.
Forward outlook
- In year one you build about $325 of equity ($156 loan paydown + $169 appreciation (0.8% local appreciation)).
- Foard County population projected at -14% by 2050 — secular population decline; favor cash flow + early exit over multi-decade hold.
- At projected returns (0.8% appreciation + 3.0% rent growth), your $6k cash investment doubles in ~1 year — after that, you're playing with house money.
Negotiation context
- Only 9 days on market — expect competitive offers; lowballing is unlikely to land.
Risks & watch-outs
- Climate carrying-cost: moderate wildfire risk; extreme-heat days projected 7→20/yr by 2055 (HVAC capex compounding) — expect insurance premiums to compound above CPI over the hold.
Questions for the listing agent
- Have any recent inspections been done? Can we get a copy of the seller's disclosures and any deferred-maintenance estimates?
- Is there a deadline driving the sale (1031 exchange, divorce, estate, relocation)? That informs how much negotiation room exists.
- Schools are F-rated, which usually means shorter tenancies and higher turnover. Who's the typical renter profile here, and what's been the actual vacancy rate?
- What's the average days-on-market for RENTAL listings here right now (not sales)? A rising rental-DOM trend means longer vacancies and softer asking-rent achievability than the comps imply.
- What's the recent tenant-quality profile in this submarket — average credit score on applications, eviction rate, late-payment / NSF rate, and stable-employment percentage? A property-management company in the area should have these aggregated.
- How much new for-sale + rental construction is in the pipeline within 1–3 miles? Heavy new supply typically softens prices + rents 12–24 months out; constrained supply supports both.
Investment metrics
- 1% rule
- 4.43% ✓
- Cap rate
- 39.96%
- Cash-on-cash
- 120.25%
- DSCR
- 6.35
- GRM
- 1.9
CMA / ARV
- ARV (on-the-fly)
- $42,084
- Comps found
- 1
Show comp detail 1 sale within ~0.75 mi
| Address | Dist | Beds/Ba | Sqft | Sold | Price | $/sf | Match |
|---|---|---|---|---|---|---|---|
| 120 N 6th St | 0.27mi | 3/2.0 (+1) | 1,264 (+8%) | 24mo | $45,000 | $36 | 49 |
Match score weights: distance 35% · size 25% · config 20% · recency 20%. Top-matched comps best support the ARV.
Projected returns pro-forma
0.75% appreciation · 3.0% rent growth · sell at horizon
- IRR
- —
- Equity multiple
- 7.41×
- Total profit
- $40,373
- Equity at exit
- $7,391
- IRR
- —
- Equity multiple
- 15.43×
- Total profit
- $90,887
- Equity at exit
- $9,602
Cash invested: $6,300 (down + closing). Projections, not guarantees.
Landlord ↔ Tenant lean methodology
- Overall (STATE)
- 87 Strongly Landlord-Friendly
- State Texas
- 87 Strongly Landlord-Friendly · R+5
- County
- — inherits STATE
- City
- — inherits STATE
ZIP-level market 79227
- Home prices YoY
- 1.2%
- Active inventory
- 8
- Price-to-rent
- 1.9×
Monthly cashflow live
- Estimated rent
- $996 medium interval (Pro) →
- Mortgage (P&I)
- −$118
- Tax est. 1.5%
- −$28 /mo · $338/yr
- Insurance
- −$9
- HOA
- −$0
- Vacancy / Maint / Mgmt
- −$209
- Net cashflow
- $631
Break-even live
UW: 25.0% down · 7.5% · 30yr · 1.5% tax · 5.0% vac · 8.0% maint · 8.0% mgmt
Financing live
Cash to close
- Down payment
- $5,625
- Closing costs
- $675
- Reserves months
- —
- Total cash needed
- —
Loan-product check · same deal, 3 products live
Conventional
25% down · 7.5% · 30yr
- Down + closing
- —
- Monthly P&I
- —
- Monthly cashflow
- —
- DSCR
- —
- Eligible?
- —
Personal DTI + credit; lowest rate.
DSCR
20% down · 8.5% · 30yr
- Down + closing
- —
- Monthly P&I
- —
- Monthly cashflow
- —
- DSCR
- —
- Eligible?
- —
No personal income docs; deal must DSCR.
Hard money
10% down · 12.0% · 12mo
- Down + closing
- —
- Monthly P&I
- —
- Monthly cashflow
- —
- DSCR
- —
- Eligible?
- —
Short-term bridge; refi at stabilization.
Listing history 7 events
-
2026-06-18days on market $22,500 Active 9 DOM
-
2026-06-17days on market $22,500 Active 8 DOM
-
2026-06-16days on market $22,500 Active 7 DOM
-
2026-06-15days on market $22,500 Active 6 DOM
-
2026-06-13days on market $22,500 Active 4 DOM
-
2026-06-12remarks 274-char remark
-
2026-06-12$22,500 Active 3 DOM
ⓘ Source: listings_history table (triggers on properties + properties_extension) + one-shot
backfill from property_details.listing_events for pre-trigger history.
Climate risk First Street
- Flood 1/10 Low 0% chance over 30 yrs
- Wildfire 5/10 Major
- Heat 7/10 Severe 7 d/yr ≥109°F today · 20 d/yr by 30 yrs out
- Wind 3/10 Moderate 6% chance of damaging wind over 30 yrs
- Air quality 1/10 Low 0 unhealthy d/yr today · 0 by 30 yrs out
Nearby sold comps map
Loading sold comps map…
Walkable amenities ~0.75 mi
Loading nearby amenities…
Taxation est. · year 1
- Rental income
- $11,952
- − Mortgage interest
- −$1,260
- − Property taxes
- −$338
- − Insurance
- −$112
- − Repairs & maintenance
- −$956
- − Management
- −$956
- − Depreciation
- −$655
- Taxable income
- $7,675
- Est. tax owed @ 24.0%
- −$1,842
- After-tax cash flow
- $5,734/yr
For passive investors: Depreciation is non-cash, so a rental often shows a tax loss while cash-flowing — sheltering income. Rental losses are passive: they offset passive income freely, and up to $25,000/yr can offset ordinary (W-2) income if you actively participate and your MAGI is under $100k (phasing out to $0 by $150k); unused losses carry forward. On sale, claimed depreciation is recaptured at up to 25%, and gains may owe capital-gains tax (a 1031 exchange can defer both). Figures are a year-1 estimate at your 24.0% rate — not tax advice; consult a CPA.
Condition & rehab AI · 13 photos
This property requires extensive repairs and updates to bring it up to a livable condition. Significant work is needed on the roof, exterior, interior, and HVAC systems. Once completed, it could be a valuable investment.
Repairs flagged
- Major roof — Signs of significant damage
- Major exterior siding — Severe peeling and damage
- Major interior walls — Severe paint peeling and structural issues
- Major bathroom fixtures — Missing tiles and fixtures
- Major kitchen cabinets — Damaged and missing
- Major HVAC — No visible systems
Value-add opportunities
- Resale Paint and siding repair — Enhances curb appeal and home value
- Resale Flooring replacement — Improves living space and resale value
- Resale Interior wall repairs — Restores structural integrity and enhances home value
- Resale Bathroom tile replacement — Improves functionality and aesthetic appeal
- Resale Kitchen cabinet replacement — Enhances functionality and aesthetic appeal
- Both HVAC system replacement — Improves comfort and energy efficiency
Renovation cost estimate screening
| Repair item | Severity | Est. cost |
|---|---|---|
| roof · Signs of significant damage | Major | $15,000–50,000 |
| exterior siding · Severe peeling and damage | Major | $15,000–50,000 |
| interior walls · Severe paint peeling and structural issues | Major | $15,000–50,000 |
| bathroom fixtures · Missing tiles and fixtures | Major | $15,000–50,000 |
| kitchen cabinets · Damaged and missing | Major | $15,000–50,000 |
| HVAC · No visible systems | Major | $15,000–50,000 |
| Total estimated repair cost · 6 items | $90,000–300,000 |
Value-add ROI direction
- Resale Paint and siding repair — Enhances curb appeal and home value ↑
- Resale Flooring replacement — Improves living space and resale value ↑
- Resale Interior wall repairs — Restores structural integrity and enhances home value ↑
- Resale Bathroom tile replacement — Improves functionality and aesthetic appeal ↑
- Resale Kitchen cabinet replacement — Enhances functionality and aesthetic appeal ↑
- Both HVAC system replacement — Improves comfort and energy efficiency ↑
ⓘ Cost ranges are severity-bucket heuristics (US national rule-of-thumb). Get contractor quotes + a written scope before underwriting a rehab budget.
Schools (NCES district)
- District
- Crowell ISD
- NCES district ID
- 4815870
- Math proficiency
- 40% ▲ 5.00%
- Reading proficiency
- 30% ▬ 0.00%
- Median HH income
- $37,747
- Composite
- 31.83/100
- National rank
- #11074
- State rank
- #917 of 1141 in TX
Livability — Crowell
- Score
- 67/100
- State rank
- #511
- US rank
- #10114
Category grades
Schools grade is shown separately in the Schools card above.
Census & demographics
- Census place
- Crowell, TX
- Population (ZIP)
- 1,155
Population outlook (Foard County) Hauer SSP2
- Today (2025)
- 1,129 people
- By 2030
- 1,083 · -4.1%
- By 2040
- 1,008 · -10.7%
- By 2050
- 965 · -14.5%
- By 2075
- 1,012 · -10.4%
- By 2100
- 1,089 · -3.5%
Race, ethnicity, and origin ACS 2023
- Neighborhood character
- Predominantly White (70%)
- Race & ethnicity
- White 70% Two or more races 22% Hispanic / Latino 10%
- Hispanic origin (detail)
- Mexican 8%
- Common ancestry
- Italian 4% Serbian 1% Hungarian 1%
- Foreign-born
- 1% · Canada
- Languages at home
- 97% English-only · Spanish 3% Russian/Polish/Slavic 1%
Political lean MEDSL · Foard
- 2024 margin
- Solid R (+65.3) · D 16.9% · R 82.2%
- 2008→2024 swing
- -41.3pp toward R · 2008: -24.0pp · 2024: -65.3pp
- All cycles
- 2024: R+65.3 2020: R+62.8 2016: R+52.8 2012: R+41.8 2008: R+24.0
Not yet ingested
- Civics
- —
Market trends
- HPI YoY
- ▲ 0.75%
- Current HPI
- 62.2371
- Rent YoY
- —
- Metro
- —
- State GDP YoY
- ▲ 3.95%
- F500 in state
- 110
Industry mix (Fortune 500 HQ in TX)
| Industry | F500 HQs | Revenue |
|---|---|---|
| Energy | 16 | $1,198B |
|
||
| Technology | 5 | $198B |
|
||
| Engineering / Construction | 4 | $72B |
|
||
| Energy Services | 3 | $60B |
|
||
| Utilities | 3 | $41B |
|
||
| Healthcare | 2 | $330B |
|
||
Price history
1 event — show timeline
- 2026-06-09 Listed $22,500 WFAOR
Cash-flow waterfall
monthlySold comps — $/sqft
last 12 mo · ≤1 miLoading sold comps…