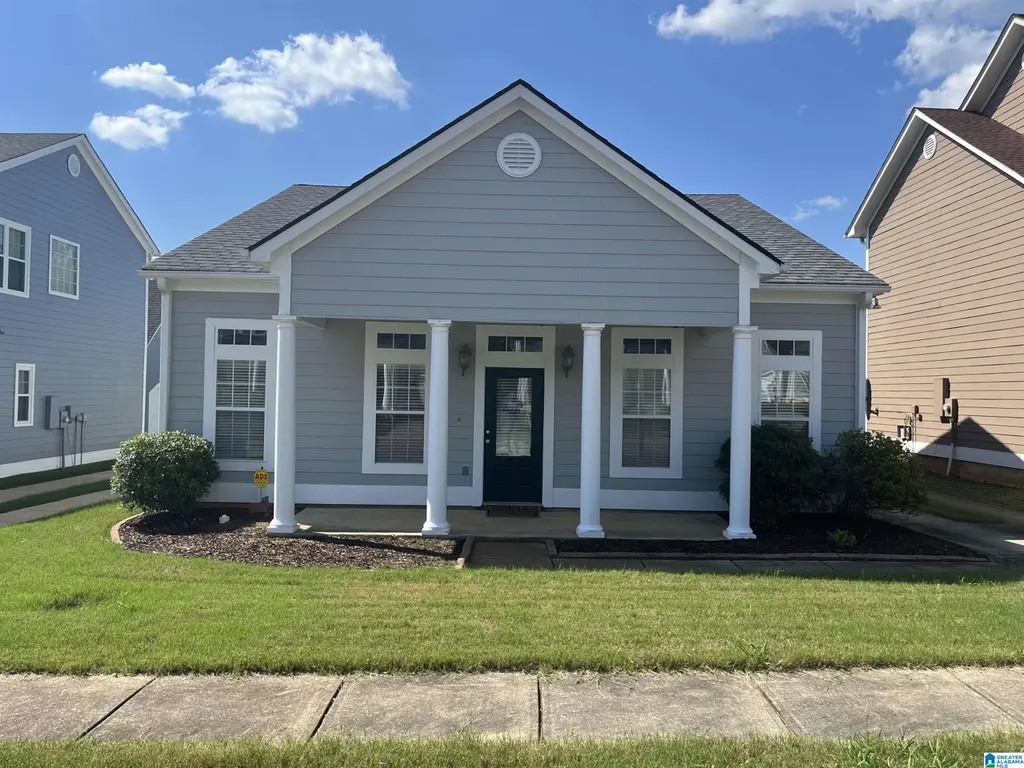
6246 S Clubview Cir · McCalla, AL
Flood risk 1/10 · Minimal
- FEMA flood zone
- X (unshaded)
- Chance of flooding over 30 yrs
- 0.0%
- Est. flood insurance / yr
- $507 – $1,088
Fire risk 4/10 · Minor
- Est. fire insurance / yr
- $916 – $1,700
Heat risk 7/10 · Major
- Hot days now (above 108°F)
- 7 days/yr
- Hot days in 30 yrs
- 20 days/yr
Wind risk 6/10 · Moderate
- Chance of severe wind over 30 yrs
- 46.0%
Air-quality risk 2/10 · Minimal
- Unhealthy air days now
- 2 days/yr
- Unhealthy air days in 30 yrs
- 2 days/yr
Risk factors via First Street. Map © Google.
Why this score? — see what drove the D grade
The composite is a weighted blend of 9 inputs, each scored 0–100. Each bar is that input's sub-score; the figure is the points it added to the 100-point composite (weight × sub-score).
- Cash flow +13.3/30.0
- ARV discount +8.5/15.0
- Rent growth +5.0/5.0
- DSCR +4.0/10.0
- 1% rule +2.9/10.0
- Livability +2.5/5.0
- Condition / age +2.5/5.0
- Schools +1.8/10.0
- Appreciation +0.0/10.0
$289,500
🖨 Deal sheet 📄 Offer letter ✓ Due diligence
Listing remarks
Notes to be added
Key facts
- 6,098 sq ft lot
- 2 garage spots
- Pool
Property features AI
Finance
- Other: Property access via public road; Parcel ID available
- HOA & community: Monthly association fee of $39; HOA fees include common grounds maintenance and recreation facility access
Exterior
- Parking: Rear garage entry; Detached or attached 2-car garage (2 garage spaces on main level); Driveway parking
- Utilities: Public water; Connected sewer; Gas water heater; Underground utilities; Spectrum internet available; Ceiling fans included
- Home design: Siding (Hardiplank) exterior; Slab foundation; Existing (previously built) home; Located in the Letson Farms subdivision
- Construction: Hardiplank siding construction; Slab foundation
- Exterior features: Covered, screened patio; Screened porch; Community in-ground pool; Interior lot; Paved road access with curb and gutters
Interior
- Kitchen: Built-in dishwasher; Built-in microwave; Electric oven; Electric stove; Refrigerator; Some stainless appliances
- Bedrooms: Master bedroom on main level; Additional bedroom(s) on main level; Office/Study located on upper level
- Flooring: Hardwood; Tile; Carpet
- Bathrooms: Two full bathrooms; Garden tub and separate shower in the master bath; Walk-in closets
- Heating & cooling: Dual heating/cooling systems with heat pump (piggyback system); Central air
- Interior features: 9+ ft. ceilings with crown molding and smooth finish; See-through, ventless gas fireplace in the family room; Some window treatments to remain; Laminate countertops in the kitchen; Breakfast bar
- Laundry & utility: Main-level laundry in a closet; Washer hookup provided; Electric dryer hookup; Pull-down attic access
Neighborhood map
What this means for you Summary
Snapshot
- This is a 3-bed/2.0-bath single-family listed at $290k.
Deal economics
- At list price, monthly cash flow is $2 ($25/yr) — positive.
- The deal already cash-flows at list — no discount required.
- To meet the 1% rule (rent ≥ 1% of price), the offer needs to be $227k (21.5% below list).
- Recommended offer: $227k (21.5% below list) — sets the bar for 1% rule.
- Cap rate 6.3% vs local median 4.5% in McCalla — top-decile yield for the area; either an underpriced asset or a hidden risk that comps aren't pricing in. Stress-test before assuming the spread holds.
Location & tenants
- Location reads: area grade D — affects rentability + tenant quality, not the cash-flow math above.
- Jefferson County (suburban): math 9% / reading 32% proficiency, ranked #104 of 129 in AL (top 81%) — low school quality limits family demand, transient renter base, plan for 1-2y turnover.
- Zoned schools: Mcadory Elementary School (math 14% / reading 40%, grade F, #392 of 627 statewide, top 65%, 667 students, 61% FRL); Mcadory High School (math 8% / reading 17%, grade F, #237 of 305 statewide, top 78%, 1,162 students, 72% FRL) — zoned schools average 67% FRL vs 49% district-wide (18 pts higher); higher-poverty schools than district average — tighter screening recommended.
- Market conditions: Rents rising fast (+14.8%/yr); 311 active listings in the ZIP; 6 comparable units currently listed for rent nearby; rentals leasing fast (median 11d on market — plan ~1-2 weeks tenant-placement turnaround); solid renter incomes; 2,114 units permitted in Jefferson County in 2024 (556 in 5+ unit buildings).
- This rent runs 33% of the median local income ($82k/yr) — at the standard rent-burdened threshold; future hikes will face affordability resistance.
Forward outlook
- Local home prices are declining (-3.0%/yr); year-one equity from $2k of loan paydown is wiped out by about $9k of value loss. Plan a longer hold.
- Jefferson County population projected to shrink 4% by 2050 — rents likely to lag national; underwrite the cash flow, not the appreciation.
Negotiation context
- Only 7 days on market — expect competitive offers; lowballing is unlikely to land.
- Current owner paid $165k; list at $290k implies a 75% gain — meaningful room to come down on a strong offer.
Risks & watch-outs
- Climate carrying-cost: major wind risk, 46% chance of damaging wind over 30y; extreme-heat days projected 7→20/yr by 2055 (HVAC capex compounding) — expect insurance premiums to compound above CPI over the hold.
Questions for the listing agent
- What does the HOA fee cover, when was the last increase, and are there any pending special assessments or reserve-fund shortfalls?
- Is there a deadline driving the sale (1031 exchange, divorce, estate, relocation)? That informs how much negotiation room exists.
- The area grade is low — what's the realistic commute time and amenity access for the typical tenant pool here? Any planned neighborhood developments (good or bad) we should know about?
- What's the average days-on-market for RENTAL listings here right now (not sales)? A rising rental-DOM trend means longer vacancies and softer asking-rent achievability than the comps imply.
- What's the recent tenant-quality profile in this submarket — average credit score on applications, eviction rate, late-payment / NSF rate, and stable-employment percentage? A property-management company in the area should have these aggregated.
- How much new for-sale + rental construction is in the pipeline within 1–3 miles? Heavy new supply typically softens prices + rents 12–24 months out; constrained supply supports both.
Investment metrics
- 1% rule
- 0.79% ✗
- Cap rate
- 6.30%
- Cash-on-cash
- 0.03%
- DSCR
- 1.00
- GRM
- 10.6
CMA / ARV
- ARV (on-the-fly)
- $295,750
- Comps found
- 12
Show comp detail 12 sales within ~0.75 mi
| Address | Dist | Beds/Ba | Sqft | Sold | Price | $/sf | Match |
|---|---|---|---|---|---|---|---|
| 4595 Clubview Dr | 0.07mi | 3/2.0 | 1,700 (-3%) | 0mo | $289,000 | $170 | 92 |
| 6250 S Clubview Cir | 0.01mi | 3/2.5 | 1,788 (+2%) | 3mo | $331,000 | $185 | 92 |
| 4692 Clubview Dr | 0.22mi | 3/2.5 | 1,680 (-4%) | 2mo | $270,900 | $161 | 80 |
| 4631 Clubview Dr | 0.07mi | 3/2.0 | 1,543 (-12%) | 1mo | $269,900 | $175 | 76 |
| 6277 S Clubview Cir | 0.08mi | 3/2.0 | 1,543 (-12%) | 3mo | $287,000 | $186 | 74 |
| 4590 Clubview Dr | 0.05mi | 3/2.0 | 1,543 (-12%) | 7mo | $278,000 | $180 | 72 |
| 6327 Lou George Loop | 0.27mi | 3/2.0 | 1,863 (+6%) | 7mo | $242,500 | $130 | 70 |
| 6281 S Clubview Cir | 0.09mi | 3/3.0 | 1,988 (+14%) | 6mo | $299,000 | $150 | 64 |
| 4761 Longmeadow Dr | 0.37mi | 3/2.0 | 1,568 (-10%) | 2mo | $265,000 | $169 | 64 |
| 5793 Riverbirch Dr | 0.63mi | 3/2.0 | 1,675 (-4%) | 3mo | $255,500 | $153 | 61 |
| 5809 Riverbirch Dr | 0.67mi | 3/2.0 | 1,635 (-7%) | 4mo | $260,000 | $159 | 54 |
| 5733 Riverbirch Dr | 0.64mi | 3/2.0 | 1,561 (-11%) | 3mo | $249,000 | $160 | 50 |
Match score weights: distance 35% · size 25% · config 20% · recency 20%. Top-matched comps best support the ARV.
Projected returns pro-forma
-3.0% appreciation · 8.0% rent growth · sell at horizon
- IRR
- -11.4%
- Equity multiple
- 0.57×
- Total profit
- $-34,863
- Equity at exit
- $43,165
- IRR
- 3.4%
- Equity multiple
- 1.30×
- Total profit
- $24,097
- Equity at exit
- $25,031
Cash invested: $81,060 (down + closing). Projections, not guarantees.
Landlord ↔ Tenant lean methodology
- Overall (STATE)
- 90 Strongly Landlord-Friendly
- State Alabama
- 90 Strongly Landlord-Friendly · R+15
- County
- — inherits STATE
- City
- — inherits STATE
ZIP-level market 35022
- Home prices YoY
- -20.2%
- Rents YoY
- 14.8%
- Active inventory
- 311
- Price-to-rent
- 10.6×
Monthly cashflow live
- Estimated rent
- $2,273 high interval (Pro) →
- Mortgage (P&I)
- −$1,518
- Tax from tax record
- −$116 /mo · $1,387/yr
- Insurance
- −$121
- HOA
- −$39
- Vacancy / Maint / Mgmt
- −$477
- Net cashflow
- $2
Break-even live
UW: 25.0% down · 7.5% · 30yr · 1.5% tax · 5.0% vac · 8.0% maint · 8.0% mgmt
Financing live
Cash to close
- Down payment
- $72,375
- Closing costs
- $8,685
- Reserves months
- —
- Total cash needed
- —
Loan-product check · same deal, 3 products live
Conventional
25% down · 7.5% · 30yr
- Down + closing
- —
- Monthly P&I
- —
- Monthly cashflow
- —
- DSCR
- —
- Eligible?
- —
Personal DTI + credit; lowest rate.
DSCR
20% down · 8.5% · 30yr
- Down + closing
- —
- Monthly P&I
- —
- Monthly cashflow
- —
- DSCR
- —
- Eligible?
- —
No personal income docs; deal must DSCR.
Hard money
10% down · 12.0% · 12mo
- Down + closing
- —
- Monthly P&I
- —
- Monthly cashflow
- —
- DSCR
- —
- Eligible?
- —
Short-term bridge; refi at stabilization.
Rent comps 6 comps
| Address | Beds | Baths | Sqft | Rent | $/sqft | DOM | Units | Dist |
|---|---|---|---|---|---|---|---|---|
| 6248 Letson Farms Dr Bessemer, AL | 4.0 | 2.5 | 2300 | $2,300 | $1.00 | 10d | 1 | 0.17mi |
| 4737 Longmeadow Dr Bessemer, AL | 3.0 | 2.0 | 1356 | $1,815 | $1.34 | 10d | 1 | 0.34mi |
| 6062 Overlook Ln Bessemer, AL | 4.0 | 2.5 | 2294 | $2,605 | $1.14 | 43d | 1 | 0.43mi |
| 5725 Riverbirch Dr Bessemer, AL | 3.0 | 2.0 | 1620 | $2,050 | $1.27 | 1d | 1 | 0.65mi |
| 4691 Woodford Cir Bessemer, AL | 3.0 | 2.5 | 1890 | $2,090 | $1.11 | 43d | 1 | 0.99mi |
| 4897 Newbridge Blvd Bessemer, AL | 4.0 | 2.0 | 1774 | $2,095 | $1.18 | 11d | 1 | 1.10mi |
HOA detail
- Monthly dues
- $39 · $468/yr
Listing history 6 events
-
2026-06-18days on market $289,500 Coming Soon 7 DOM
-
2026-06-17days on market $289,500 Coming Soon 6 DOM
-
2026-06-16days on market $289,500 Coming Soon 5 DOM
-
2026-06-15days on market $289,500 Coming Soon 4 DOM
-
2026-06-13remarks 17-char remark
-
2026-06-13$289,500 Coming Soon 2 DOM
ⓘ Source: listings_history table (triggers on properties + properties_extension) + one-shot
backfill from property_details.listing_events for pre-trigger history.
Tax reassessment forecast AL · Resets to sale price
- Current annual tax
- $1,387 · $116/mo
- Projected year-2 tax
- $1,387 · $116/mo
- Expected delta
- $0/yr ($0/mo · 0.0%)
ⓘ Screening estimate from a state-policy table — verify with the county assessor before closing.
Climate risk First Street
- Flood 1/10 Low FEMA zone X (unshaded) · 0% chance over 30 yrs
- Wildfire 4/10 Moderate
- Heat 7/10 Severe 7 d/yr ≥108°F today · 20 d/yr by 30 yrs out
- Wind 6/10 Major 46% chance of damaging wind over 30 yrs
- Air quality 2/10 Low 2 unhealthy d/yr today · 2 by 30 yrs out
Nearby sold comps map
Loading sold comps map…
Walkable amenities ~0.75 mi
Loading nearby amenities…
Taxation est. · year 1
- Rental income
- $27,272
- − Mortgage interest
- −$16,217
- − Property taxes
- −$1,387
- − Insurance
- −$1,448
- − Repairs & maintenance
- −$2,182
- − Management
- −$2,182
- − HOA
- −$468
- − Depreciation
- −$8,422
- Taxable loss
- −$5,032
- Est. tax savings @ 24.0%
- +$1,208
- After-tax cash flow
- $1,232/yr
For passive investors: Depreciation is non-cash, so a rental often shows a tax loss while cash-flowing — sheltering income. Rental losses are passive: they offset passive income freely, and up to $25,000/yr can offset ordinary (W-2) income if you actively participate and your MAGI is under $100k (phasing out to $0 by $150k); unused losses carry forward. On sale, claimed depreciation is recaptured at up to 25%, and gains may owe capital-gains tax (a 1031 exchange can defer both). Figures are a year-1 estimate at your 24.0% rate — not tax advice; consult a CPA.
Schools (NCES district)
- District
- Jefferson County
- NCES district ID
- 0101920
- Math proficiency
- 9% ▼ -24.00%
- Reading proficiency
- 32% ▼ -5.00%
- Median HH income
- $51,712
- Composite
- 18.4/100
- National rank
- #8937
- State rank
- #104 of 129 in AL
Livability — McCalla
No livability data for this city. (Only ~50 U.S. cities are tracked.)
Census & demographics
- Census place
- McCalla, AL
- County
- Jefferson County · 527,445 people
- Metro
- Birmingham-Hoover, AL
- Population (ZIP)
- 23,126
- Household income
- $81,846
- Rent vs Own
- Severe rent burden
- 554.0
Population outlook (Jefferson County) Hauer SSP2
- Today (2025)
- 669,185 people
- By 2030
- 669,694 · +0.1%
- By 2040
- 661,388 · -1.2%
- By 2050
- 643,086 · -3.9%
- By 2075
- 577,267 · -13.7%
- By 2100
- 474,758 · -29.1%
Race, ethnicity, and origin ACS 2023
- Neighborhood character
- Diverse neighborhood (Simpson 0.56)
- Race & ethnicity
- Black 53% White 41% Hispanic / Latino 3% Two or more races 2% Asian 1%
- Common ancestry
- Italian 1% Slovak 1% Iranian 1%
- Foreign-born
- 4% · Canada, China
- Languages at home
- 96% English-only · Spanish 3% Chinese 1%
Political lean MEDSL · Jefferson
- 2024 margin
- D (+10.4) · D 54.6% · R 44.2% · Other 1.2%
- 2008→2024 swing
- +5.4pp toward D · 2008: 5.1pp · 2024: 10.4pp
- All cycles
- 2024: D+10.4 2020: D+13.2 2016: D+7.2 2012: D+6.0 2008: D+5.1
Not yet ingested
- Civics
- —
Market trends
- HPI YoY
- ▼ -55.40%
- Current HPI
- 219.3839
- Rent YoY
- ▲ 14.80%
- Metro
- Birmingham-Hoover, AL
- State GDP YoY
- ▲ 2.94%
- F500 in state
- 4
Industry mix (Fortune 500 HQ in AL)
| Industry | F500 HQs | Revenue |
|---|---|---|
| Financial Services | 1 | $8B |
|
||
| Healthcare | 1 | $5B |
|
||
Price history
+75.5% since first listed2 events — show timeline
- 2026-06-11 Coming Soon $289,500 Greater Alabama MLS
- 2019-04-18 Sold (Public Records) $165,000 Public Records
Property tax history
+2.9%/yrLatest (2025): $1,387 · -1.4% YoY. Source: county tax records.
Cash-flow waterfall
monthlySold comps — $/sqft
last 12 mo · ≤1 miLoading sold comps…