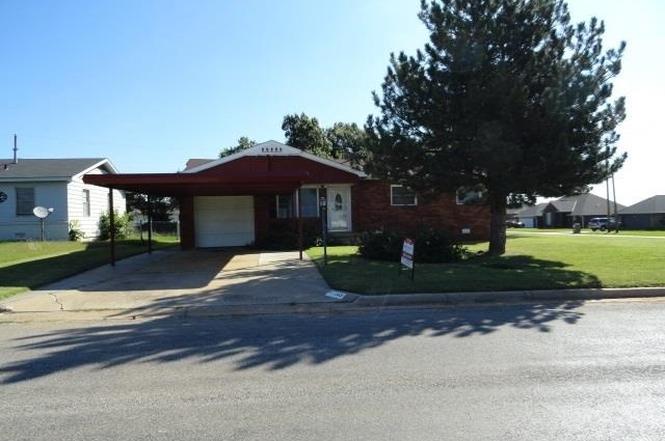
102 K St · Elgin, OK
Flood risk No data
- FEMA flood zone
- —
- Chance of flooding over 30 yrs
- —
- Est. flood insurance / yr
- —
Fire risk No data
- Est. fire insurance / yr
- —
Heat risk No data
- Hot days now (above threshold)
- —
- Hot days in 30 yrs
- —
Wind risk No data
- Chance of severe wind over 30 yrs
- —
Air-quality risk No data
- Unhealthy air days now
- —
- Unhealthy air days in 30 yrs
- —
Risk factors via First Street. Map © Google.
Why this score? — see what drove the A- grade
The composite is a weighted blend of 9 inputs, each scored 0–100. Each bar is that input's sub-score; the figure is the points it added to the 100-point composite (weight × sub-score).
- Cash flow +28.5/30.0
- ARV discount +13.9/15.0
- DSCR +10.0/10.0
- Appreciation +10.0/10.0
- 1% rule +7.2/10.0
- Livability +3.7/5.0
- Schools +3.0/10.0
- Rent growth +2.5/5.0
- Condition / age +2.5/5.0
$150,000
🖨 Deal sheet 📄 Offer letter ✓ Due diligence
Listing remarks MLS
Great starter home or downsizing. This corner lot home has mature pecan trees. 3 Bedrooms, 2 3/4 baths, storm shelter, 1 car garage and carport. Call Sue @ 580-512-1942 for more information. Owner is offering a $5,000 decorating allowance with a full offer.
Key facts
- Storage shed
- Easy access to 1-44
- Corner lot
Tags
Property features AI
Exterior
- Parking: 2 total parking spaces; 1-car garage; 1-car carport; 2 covered spaces
- Security: Carbon monoxide detector(s); Smoke detector(s)
- Utilities: Public water; Public sewer; Natural gas available
- Home design: Single family residence; One story
- Construction: Brick veneer construction
- Exterior features: Storm door(s); Shed(s); Composition roof; No fencing
Interior
- Kitchen: Oven; Refrigerator; Range hood
- Flooring: Vinyl; Carpet; Hardwood
- Bathrooms: 1 full bathroom; 1 three-quarter bathroom
- Heating & cooling: Natural gas heating; Central air; Ceiling fan(s); Electric cooling
- Interior features: Walk-in closet(s); Double pane windows
- Laundry & utility: Washer hookup; Gas water heater
Neighborhood map
What this means for you Summary
Snapshot
- This is a 3-bed/1.0-bath single-family listed at $150k.
Deal economics
- At list price, monthly cash flow is $489 ($6k/yr) — positive.
- The deal already cash-flows at list — no discount required.
- Meets the 1% rule at list price ($2k rent vs $150k).
- Recommended offer: $136k (9.0% below list) — sets the bar for market timing.
- Cap rate 10.2% vs local median 5.1% in Elgin — top-decile yield for the area; either an underpriced asset or a hidden risk that comps aren't pricing in. Stress-test before assuming the spread holds.
Location & tenants
- Location reads 73/100 on livability (#17 in OK) — a middle-class / working-renter tenant base. Strengths: crime A+, housing A+, cost of living A; Watch: amenities F, commute F, health & safety F.
- Elgin (rural): math 29% / reading 36% proficiency, ranked #38 of 270 in OK (top 14%) — families likely to look elsewhere, expect single-tenant / working-renter base with shorter leases.
- Zoned schools: Elgin Es (math 36% / reading 33%, grade F, #168 of 845 statewide, top 24%, 945 students, 0% FRL); Elgin Ms (math 26% / reading 34%, grade F, #49 of 345 statewide, top 15%, 791 students, 0% FRL); Elgin Hs (math 27% / reading 47%, grade F, #42 of 447 statewide, top 10%, 771 students, 0% FRL) — zoned schools average 0% FRL vs 29% district-wide (29 pts lower); this property's tenant base skews higher-income than the district average.
- Market conditions: 95 active listings in the ZIP; 6 comparable units currently listed for rent nearby; rentals at typical pace (median 24d on market — plan ~3-4 weeks tenant-placement turnaround); solid renter incomes; 133 units permitted in Comanche County in 2024 (0 in 5+ unit buildings).
Forward outlook
- In year one you build about $16k of equity ($1k loan paydown + $15k appreciation (10.0% local appreciation)).
- Comanche County population projected to shrink 3% by 2050 — rents likely to lag national; underwrite the cash flow, not the appreciation.
- At projected returns (10.0% appreciation + 3.0% rent growth), your $42k cash investment doubles in ~2 years — after that, you're playing with house money.
- By year 3, paydown + projected appreciation supports a ~$41k cash-out refi (75% LTV) — recoverable capital for the next deal without selling this one.
Negotiation context
- It's been on market 114 days — a 9% lower offer ($136k) is reasonable based on typical stale-listing flexibility.
- 3 sale attempts since 8y ago with the ask held roughly flat each time — persistent listings suggest the price (not the market) is what's stuck; bring a comps-based counter.
- Current owner paid $105k; 43% above their basis — modest negotiation headroom, anchor on the comps not their cost.
Questions for the listing agent
- It's been on market 114 days. Have you received any prior offers? Is the seller open to a 9% concession, seller financing, or rate buy-down credit?
- Built in 1960 — when were the roof, HVAC, electrical panel, plumbing, and water heater last replaced?
- Why hasn't it sold? Are there any deal-killer items the seller is aware of (foundation, flood, title, zoning, code violations)?
- Is there a deadline driving the sale (1031 exchange, divorce, estate, relocation)? That informs how much negotiation room exists.
- What's the average days-on-market for RENTAL listings here right now (not sales)? A rising rental-DOM trend means longer vacancies and softer asking-rent achievability than the comps imply.
- What's the recent tenant-quality profile in this submarket — average credit score on applications, eviction rate, late-payment / NSF rate, and stable-employment percentage? A property-management company in the area should have these aggregated.
- How much new for-sale + rental construction is in the pipeline within 1–3 miles? Heavy new supply typically softens prices + rents 12–24 months out; constrained supply supports both.
Investment metrics
- 1% rule
- 1.22% ✓
- Cap rate
- 10.20%
- Cash-on-cash
- 13.97%
- DSCR
- 1.62
- GRM
- 6.9
CMA / ARV
- ARV (on-the-fly)
- $174,754
- Comps found
- 12
Show comp detail 12 sales within ~0.75 mi
| Address | Dist | Beds/Ba | Sqft | Sold | Price | $/sf | Match |
|---|---|---|---|---|---|---|---|
| 203 Maple St | 0.08mi | 3/1.0 | 1,300 (-2%) | 6mo | $170,000 | $131 | 87 |
| 208 K St | 0.09mi | 3/1.0 | 1,200 (-10%) | 1mo | $112,000 | $93 | 78 |
| 106 Oak | 0.11mi | 3/2.0 | 1,200 (-10%) | 1mo | $118,000 | $98 | 73 |
| 718 5th St | 0.29mi | 3/2.0 | 1,344 (+1%) | 9mo | $226,000 | $168 | 73 |
| 107 Oak St | 0.09mi | 4/1.0 (+1) | 1,200 (-10%) | 1mo | $125,000 | $104 | 73 |
| 70 NE Deerfield Dr | 0.41mi | 3/2.0 | 1,300 (-2%) | 1mo | $224,000 | $172 | 72 |
| 611 7th St | 0.49mi | 3/2.0 | 1,300 (-2%) | 5mo | $117,000 | $90 | 65 |
| 209 H St | 0.24mi | 2/2.0 (-1) | 1,200 (-10%) | 14mo | $73,500 | $61 | 52 |
| 311 Crestview Dr | 0.68mi | 2/1.0 (-1) | 1,244 (-7%) | 3mo | $180,000 | $145 | 50 |
| 421 H St | 0.34mi | 3/2.0 | 1,500 (+12%) | 13mo | $191,000 | $127 | 48 |
| 304 Crestview Dr | 0.62mi | 3/2.0 | 1,200 (-10%) | 7mo | $185,000 | $154 | 44 |
| 209 Glover Cir | 0.74mi | 3/2.0 | 1,500 (+12%) | 3mo | $220,000 | $147 | 38 |
Match score weights: distance 35% · size 25% · config 20% · recency 20%. Top-matched comps best support the ARV.
Projected returns pro-forma
10.0% appreciation · 3.0% rent growth · sell at horizon
- IRR
- 34.6%
- Equity multiple
- 3.69×
- Total profit
- $112,811
- Equity at exit
- $135,132
- IRR
- 29.8%
- Equity multiple
- 8.33×
- Total profit
- $307,671
- Equity at exit
- $291,417
Cash invested: $42,000 (down + closing). Projections, not guarantees.
Landlord ↔ Tenant lean methodology
- Overall (STATE)
- 83 Strongly Landlord-Friendly
- State Oklahoma
- 83 Strongly Landlord-Friendly · R+20
- County
- — inherits STATE
- City
- — inherits STATE
ZIP-level market 73538
- Home prices YoY
- 22.9%
- Active inventory
- 95
- Price-to-rent
- 6.9×
Monthly cashflow live
- Estimated rent
- $1,824 high interval (Pro) →
- Mortgage (P&I)
- −$787
- Tax from tax record
- −$103 /mo · $1,233/yr
- Insurance
- −$62
- HOA
- −$0
- Vacancy / Maint / Mgmt
- −$383
- Net cashflow
- $489
Break-even live
UW: 25.0% down · 7.5% · 30yr · 1.5% tax · 5.0% vac · 8.0% maint · 8.0% mgmt
Financing live
Cash to close
- Down payment
- $37,500
- Closing costs
- $4,500
- Reserves months
- —
- Total cash needed
- —
Loan-product check · same deal, 3 products live
Conventional
25% down · 7.5% · 30yr
- Down + closing
- —
- Monthly P&I
- —
- Monthly cashflow
- —
- DSCR
- —
- Eligible?
- —
Personal DTI + credit; lowest rate.
DSCR
20% down · 8.5% · 30yr
- Down + closing
- —
- Monthly P&I
- —
- Monthly cashflow
- —
- DSCR
- —
- Eligible?
- —
No personal income docs; deal must DSCR.
Hard money
10% down · 12.0% · 12mo
- Down + closing
- —
- Monthly P&I
- —
- Monthly cashflow
- —
- DSCR
- —
- Eligible?
- —
Short-term bridge; refi at stabilization.
Rent comps 6 comps
| Address | Beds | Baths | Sqft | Rent | $/sqft | DOM | Units | Dist |
|---|---|---|---|---|---|---|---|---|
| 107 Oak St Elgin, OK | 4.0 | 1.0 | 1300 | $1,295 | $1.00 | 12d | 1 | 0.07mi |
| 1205 Alma Dr Elgin, OK | 4.0 | 2.0 | 1800 | $1,900 | $1.06 | 12d | 1 | 0.19mi |
| 1534 Stonehouse Dr Elgin, OK | 3.0 | 2.0 | 1700 | $1,975 | $1.16 | 23d | 1 | 0.33mi |
| 1517 Stonehouse Dr Elgin, OK | 4.0 | 2.0 | 1565 | $1,700 | $1.09 | 21d | 1 | 0.41mi |
| 313 Marilyn Glover Dr Elgin, OK | 3.0 | 2.0 | 1600 | $1,650 | $1.03 | 23d | 1 | 0.80mi |
| 1201 Kensington Ln Elgin, OK | 2.0–3.0 | 2.0–2.5 | 1414 | $1,700 | $1.20 | 23d | 1 | 1.36mi |
Listing history 22 events
-
2026-06-19days on market $150,000 Active 114 DOM
-
2026-06-18days on market $150,000 Active 113 DOM
-
2026-06-17days on market $150,000 Active 112 DOM
-
2026-06-16days on market $150,000 Active 111 DOM
-
2026-06-15days on market $150,000 Active 110 DOM
-
2026-06-14days on market $150,000 Active 108 DOM
-
2026-06-13days on market $150,000 Active 107 DOM
-
2026-06-10days on market $150,000 Active 105 DOM
-
2026-06-09days on market $150,000 Active 104 DOM
-
2026-06-08days on market $150,000 Active 103 DOM
-
2026-06-07days on market $150,000 Active 102 DOM
-
2026-06-05days on market $150,000 Active 99 DOM
-
2026-06-02days on market $150,000 Active 97 DOM
-
2026-06-01days on market $150,000 Active 96 DOM
-
2026-05-31days on market $150,000 Active 95 DOM
-
2026-05-30days on market $150,000 Active 94 DOM
-
2026-02-25$150,000 Active
-
2026-01-07price $160,000
-
2025-09-05$175,000 Active
-
2018-11-19soldstatus $105,100
-
2018-11-16soldstatus $105,000 257-char remark
Show marketing remark (257 chars)
Great starter home or downsizing. This corner lot home has mature pecan trees. 3 Bedrooms, 2 3/4 baths, storm shelter, 1 car garage and carport. Call Sue @ 580-512-1942 for more information. Owner is offering a $5,000 decorating allowance with a full offer.
-
2018-04-03$105,000 257-char remark
Show marketing remark (257 chars)
Great starter home or downsizing. This corner lot home has mature pecan trees. 3 Bedrooms, 2 3/4 baths, storm shelter, 1 car garage and carport. Call Sue @ 580-512-1942 for more information. Owner is offering a $5,000 decorating allowance with a full offer.
ⓘ Source: listings_history table (triggers on properties + properties_extension) + one-shot
backfill from property_details.listing_events for pre-trigger history.
Tax reassessment forecast OK · Resets to sale price
- Current annual tax
- $1,233 · $103/mo
- Projected year-2 tax
- $1,350 · $112/mo
- Expected delta
- +$117/yr (+$10/mo · 9.5%)
ⓘ Screening estimate from a state-policy table — verify with the county assessor before closing.
Nearby sold comps map
Loading sold comps map…
Walkable amenities ~0.75 mi
Loading nearby amenities…
Taxation est. · year 1
- Rental income
- $21,886
- − Mortgage interest
- −$8,402
- − Property taxes
- −$1,233
- − Insurance
- −$750
- − Repairs & maintenance
- −$1,751
- − Management
- −$1,751
- − Depreciation
- −$4,364
- Taxable income
- $3,635
- Est. tax owed @ 24.0%
- −$872
- After-tax cash flow
- $4,995/yr
For passive investors: Depreciation is non-cash, so a rental often shows a tax loss while cash-flowing — sheltering income. Rental losses are passive: they offset passive income freely, and up to $25,000/yr can offset ordinary (W-2) income if you actively participate and your MAGI is under $100k (phasing out to $0 by $150k); unused losses carry forward. On sale, claimed depreciation is recaptured at up to 25%, and gains may owe capital-gains tax (a 1031 exchange can defer both). Figures are a year-1 estimate at your 24.0% rate — not tax advice; consult a CPA.
Schools (NCES district)
- District
- Elgin
- NCES district ID
- 4010710
- Math proficiency
- 29% ▼ -9.00%
- Reading proficiency
- 36% ▼ -5.00%
- Median HH income
- $65,900
- Composite
- 29.77/100
- National rank
- #6432
- State rank
- #38 of 270 in OK
Livability — Elgin
- Score
- 73/100
- State rank
- #17
- US rank
- #5411
Category grades
Schools grade is shown separately in the Schools card above.
Census & demographics
- Census place
- Elgin, OK
- County
- Comanche County · 96,361 people
- City population
- 7,128
- Metro
- Lawton, OK
- Population (ZIP)
- 7,128
- Household income
- $91,324
- Rent vs Own
- Severe rent burden
- 70.0
Population outlook (Comanche County) Hauer SSP2
- Today (2025)
- 124,518 people
- By 2030
- 124,231 · -0.2%
- By 2040
- 122,193 · -1.9%
- By 2050
- 120,368 · -3.3%
- By 2075
- 120,492 · -3.2%
- By 2100
- 123,113 · -1.1%
Race, ethnicity, and origin ACS 2023
- Neighborhood character
- Predominantly White (71%)
- Race & ethnicity
- White 71% Two or more races 15% Hispanic / Latino 13% Native American 4% Black 2% Asian 1%
- Hispanic origin (detail)
- Mexican 11% Puerto Rican 2%
- Common ancestry
- Slovak 5% Romanian 2% Serbian 1%
- Foreign-born
- 3% · Canada
- Languages at home
- 93% English-only · Spanish 4% German/W. Germanic 1%
Political lean MEDSL · Comanche
- 2024 margin
- Strong R (+23.3) · D 37.4% · R 60.7% · Other 1.9%
- 2008→2024 swing
- -5.8pp toward R · 2008: -17.5pp · 2024: -23.3pp
- All cycles
- 2024: R+23.3 2020: R+20.1 2016: R+23.7 2012: R+17.0 2008: R+17.5
Not yet ingested
- Civics
- —
Market trends
- HPI YoY
- ▲ 45.70%
- Current HPI
- 245.4249
- Rent YoY
- —
- Metro
- Lawton, OK
- State GDP YoY
- ▲ 1.55%
- F500 in state
- 6
Industry mix (Fortune 500 HQ in OK)
| Industry | F500 HQs | Revenue |
|---|---|---|
| Energy | 3 | $48B |
|
||
Price history
+42.9% since first listed6 events — show timeline
- 2026-02-25 Listed $150,000 LBRMLS
- 2026-01-07 Price Changed $160,000 LBRMLS
- 2025-09-05 Listed $175,000 LBRMLS
- 2018-11-19 Sold (Public Records) $105,100 Public Records
- 2018-11-16 Sold (MLS) $105,000 LBRMLS
- 2018-04-03 Listed $105,000 LBRMLS
Property tax history
+8.1%/yrLatest (2025): $1,233 · +1.1% YoY. Source: county tax records.
Cash-flow waterfall
monthlySold comps — $/sqft
last 12 mo · ≤1 miLoading sold comps…