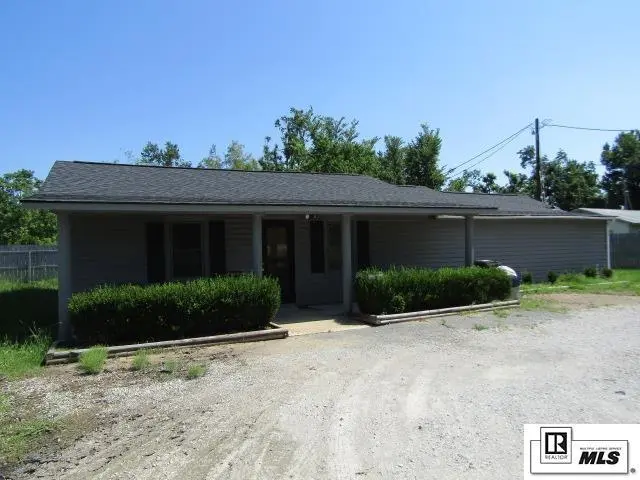
3 Insurance Rd · Rayville, LA
Flood risk No data
- FEMA flood zone
- —
- Chance of flooding over 30 yrs
- —
- Est. flood insurance / yr
- —
Fire risk No data
- Est. fire insurance / yr
- —
Heat risk No data
- Hot days now (above threshold)
- —
- Hot days in 30 yrs
- —
Wind risk No data
- Chance of severe wind over 30 yrs
- —
Air-quality risk No data
- Unhealthy air days now
- —
- Unhealthy air days in 30 yrs
- —
Risk factors via First Street. Map © Google.
Why this score? — see what drove the B- grade
The composite is a weighted blend of 9 inputs, each scored 0–100. Each bar is that input's sub-score; the figure is the points it added to the 100-point composite (weight × sub-score).
- Cash flow +30.0/30.0
- 1% rule +10.0/10.0
- DSCR +10.0/10.0
- ARV discount +7.5/15.0
- Livability +3.2/5.0
- Rent growth +2.5/5.0
- Condition / age +2.2/5.0
- Schools +1.4/10.0
- Appreciation +0.0/10.0
$100,000
🖨 Deal sheet 📄 Offer letter ✓ Due diligence
Listing remarks
This property is located just west of the Rayville city limits with convenient shopping and close to schools. The dwelling has been renovated and is move in ready. Call your favorite realtor for showing!
Key facts
- Close to schools
- Renovated
- Convenient shopping
Tags
Property features AI
Finance
- Other: Property type: Residential
- HOA & community: Has homeowners association (no listed association amenities)
Exterior
- Parking: Open parking; Gravel parking
- Security: Smoke detector(s)
- Utilities: Public water; No natural gas available
- Home design: Single family residence; Site build; One level; Entry level 1
- Construction: Vinyl siding with frame construction; Asphalt roof; Slab foundation; Built on one level
- Exterior features: Covered patio/porch; Wood fencing; Corner lot
Interior
- Kitchen: Range hood; Electric range
- Bedrooms: 2 main-level bedrooms
- Bathrooms: 1 full bathroom; 1 half bathroom; 2 main-level bathrooms; 1 partial bathroom
- Heating & cooling: Central heating (electric); Central air conditioning (electric)
- Interior features: Walk-in closet(s); Double-pane windows with blinds; Range hood; Electric range; Electric water heater
- Laundry & utility: Electric water heater
Neighborhood map
What this means for you Summary
Snapshot
- This is a 2-bed/1.5-bath single-family listed at $100k. Condition is rated fair.
Deal economics
- At list price, monthly cash flow is $1k ($13k/yr) — positive.
- The deal already cash-flows at list — no discount required.
- Meets the 1% rule at list price ($2k rent vs $100k).
Location & tenants
- Location reads 65/100 on livability (#158 in LA) — a middle-class / working-renter tenant base. Strengths: cost of living A+, health & safety A+; Watch: crime C-, schools F, amenities F.
- Richland Parish (rural): math 12% / reading 22% proficiency, ranked #73 of 98 in LA (top 74%) — low school quality limits family demand, transient renter base, plan for 1-2y turnover; 76% free/reduced lunch — lower-income household profile, screen leases tightly.
- Market conditions: 100 active listings in the ZIP; 27 units permitted in Richland Parish in 2024 (0 in 5+ unit buildings).
Forward outlook
- Local home prices are declining (-3.0%/yr); year-one equity from $691 of loan paydown is wiped out by about $3k of value loss. Plan a longer hold.
- Richland County population projected to shrink 9% by 2050 — rents likely to lag national; underwrite the cash flow, not the appreciation.
- At projected returns (-3.0% appreciation + 3.0% rent growth), your $28k cash investment doubles in ~3 years — after that, you're playing with house money.
Negotiation context
- Only 4 days on market — expect competitive offers; lowballing is unlikely to land.
Questions for the listing agent
- Have any recent inspections been done? Can we get a copy of the seller's disclosures and any deferred-maintenance estimates?
- Is there a deadline driving the sale (1031 exchange, divorce, estate, relocation)? That informs how much negotiation room exists.
- Schools are F-rated, which usually means shorter tenancies and higher turnover. Who's the typical renter profile here, and what's been the actual vacancy rate?
- What's the average days-on-market for RENTAL listings here right now (not sales)? A rising rental-DOM trend means longer vacancies and softer asking-rent achievability than the comps imply.
- What's the recent tenant-quality profile in this submarket — average credit score on applications, eviction rate, late-payment / NSF rate, and stable-employment percentage? A property-management company in the area should have these aggregated.
- How much new for-sale + rental construction is in the pipeline within 1–3 miles? Heavy new supply typically softens prices + rents 12–24 months out; constrained supply supports both.
Investment metrics
- 1% rule
- 2.19% ✓
- Cap rate
- 18.80%
- Cash-on-cash
- 44.67%
- DSCR
- 2.99
- GRM
- 3.8
CMA / ARV
No comps found within radius.
Projected returns pro-forma
-3.0% appreciation · 3.0% rent growth · sell at horizon
- IRR
- 41.7%
- Equity multiple
- 2.79×
- Total profit
- $50,217
- Equity at exit
- $14,910
- IRR
- 47.9%
- Equity multiple
- 5.62×
- Total profit
- $129,348
- Equity at exit
- $8,646
Cash invested: $28,000 (down + closing). Projections, not guarantees.
Landlord ↔ Tenant lean methodology
- Overall (STATE)
- 90 Strongly Landlord-Friendly
- State Louisiana
- 90 Strongly Landlord-Friendly · R+12
- County
- — inherits STATE
- City
- — inherits STATE
ZIP-level market 71269
- Home prices YoY
- -26.4%
- Active inventory
- 100
- Price-to-rent
- 3.8×
Monthly cashflow live
- Estimated rent
- $2,194 medium interval (Pro) →
- Mortgage (P&I)
- −$524
- Tax est. 1.5%
- −$125 /mo · $1,500/yr
- Insurance
- −$42
- HOA
- −$0
- Vacancy / Maint / Mgmt
- −$461
- Net cashflow
- $1,042
Break-even live
UW: 25.0% down · 7.5% · 30yr · 1.5% tax · 5.0% vac · 8.0% maint · 8.0% mgmt
Financing live
Cash to close
- Down payment
- $25,000
- Closing costs
- $3,000
- Reserves months
- —
- Total cash needed
- —
Loan-product check · same deal, 3 products live
Conventional
25% down · 7.5% · 30yr
- Down + closing
- —
- Monthly P&I
- —
- Monthly cashflow
- —
- DSCR
- —
- Eligible?
- —
Personal DTI + credit; lowest rate.
DSCR
20% down · 8.5% · 30yr
- Down + closing
- —
- Monthly P&I
- —
- Monthly cashflow
- —
- DSCR
- —
- Eligible?
- —
No personal income docs; deal must DSCR.
Hard money
10% down · 12.0% · 12mo
- Down + closing
- —
- Monthly P&I
- —
- Monthly cashflow
- —
- DSCR
- —
- Eligible?
- —
Short-term bridge; refi at stabilization.
Listing history 5 events
-
2026-06-10status $100,000 Pending 4 DOM
-
2026-06-09days on market $100,000 Active 4 DOM
-
2026-06-08days on market $100,000 Active 3 DOM
-
2026-06-07remarks 203-char remark
-
2026-06-07$100,000 Active 2 DOM
ⓘ Source: listings_history table (triggers on properties + properties_extension) + one-shot
backfill from property_details.listing_events for pre-trigger history.
Nearby sold comps map
Loading sold comps map…
Walkable amenities ~0.75 mi
Loading nearby amenities…
Taxation est. · year 1
- Rental income
- $26,331
- − Mortgage interest
- −$5,602
- − Property taxes
- −$1,500
- − Insurance
- −$500
- − Repairs & maintenance
- −$2,106
- − Management
- −$2,106
- − Depreciation
- −$2,909
- Taxable income
- $11,607
- Est. tax owed @ 24.0%
- −$2,786
- After-tax cash flow
- $9,723/yr
For passive investors: Depreciation is non-cash, so a rental often shows a tax loss while cash-flowing — sheltering income. Rental losses are passive: they offset passive income freely, and up to $25,000/yr can offset ordinary (W-2) income if you actively participate and your MAGI is under $100k (phasing out to $0 by $150k); unused losses carry forward. On sale, claimed depreciation is recaptured at up to 25%, and gains may owe capital-gains tax (a 1031 exchange can defer both). Figures are a year-1 estimate at your 24.0% rate — not tax advice; consult a CPA.
Condition & rehab AI · 14 photos
The home is in fair condition with some cosmetic repairs and maintenance needed. Painting the exterior and interior walls and landscaping will significantly increase its resale and rental value.
Repairs flagged
- Major Siding — The siding is peeling and discoloration is visible, indicating significant damage.
- Major Landscaping — The landscaping is overgrown and needs trimming, which will improve the curb appeal.
Value-add opportunities
- Resale Painting the exterior and interior walls — Painting the exterior and interior walls will improve the curb appeal and the overall appearance of the home, making it more attractive to potential buyers.
- Both Landscaping — Landscaping will improve the curb appeal and the overall appearance of the home, making it more attractive to potential buyers and renters.
Renovation cost estimate screening
| Repair item | Severity | Est. cost |
|---|---|---|
| Siding · The siding is peeling and discoloration is visible, indicating significant damage. | Major | $15,000–50,000 |
| Landscaping · The landscaping is overgrown and needs trimming, which will improve the curb appeal. | Major | $15,000–50,000 |
| Total estimated repair cost · 2 items | $30,000–100,000 |
Value-add ROI direction
- Resale Painting the exterior and interior walls — Painting the exterior and interior walls will improve the curb appeal and the overall appearance of the home, making it more attractive to potential buyers. ↑
- Both Landscaping — Landscaping will improve the curb appeal and the overall appearance of the home, making it more attractive to potential buyers and renters. ↑
ⓘ Cost ranges are severity-bucket heuristics (US national rule-of-thumb). Get contractor quotes + a written scope before underwriting a rehab budget.
Schools (NCES district)
- District
- Richland Parish
- NCES district ID
- 2201350
- Math proficiency
- 12% ▼ -36.00%
- Reading proficiency
- 22% ▼ -31.00%
- Median HH income
- $36,097
- Composite
- 14.06/100
- National rank
- #9464
- State rank
- #73 of 98 in LA
Livability — Rayville
- Score
- 65/100
- State rank
- #158
- US rank
- #13606
Category grades
Schools grade is shown separately in the Schools card above.
Census & demographics
- Population (ZIP)
- 12,475
Population outlook (Richland County) Hauer SSP2
- Today (2025)
- 20,283 people
- By 2030
- 19,990 · -1.4%
- By 2040
- 19,240 · -5.1%
- By 2050
- 18,497 · -8.8%
- By 2075
- 16,626 · -18.0%
- By 2100
- 14,204 · -30.0%
Race, ethnicity, and origin ACS 2023
- Neighborhood character
- Majority White (60%)
- Race & ethnicity
- White 60% Black 36% Two or more races 3% Hispanic / Latino 2%
- Common ancestry
- Slovak 3% Lithuanian 2% Romanian 1%
- Foreign-born
- 0% · Canada
- Languages at home
- 98% English-only · Spanish 1%
Political lean MEDSL · Richland
- 2024 margin
- Solid R (+39.4) · D 29.7% · R 69.1% · Other 1.2%
- 2008→2024 swing
- -12.8pp toward R · 2008: -26.6pp · 2024: -39.4pp
- All cycles
- 2024: R+39.4 2020: R+34.0 2016: R+32.6 2012: R+28.2 2008: R+26.6
Not yet ingested
- Civics
- —
Market trends
- HPI YoY
- ▼ -56.82%
- Current HPI
- 158.2193
- Rent YoY
- —
- Metro
- —
- State GDP YoY
- ▲ 3.29%
- F500 in state
- 10
Industry mix (Fortune 500 HQ in LA)
| Industry | F500 HQs | Revenue |
|---|---|---|
| Telecommunications | 2 | $23B |
|
||
| Utilities | 1 | $12B |
|
||
| Wholesale / Distribution | 1 | $5B |
|
||
| Advertising | 1 | $2B |
|
||
Price history
1 event — show timeline
- 2026-06-03 Listed $100,000 NELABOR
Cash-flow waterfall
monthlySold comps — $/sqft
last 12 mo · ≤1 miLoading sold comps…