 🌊 Lakefront
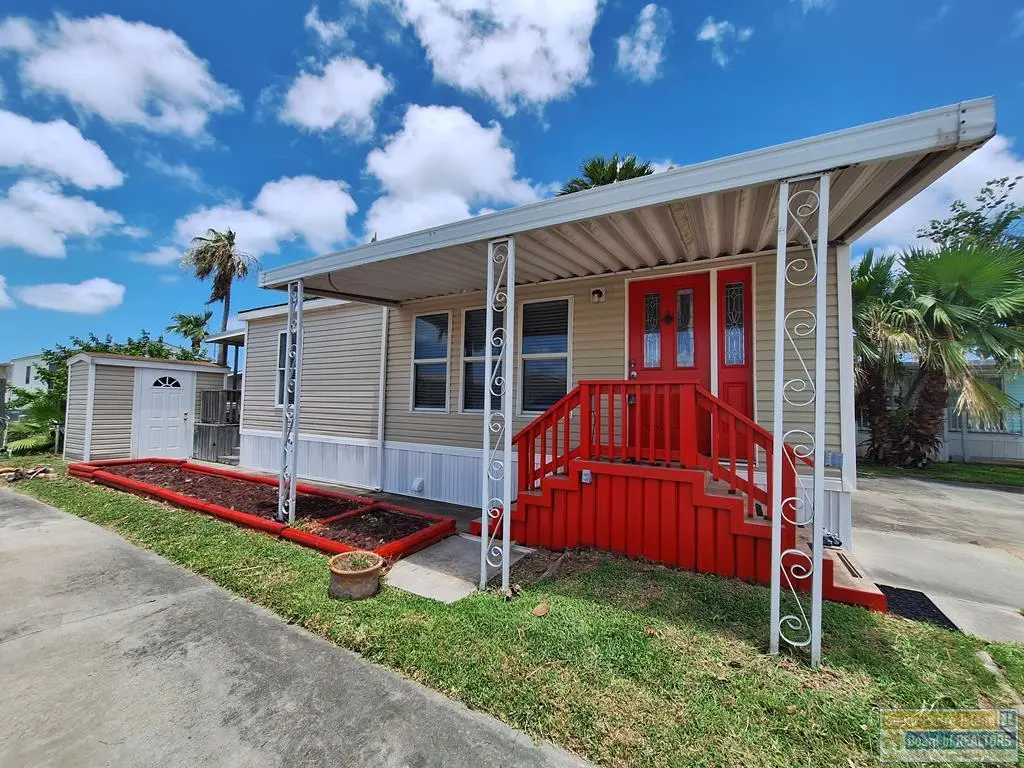
132 E Bonnet Cir · Port Isabel, TX
Flood risk 8/10 · Major
- FEMA flood zone
- X (shaded)
- Chance of flooding over 30 yrs
- 0.98%
- Est. flood insurance / yr
- $507 – $1,088
Fire risk 1/10 · Minimal
- Est. fire insurance / yr
- $1,222 – $2,270
Heat risk 10/10 · Severe
- Hot days now (above 106°F)
- 5 days/yr
- Hot days in 30 yrs
- 19 days/yr
Wind risk 9/10 · Severe
- Chance of severe wind over 30 yrs
- 99.0%
Air-quality risk 2/10 · Minimal
- Unhealthy air days now
- 0 days/yr
- Unhealthy air days in 30 yrs
- 1 days/yr
Risk factors via First Street. Map © Google.
Why this score? — see what drove the F grade
The composite is a weighted blend of 9 inputs, each scored 0–100. Each bar is that input's sub-score; the figure is the points it added to the 100-point composite (weight × sub-score).
- ARV discount +15.0/15.0
- 1% rule +3.9/10.0
- Livability +3.8/5.0
- Cash flow +3.7/30.0
- Rent growth +2.5/5.0
- Condition / age +2.5/5.0
- Schools +1.9/10.0
- DSCR +0.0/10.0
- Appreciation +0.0/10.0
$155,000
🖨 Deal sheet 📄 Offer letter ✓ Due diligence
Listing remarks MLS
Two Bedroom Two Bath unit located in an amenity rich resort with many scheduled activities for making lifetime friends! Furnished and move-in ready including the washer and dryer. Opportunity to use as a vacation home and rent to create income. Only minutes from the beaches of South Padre Island and cross the swing bridge to historic Port Isabel.
Key facts
- Amenity rich resort
- Historic port isabel
- Minutes from beaches
Tags
Neighborhood map
What this means for you Summary
Snapshot
- This is a 2-bed/2.0-bath single-family listed at $155k.
Deal economics
- At list price, monthly cash flow is $-520 ($-6k/yr) — negative.
- To cash-flow at today's rent, offer at most $74k (52.1% below list).
- To meet the 1% rule (rent ≥ 1% of price), the offer needs to be $138k (11.1% below list).
- Recommended offer: $74k (52.1% below list) — sets the bar for cash-flow.
Location & tenants
- Location reads 75/100 on livability (#157 in TX, #4,282 nationally) — a middle-class / working-renter tenant base. Strengths: cost of living A+, housing A+, health & safety A+; Watch: employment D, schools F, crime F.
- Point Isabel ISD (town): math 14% / reading 31% proficiency, ranked #756 of 826 in TX (top 92%) — low school quality limits family demand, transient renter base, plan for 1-2y turnover.
- Market conditions: 254 active listings in the ZIP; 2,326 units permitted in Cameron County in 2024 (503 in 5+ unit buildings).
Forward outlook
- Local home prices are declining (-3.0%/yr); year-one equity from $1k of loan paydown is wiped out by about $5k of value loss. Plan a longer hold.
- Cameron County population projected at +3% by 2050 — modest demand growth; plan on rents tracking national, not racing it.
Negotiation context
- It's been on market 174 days — a 12% lower offer ($136k) is reasonable based on typical stale-listing flexibility.
- 2 sale attempts; this cycle's ask has dropped $30k (16%) from the opening price — seller is motivated, your offer sets the floor, not the list.
Risks & watch-outs
- Watch-outs: flood insurance adds $66/mo; HOA is 26% of rent.
- Climate carrying-cost: severe flood risk; severe wind risk, 99% chance of damaging wind over 30y; extreme-heat days projected 5→19/yr by 2055 (HVAC capex compounding) — expect insurance premiums to compound above CPI over the hold.
Questions for the listing agent
- What do current leases actually rent for vs. the listed asking? Can we see a recent rent roll and the last 12 months of T-12 income?
- It's been on market 174 days. Have you received any prior offers? Is the seller open to a 52% concession, seller financing, or rate buy-down credit?
- What's the actual annual flood-insurance premium (NFIP or private), and is the property in a SFHA with mandatory coverage?
- What does the HOA fee cover, when was the last increase, and are there any pending special assessments or reserve-fund shortfalls?
- Why hasn't it sold? Are there any deal-killer items the seller is aware of (foundation, flood, title, zoning, code violations)?
- Is there a deadline driving the sale (1031 exchange, divorce, estate, relocation)? That informs how much negotiation room exists.
- Schools are F-rated, which usually means shorter tenancies and higher turnover. Who's the typical renter profile here, and what's been the actual vacancy rate?
- Crime grade is F in this area — have there been break-ins, vandalism, or insurance claims at this property in the last 3 years? What carrier currently insures it and at what premium?
- The area grade is low — what's the realistic commute time and amenity access for the typical tenant pool here? Any planned neighborhood developments (good or bad) we should know about?
- This sits on a lake — are riparian / water-frontage rights deeded with the parcel? Any dock permits, shoreline easements, or HOA water-use restrictions?
- What's the documented flood / surge / shoreline-erosion history here (FEMA AND non-FEMA — e.g., storm surge, creek backup, septic-field saturation)?
- Any water-quality or seasonal algae-bloom issues that affect tenant satisfaction or short-term-rental demand?
- What's the average days-on-market for RENTAL listings here right now (not sales)? A rising rental-DOM trend means longer vacancies and softer asking-rent achievability than the comps imply.
- What's the recent tenant-quality profile in this submarket — average credit score on applications, eviction rate, late-payment / NSF rate, and stable-employment percentage? A property-management company in the area should have these aggregated.
- How much new for-sale + rental construction is in the pipeline within 1–3 miles? Heavy new supply typically softens prices + rents 12–24 months out; constrained supply supports both.
Investment metrics
- 1% rule
- 0.89% ✗
- Cap rate
- 2.78%
- Cash-on-cash
- -12.54%
- DSCR
- 0.44
- GRM
- 9.4
CMA / ARV
- ARV (median comp)
- $284,092
- List price
- $155,000
- Delta
- -45.44%
- Verdict
- UNDERPRICED
- Comps
- 12 within 1.0 mi
Show comp detail 4 sales within ~0.75 mi
| Address | Dist | Beds/Ba | Sqft | Sold | Price | $/sf | Match |
|---|---|---|---|---|---|---|---|
| 620 Sand Dollar Dr | 0.34mi | 1/1.0 (-1) | 408 (0%) | 0mo | $295,000 | $723 | 75 |
| 674 E Clam Cir | 0.44mi | 1/1.0 (-1) | 416 (+2%) | 10mo | $206,000 | $495 | 59 |
| 786 E Oyster Dr #786 | 0.55mi | 1/1.0 (-1) | 416 (+2%) | 13mo | $295,000 | $709 | 51 |
| 684 E Clam Cir | 0.47mi | 1/1.0 (-1) | 440 (+8%) | 16mo | $255,000 | $580 | 42 |
Match score weights: distance 35% · size 25% · config 20% · recency 20%. Top-matched comps best support the ARV.
Projected returns pro-forma
-3.0% appreciation · 3.0% rent growth · sell at horizon
- IRR
- -43.2%
- Equity multiple
- -0.33×
- Total profit
- $-57,886
- Equity at exit
- $23,111
- IRR
- -72.0%
- Equity multiple
- -1.11×
- Total profit
- $-91,629
- Equity at exit
- $13,402
Cash invested: $43,400 (down + closing). Projections, not guarantees.
Landlord ↔ Tenant lean methodology
- Overall (STATE)
- 87 Strongly Landlord-Friendly
- State Texas
- 87 Strongly Landlord-Friendly · R+5
- County
- — inherits STATE
- City
- — inherits STATE
ZIP-level market 78578
- Home prices YoY
- -21.7%
- Active inventory
- 254
- Price-to-rent
- 9.4×
Monthly cashflow live
- Estimated rent
- $1,378 medium interval (Pro) →
- Mortgage (P&I)
- −$813
- Tax from tax record
- −$310 /mo · $3,716/yr
- Insurance
- −$65
- Flood insurance flood zone
- −$66 /mo · $798/yr
- HOA
- −$355
- Vacancy / Maint / Mgmt
- −$289
- Net cashflow
- $-520
Break-even live
UW: 25.0% down · 7.5% · 30yr · 1.5% tax · 5.0% vac · 8.0% maint · 8.0% mgmt
Financing live
Cash to close
- Down payment
- $38,750
- Closing costs
- $4,650
- Reserves months
- —
- Total cash needed
- —
Loan-product check · same deal, 3 products live
Conventional
25% down · 7.5% · 30yr
- Down + closing
- —
- Monthly P&I
- —
- Monthly cashflow
- —
- DSCR
- —
- Eligible?
- —
Personal DTI + credit; lowest rate.
DSCR
20% down · 8.5% · 30yr
- Down + closing
- —
- Monthly P&I
- —
- Monthly cashflow
- —
- DSCR
- —
- Eligible?
- —
No personal income docs; deal must DSCR.
Hard money
10% down · 12.0% · 12mo
- Down + closing
- —
- Monthly P&I
- —
- Monthly cashflow
- —
- DSCR
- —
- Eligible?
- —
Short-term bridge; refi at stabilization.
HOA detail
- Monthly dues
- $355 · $4,260/yr
Listing history 20 events
-
2026-06-15days on market $155,000 Active 174 DOM
-
2026-06-14days on market $155,000 Active 172 DOM
-
2026-06-13days on market $155,000 Active 171 DOM
-
2026-06-10days on market $155,000 Active 169 DOM
-
2026-06-09days on market $155,000 Active 168 DOM
-
2026-06-09days on market $155,000 Active 167 DOM
-
2026-06-07days on market $155,000 Active 166 DOM
-
2026-06-03days on market $155,000 Active 162 DOM
-
2026-06-02days on market $155,000 Active 161 DOM
-
2026-06-01days on market $155,000 Active 160 DOM
-
2026-05-31days on market $155,000 Active 159 DOM
-
2026-05-30days on market $155,000 Active 158 DOM
-
2026-04-16price $155,000 349-char remark
Show marketing remark (349 chars)
Two Bedroom Two Bath unit located in an amenity rich resort with many scheduled activities for making lifetime friends! Furnished and move-in ready including the washer and dryer. Opportunity to use as a vacation home and rent to create income. Only minutes from the beaches of South Padre Island and cross the swing bridge to historic Port Isabel.
-
2026-01-30price $163,000 349-char remark
Show marketing remark (349 chars)
Two Bedroom Two Bath unit located in an amenity rich resort with many scheduled activities for making lifetime friends! Furnished and move-in ready including the washer and dryer. Opportunity to use as a vacation home and rent to create income. Only minutes from the beaches of South Padre Island and cross the swing bridge to historic Port Isabel.
-
2026-01-08status Active 349-char remark
Show marketing remark (349 chars)
Two Bedroom Two Bath unit located in an amenity rich resort with many scheduled activities for making lifetime friends! Furnished and move-in ready including the washer and dryer. Opportunity to use as a vacation home and rent to create income. Only minutes from the beaches of South Padre Island and cross the swing bridge to historic Port Isabel.
-
2025-06-06$185,000 Active 349-char remark
Show marketing remark (349 chars)
Two Bedroom Two Bath unit located in an amenity rich resort with many scheduled activities for making lifetime friends! Furnished and move-in ready including the washer and dryer. Opportunity to use as a vacation home and rent to create income. Only minutes from the beaches of South Padre Island and cross the swing bridge to historic Port Isabel.
-
2014-01-06soldstatus 369-char remark
Show marketing remark (369 chars)
NICE PARK MODEL WITH SHED-STYLE ROOF HAS BEEN ADDED ONTO (FULL-LENGTH) AND WOULD ALMOST PASS AS A COTTAGE HOME. TOTAL OF 2 BR/2 BTH WITH DECK AND STORAGE BUILDING IN BACK. NICELY LANDSCAPED, WASHER, DRYER, DISHWASHER, LOCATED ON A QUIET STREET IN GATED LONG ISLAND VILLAGE, WHERE AMENITIES ABOUND AND THE LAGUNA MADRE AND SOUTH PADRE ISLAND ARE JUST A FEW MINUTES AWAY.
-
2006-11-14soldstatus
-
2004-10-21soldstatus
-
1992-11-01soldstatus
ⓘ Source: listings_history table (triggers on properties + properties_extension) + one-shot
backfill from property_details.listing_events for pre-trigger history.
Tax reassessment forecast TX · Resets to sale price
- Current annual tax
- $3,716 · $310/mo
- Projected year-2 tax
- $3,716 · $310/mo
- Expected delta
- $0/yr ($0/mo · 0.0%)
ⓘ Screening estimate from a state-policy table — verify with the county assessor before closing.
Climate risk First Street
- Flood 8/10 Severe FEMA zone X (shaded) · 98% chance over 30 yrs
- Wildfire 1/10 Low
- Heat 10/10 Extreme 5 d/yr ≥106°F today · 19 d/yr by 30 yrs out
- Wind 9/10 Extreme 99% chance of damaging wind over 30 yrs
- Air quality 2/10 Low 0 unhealthy d/yr today · 1 by 30 yrs out
Nearby sold comps map
Loading sold comps map…
Walkable amenities ~0.75 mi
Loading nearby amenities…
Taxation est. · year 1
- Rental income
- $16,534
- − Mortgage interest
- −$8,682
- − Property taxes
- −$3,716
- − Insurance
- −$1,572
- − Repairs & maintenance
- −$1,323
- − Management
- −$1,323
- − HOA
- −$4,260
- − Depreciation
- −$4,509
- Taxable loss
- −$8,851
- Est. tax savings @ 24.0%
- +$2,124
- After-tax cash flow
- $-4,116/yr
For passive investors: Depreciation is non-cash, so a rental often shows a tax loss while cash-flowing — sheltering income. Rental losses are passive: they offset passive income freely, and up to $25,000/yr can offset ordinary (W-2) income if you actively participate and your MAGI is under $100k (phasing out to $0 by $150k); unused losses carry forward. On sale, claimed depreciation is recaptured at up to 25%, and gains may owe capital-gains tax (a 1031 exchange can defer both). Figures are a year-1 estimate at your 24.0% rate — not tax advice; consult a CPA.
Schools (NCES district)
- District
- Point Isabel ISD
- NCES district ID
- 4835250
- Math proficiency
- 14% ▼ -24.00%
- Reading proficiency
- 31% ▼ -10.00%
- Median HH income
- $38,115
- Composite
- 18.78/100
- National rank
- #8871
- State rank
- #756 of 826 in TX
Livability — Port Isabel
- Score
- 75/100
- State rank
- #157
- US rank
- #4282
Category grades
Schools grade is shown separately in the Schools card above.
Census & demographics
- Population (ZIP)
- 10,231
Population outlook (Cameron County) Hauer SSP2
- Today (2025)
- 441,603 people
- By 2030
- 448,113 · +1.5%
- By 2040
- 456,385 · +3.3%
- By 2050
- 456,294 · +3.3%
- By 2075
- 423,851 · -4.0%
- By 2100
- 342,787 · -22.4%
Race, ethnicity, and origin ACS 2023
- Neighborhood character
- Majority Hispanic (63%)
- Race & ethnicity
- Hispanic / Latino 63% White 35% Two or more races 19%
- Hispanic origin (detail)
- Mexican 59%
- Common ancestry
- Lithuanian 2% Romanian 1% Slovak 1%
- Foreign-born
- 18% · Canada
- Languages at home
- 57% English-only · Spanish 42%
Political lean MEDSL · Cameron
- 2024 margin
- Lean R (+5.8) · D 46.7% · R 52.5%
- 2008→2024 swing
- -34.6pp toward R · 2008: 28.8pp · 2024: -5.8pp
- All cycles
- 2024: R+5.8 2020: D+13.2 2016: D+32.5 2012: D+32.4 2008: D+28.8
Not yet ingested
- Civics
- —
Market trends
- HPI YoY
- ▼ -61.69%
- Current HPI
- 222.9501
- Rent YoY
- —
- Metro
- —
- State GDP YoY
- ▲ 3.95%
- F500 in state
- 110
Industry mix (Fortune 500 HQ in TX)
| Industry | F500 HQs | Revenue |
|---|---|---|
| Energy | 16 | $1,198B |
|
||
| Technology | 5 | $198B |
|
||
| Engineering / Construction | 4 | $72B |
|
||
| Energy Services | 3 | $60B |
|
||
| Utilities | 3 | $41B |
|
||
| Healthcare | 2 | $330B |
|
||
Price history
-16.2% since first listed8 events — show timeline
- 2026-04-16 Price Changed $155,000 SPIBOR
- 2026-01-30 Price Changed $163,000 SPIBOR
- 2026-01-08 Relisted — SPIBOR
- 2025-06-06 Listed $185,000 SPIBOR
- 2014-01-06 Sold (MLS) — SPIBOR
- 2006-11-14 Sold (Public Records) — Public Records
- 2004-10-21 Sold (Public Records) — Public Records
- 1992-11-01 Sold (Public Records) — Public Records
Property tax history
+12.1%/yrLatest (2025): $3,716 · +1.4% YoY. Source: county tax records.
Cash-flow waterfall
monthlySold comps — $/sqft
last 12 mo · ≤1 miLoading sold comps…