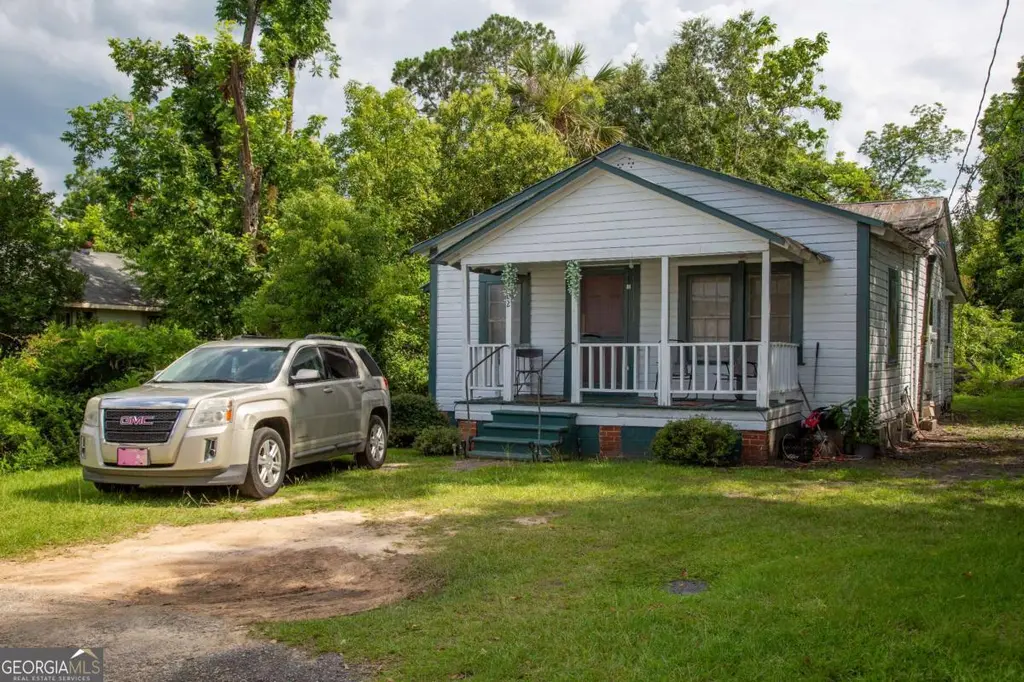
102 Crosby St · Baxley, GA
Flood risk 1/10 · Minimal
- FEMA flood zone
- X (unshaded)
- Chance of flooding over 30 yrs
- 0.0%
- Est. flood insurance / yr
- $507 – $1,088
Fire risk 6/10 · Moderate
- Est. fire insurance / yr
- $963 – $1,789
Heat risk 8/10 · Major
- Hot days now (above 108°F)
- 7 days/yr
- Hot days in 30 yrs
- 18 days/yr
Wind risk 8/10 · Major
- Chance of severe wind over 30 yrs
- 97.0%
Air-quality risk 2/10 · Minimal
- Unhealthy air days now
- 1 days/yr
- Unhealthy air days in 30 yrs
- 2 days/yr
Risk factors via First Street. Map © Google.
Why this score? — see what drove the B- grade
The composite is a weighted blend of 9 inputs, each scored 0–100. Each bar is that input's sub-score; the figure is the points it added to the 100-point composite (weight × sub-score).
- Cash flow +30.0/30.0
- DSCR +10.0/10.0
- 1% rule +8.7/10.0
- ARV discount +7.5/15.0
- Livability +3.0/5.0
- Schools +2.7/10.0
- Rent growth +2.5/5.0
- Condition / age +2.5/5.0
- Appreciation +0.0/10.0
$71,000
🖨 Deal sheet (PDF) 📄 Offer letter ✓ Due diligence
Listing remarks MLS
This conveniently located 2-bedroom, 1-bathroom home offers a great opportunity for investors. Currently used as a rental property, it would make a great addition to an investment portfolio. Property is being sold as-is.
Key facts
- 9,583 sq ft lot
- Built 1950
- Listed 89 days
Neighborhood map
What this means for you Summary
Snapshot
- This is a ?-bed/1.0-bath single-family listed at $71k.
Deal economics
- At list price, monthly cash flow is $331 ($4k/yr) — positive.
- The deal already cash-flows at list — no discount required.
- Meets the 1% rule at list price ($975 rent vs $71k).
- Recommended offer: $67k (6.0% below list) — sets the bar for market timing.
- Cap rate 11.9% vs local median 3.0% in Baxley — top-decile yield for the area; either an underpriced asset or a hidden risk that comps aren't pricing in. Stress-test before assuming the spread holds.
Location & tenants
- Location reads 59/100 on livability (#416 in GA) — a working-class tenant base; expect higher turnover. Strengths: cost of living A+, housing A+; Watch: crime C-, health & safety C-, amenities F.
- Appling County (town): math 35% / reading 30% proficiency, ranked #84 of 174 in GA (top 48%) — families likely to look elsewhere, expect single-tenant / working-renter base with shorter leases; 63% free/reduced lunch — lower-income household profile, screen leases tightly.
- Zoned schools: Appling County Elementary School (math 41% / reading 28%, grade F, #531 of 1,228 statewide, top 45%, 1,189 students, 80% FRL); Appling County Middle School (math 32% / reading 33%, grade F, #221 of 470 statewide, top 48%, 713 students, 80% FRL); Appling County High School (math 26% / reading 26%, grade F, #175 of 424 statewide, top 42%, 1,060 students, 80% FRL) — zoned schools average 80% FRL vs 63% district-wide (17 pts higher); higher-poverty schools than district average — tighter screening recommended.
- Market conditions: 91 active listings in the ZIP; 1 comparable units currently listed for rent nearby; 4 units permitted in Appling County in 2024 (0 in 5+ unit buildings).
Forward outlook
- Local home prices are declining (-3.0%/yr); year-one equity from $491 of loan paydown is wiped out by about $2k of value loss. Plan a longer hold.
- Appling County population projected to shrink 8% by 2050 — rents likely to lag national; underwrite the cash flow, not the appreciation.
- At projected returns (-3.0% appreciation + 3.0% rent growth), your $20k cash investment doubles in ~7 years — after that, you're playing with house money.
Negotiation context
- It's been on market 89 days — a 6% lower offer ($67k) is reasonable based on typical stale-listing flexibility.
Risks & watch-outs
- Watch-outs: built in 1950 — expect roof / HVAC / electrical / plumbing capex.
- Climate carrying-cost: severe wind risk, 97% chance of damaging wind over 30y; major wildfire risk; extreme-heat days projected 7→18/yr by 2055 (HVAC capex compounding) — expect insurance premiums to compound above CPI over the hold.
Questions for the listing agent
- It's been on market 89 days. Have you received any prior offers? Is the seller open to a 6% concession, seller financing, or rate buy-down credit?
- Built in 1950 — when were the roof, HVAC, electrical panel, plumbing, and water heater last replaced?
- Why hasn't it sold? Are there any deal-killer items the seller is aware of (foundation, flood, title, zoning, code violations)?
- Is there a deadline driving the sale (1031 exchange, divorce, estate, relocation)? That informs how much negotiation room exists.
- Schools are D-rated, which usually means shorter tenancies and higher turnover. Who's the typical renter profile here, and what's been the actual vacancy rate?
- What's the average days-on-market for RENTAL listings here right now (not sales)? A rising rental-DOM trend means longer vacancies and softer asking-rent achievability than the comps imply.
- What's the recent tenant-quality profile in this submarket — average credit score on applications, eviction rate, late-payment / NSF rate, and stable-employment percentage? A property-management company in the area should have these aggregated.
- How much new for-sale + rental construction is in the pipeline within 1–3 miles? Heavy new supply typically softens prices + rents 12–24 months out; constrained supply supports both.
Investment metrics
- 1% rule
- 1.37% ✓
- Cap rate
- 11.89%
- Cash-on-cash
- 20.00%
- DSCR
- 1.89
- GRM
- 6.1
CMA / ARV
- ARV (median comp)
- $165,677
- List price
- $71,000
- Delta
- -57.15%
- Verdict
- UNDERPRICED
- Comps
- 1 within 2.0 mi
Show comp detail 3 sales within ~0.75 mi
| Address | Dist | Beds/Ba | Sqft | Sold | Price | $/sf | Match |
|---|---|---|---|---|---|---|---|
| 303 W Parker St | 0.39mi | 2/1.0 | 897 (+6%) | 2mo | $71,500 | $80 | 70 |
| 107 107 Peachtree St | 0.68mi | 2/1.0 | 908 (+7%) | 10mo | $120,000 | $132 | 48 |
| 123 Brobston St | 0.63mi | 2/1.0 | 936 (+10%) | 17mo | $69,900 | $75 | 40 |
Match score weights: distance 35% · size 25% · config 20% · recency 20%. Top-matched comps best support the ARV.
Projected returns pro-forma
-3.0% appreciation · 3.0% rent growth · sell at horizon
- IRR
- 12.1%
- Equity multiple
- 1.48×
- Total profit
- $9,584
- Equity at exit
- $10,586
- IRR
- 21.1%
- Equity multiple
- 2.78×
- Total profit
- $35,454
- Equity at exit
- $6,139
Cash invested: $19,880 (down + closing). Projections, not guarantees.
Landlord ↔ Tenant lean methodology
- Overall (STATE)
- 90 Strongly Landlord-Friendly
- State Georgia
- 90 Strongly Landlord-Friendly · R+3
- County
- — inherits STATE
- City
- — inherits STATE
ZIP-level market 31513
- Home prices YoY
- -11.5%
- Active inventory
- 91
- Price-to-rent
- 6.1×
Monthly cashflow live
- Estimated rent
- $975 medium interval (Pro) →
- Mortgage (P&I)
- −$372
- Tax from tax record
- −$37 /mo · $443/yr
- Insurance
- −$30
- HOA
- −$0
- Vacancy / Maint / Mgmt
- −$205
- Net cashflow
- $331
Break-even live
Sensitivity live
| Price | -10% $372 | -5% $351 | +0% $331 | +5% $311 | +10% $291 |
|---|---|---|---|---|---|
| Rent | -10% $254 | -5% $293 | +0% $331 | +5% $370 | +10% $408 |
| Rate | -1.0pp $367 | -0.5pp $349 | base $331 | +0.5pp $313 | +1.0pp $294 |
UW: 25.0% down · 7.5% · 30yr · 1.5% tax · 5.0% vac · 8.0% maint · 8.0% mgmt
Financing live
Cash to close
- Down payment
- $17,750
- Closing costs
- $2,130
- Reserves months
- —
- Total cash needed
- —
Loan-product check · same deal, 3 products live
Conventional
25% down · 7.5% · 30yr
- Down + closing
- —
- Monthly P&I
- —
- Monthly cashflow
- —
- DSCR
- —
- Eligible?
- —
Personal DTI + credit; lowest rate.
DSCR
20% down · 8.5% · 30yr
- Down + closing
- —
- Monthly P&I
- —
- Monthly cashflow
- —
- DSCR
- —
- Eligible?
- —
No personal income docs; deal must DSCR.
Hard money
10% down · 12.0% · 12mo
- Down + closing
- —
- Monthly P&I
- —
- Monthly cashflow
- —
- DSCR
- —
- Eligible?
- —
Short-term bridge; refi at stabilization.
Rent comps 1 comps
| Address | Beds | Baths | Sqft | Rent | $/sqft | DOM | Units | Dist |
|---|---|---|---|---|---|---|---|---|
| 593 Beach Rd Unit 1 Baxley, GA | 2.0 | 2.0 | 1050 | $975 | $0.93 | 45d | 1 | 0.94mi |
Listing history 18 events
-
2026-06-21days on market $71,000 Active 89 DOM
-
2026-06-21days on market $71,000 Active 88 DOM
-
2026-06-18days on market $71,000 Active 86 DOM
-
2026-06-17days on market $71,000 Active 85 DOM
-
2026-06-16days on market $71,000 Active 84 DOM
-
2026-06-15days on market $71,000 Active 83 DOM
-
2026-06-13days on market $71,000 Active 81 DOM
-
2026-06-12days on market $71,000 Active 80 DOM
-
2026-06-09days on market $71,000 Active 77 DOM
-
2026-06-08days on market $71,000 Active 76 DOM
-
2026-06-07days on market $71,000 Active 75 DOM
-
2026-06-07days on market $71,000 Active 74 DOM
-
2026-06-04days on market $71,000 Active 71 DOM
-
2026-06-02days on market $71,000 Active 70 DOM
-
2026-06-01days on market $71,000 Active 69 DOM
-
2026-05-31days on market $71,000 Active 68 DOM
-
2026-05-31days on market $71,000 Active 67 DOM
-
2026-03-24$71,000 New 220-char remark
Show marketing remark (220 chars)
This conveniently located 2-bedroom, 1-bathroom home offers a great opportunity for investors. Currently used as a rental property, it would make a great addition to an investment portfolio. Property is being sold as-is.
ⓘ Source: listings_history table (triggers on properties + properties_extension) + one-shot
backfill from property_details.listing_events for pre-trigger history.
Tax reassessment forecast GA · Resets to sale price
- Current annual tax
- $443 · $37/mo
- Projected year-2 tax
- $653 · $54/mo
- Expected delta
- +$210/yr (+$17/mo · 47.3%)
ⓘ Screening estimate from a state-policy table — verify with the county assessor before closing.
Climate risk First Street
- Flood 1/10 Low FEMA zone X (unshaded) · 0% chance over 30 yrs
- Wildfire 6/10 Major
- Heat 8/10 Severe 7 d/yr ≥108°F today · 18 d/yr by 30 yrs out
- Wind 8/10 Severe 97% chance of damaging wind over 30 yrs
- Air quality 2/10 Low 1 unhealthy d/yr today · 2 by 30 yrs out
Nearby sold comps map
Loading sold comps map…
Walkable amenities ~0.75 mi
Loading nearby amenities…
Taxation est. · year 1
- Rental income
- $11,700
- − Mortgage interest
- −$3,977
- − Property taxes
- −$443
- − Insurance
- −$355
- − Repairs & maintenance
- −$936
- − Management
- −$936
- − Depreciation
- −$2,065
- Taxable income
- $2,987
- Est. tax owed @ 24.0%
- −$717
- After-tax cash flow
- $3,260/yr
For passive investors: Depreciation is non-cash, so a rental often shows a tax loss while cash-flowing — sheltering income. Rental losses are passive: they offset passive income freely, and up to $25,000/yr can offset ordinary (W-2) income if you actively participate and your MAGI is under $100k (phasing out to $0 by $150k); unused losses carry forward. On sale, claimed depreciation is recaptured at up to 25%, and gains may owe capital-gains tax (a 1031 exchange can defer both). Figures are a year-1 estimate at your 24.0% rate — not tax advice; consult a CPA.
Schools (NCES district)
- District
- Appling County
- NCES district ID
- 1300060
- Math proficiency
- 35% ▼ -7.00%
- Reading proficiency
- 30% ▼ -9.00%
- Median HH income
- $36,536
- Composite
- 27.02/100
- National rank
- #7056
- State rank
- #84 of 174 in GA
Livability — Baxley
- Score
- 59/100
- State rank
- #416
- US rank
- #20537
Category grades
Schools grade is shown separately in the Schools card above.
Census & demographics
- Census place
- Baxley, GA
- City population
- 15,941
- Population (ZIP)
- 15,941
Population outlook (Appling County) Hauer SSP2
- Today (2025)
- 18,311 people
- By 2030
- 18,130 · -1.0%
- By 2040
- 17,650 · -3.6%
- By 2050
- 16,788 · -8.3%
- By 2075
- 14,406 · -21.3%
- By 2100
- 10,443 · -43.0%
Race, ethnicity, and origin ACS 2023
- Neighborhood character
- Predominantly White (67%)
- Race & ethnicity
- White 67% Black 19% Hispanic / Latino 10% Two or more races 6%
- Hispanic origin (detail)
- Mexican 9%
- Foreign-born
- 6% · Canada, China
- Languages at home
- 89% English-only · Spanish 9% German/W. Germanic 1%
Political lean MEDSL · Appling
- 2024 margin
- Solid R (+62.4) · D 18.7% · R 81.1%
- 2008→2024 swing
- -16.1pp toward R · 2008: -46.3pp · 2024: -62.4pp
- All cycles
- 2024: R+62.4 2020: R+57.0 2016: R+57.9 2012: R+49.1 2008: R+46.3
Not yet ingested
- Civics
- —
Market trends
- HPI YoY
- ▼ -25.21%
- Current HPI
- 194.6928
- Rent YoY
- —
- Metro
- —
- State GDP YoY
- ▲ 2.66%
- F500 in state
- 28
Industry mix (Fortune 500 HQ in GA)
| Industry | F500 HQs | Revenue |
|---|---|---|
| Paper / Packaging | 2 | $29B |
|
||
| Retail | 1 | $160B |
|
||
| Transportation / Logistics | 1 | $91B |
|
||
| Airlines | 1 | $62B |
|
||
| Consumer Goods | 1 | $47B |
|
||
| Utilities | 1 | $25B |
|
||
Price history
1 event — show timeline
- 2026-03-24 Listed $71,000 GAMLS
Property tax history
+11.3%/yrLatest (2025): $443 · +239.2% YoY. Source: county tax records.
Cash-flow waterfall
monthlySold comps — $/sqft
last 12 mo · ≤1 miLoading sold comps…