2530 S Barbara Ave · Yuma, AZ
Flood risk 1/10 · Minimal
- FEMA flood zone
- X (shaded)
- Chance of flooding over 30 yrs
- 0.0%
- Est. flood insurance / yr
- $507 – $1,088
Fire risk 3/10 · Minor
- Est. fire insurance / yr
- $610 – $1,132
Heat risk 9/10 · Severe
- Hot days now (above 113°F)
- 7 days/yr
- Hot days in 30 yrs
- 20 days/yr
Wind risk 1/10 · Minimal
- Chance of severe wind over 30 yrs
- —
Air-quality risk 2/10 · Minimal
- Unhealthy air days now
- 2 days/yr
- Unhealthy air days in 30 yrs
- 2 days/yr
Risk factors via First Street. Map © Google.
Why this score? — see what drove the B- grade
The composite is a weighted blend of 9 inputs, each scored 0–100. Each bar is that input's sub-score; the figure is the points it added to the 100-point composite (weight × sub-score).
- Cash flow +30.0/30.0
- 1% rule +10.0/10.0
- DSCR +10.0/10.0
- ARV discount +7.5/15.0
- Livability +3.6/5.0
- Condition / age +2.5/5.0
- Rent growth +2.4/5.0
- Schools +1.3/10.0
- Appreciation +0.0/10.0
$100,000
🖨 Deal sheet 📄 Offer letter ✓ Due diligence
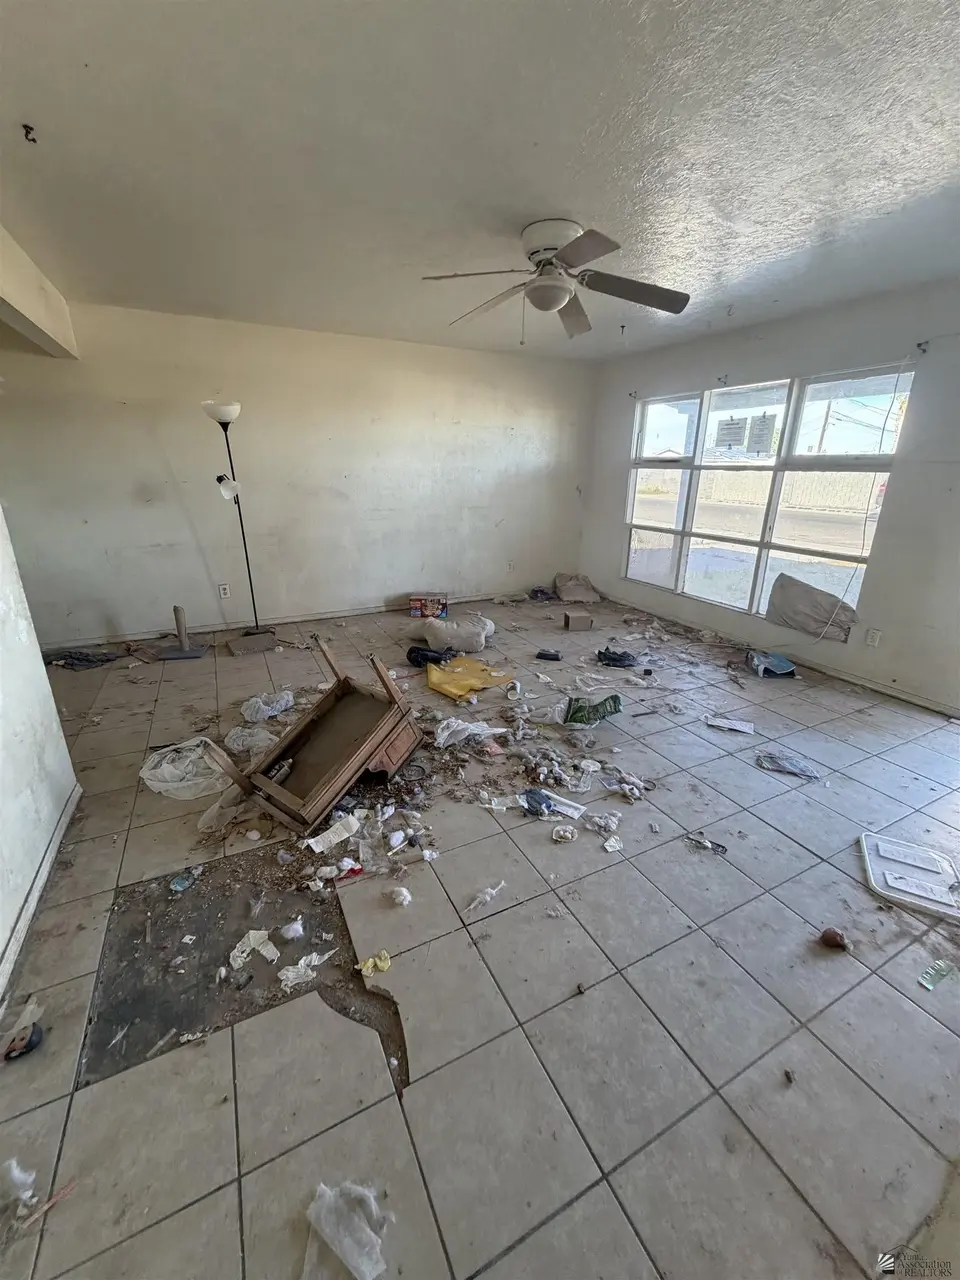
Listing remarks MLS
READY FOR IMMEDIATE OCCUPANCY - 3 BEDROOM, 1 BATH WITH TILE THROUGHOUT! HUGE BACKYARD FOR YOUR OWN CUSTOM DESIGN.
Key facts
- 6,076 sq ft lot
- Parking
- Built 1956
Property features AI
Exterior
- Parking: 1 parking space total; 1 covered space; 1-car carport
- Home design: Single-family residence; Residential property
- Exterior features: Lot in Desert View subdivision; Lot approximately 6,076 square feet
Interior
- Kitchen: Gas range
- Flooring: Tile
- Bathrooms: 1 full bathroom
- Interior features: Gas range; Tile flooring; No fireplace
Neighborhood map
What this means for you Summary
Snapshot
- This is a 3-bed/1.0-bath single-family listed at $100k.
Deal economics
- At list price, monthly cash flow is $656 ($8k/yr) — positive.
- The deal already cash-flows at list — no discount required.
- Meets the 1% rule at list price ($2k rent vs $100k).
- Cap rate 14.2% vs local median 3.9% in Yuma — top-decile yield for the area; either an underpriced asset or a hidden risk that comps aren't pricing in. Stress-test before assuming the spread holds.
Location & tenants
- Location reads 71/100 on livability (#30 in AZ) — a middle-class / working-renter tenant base. Strengths: cost of living A+, housing A+, health & safety A+; Watch: schools C-, crime C-, employment D.
- Yuma Union High School District (4507) (urban): math 14% / reading 16% proficiency, ranked #212 of 249 in AZ (top 85%) — low school quality limits family demand, transient renter base, plan for 1-2y turnover.
- Market conditions: Rents soft (-0.4%/yr); 472 active listings in the ZIP; 9 comparable units currently listed for rent nearby; rentals leasing fast (median 13d on market — plan ~1-2 weeks tenant-placement turnaround); 1,399 units permitted in Yuma County in 2024 (180 in 5+ unit buildings).
Forward outlook
- Local home prices are declining (-3.0%/yr); year-one equity from $691 of loan paydown is wiped out by about $3k of value loss. Plan a longer hold.
- Yuma County population projected at +4% by 2050 — modest demand growth; plan on rents tracking national, not racing it.
- At projected returns (-3.0% appreciation + 0.0% rent growth), your $28k cash investment doubles in ~5 years — after that, you're playing with house money.
Negotiation context
- Only 1 days on market — expect competitive offers; lowballing is unlikely to land.
- 3 sale attempts since 9y ago with the ask held roughly flat each time — persistent listings suggest the price (not the market) is what's stuck; bring a comps-based counter.
Risks & watch-outs
- Watch-outs: built in 1956 — expect roof / HVAC / electrical / plumbing capex.
- Climate carrying-cost: extreme-heat days projected 7→20/yr by 2055 (HVAC capex compounding) — expect insurance premiums to compound above CPI over the hold.
Questions for the listing agent
- Built in 1956 — when were the roof, HVAC, electrical panel, plumbing, and water heater last replaced?
- Is there a deadline driving the sale (1031 exchange, divorce, estate, relocation)? That informs how much negotiation room exists.
- What's the average days-on-market for RENTAL listings here right now (not sales)? A rising rental-DOM trend means longer vacancies and softer asking-rent achievability than the comps imply.
- What's the recent tenant-quality profile in this submarket — average credit score on applications, eviction rate, late-payment / NSF rate, and stable-employment percentage? A property-management company in the area should have these aggregated.
- How much new for-sale + rental construction is in the pipeline within 1–3 miles? Heavy new supply typically softens prices + rents 12–24 months out; constrained supply supports both.
Investment metrics
- 1% rule
- 1.67% ✓
- Cap rate
- 14.16%
- Cash-on-cash
- 28.11%
- DSCR
- 2.25
- GRM
- 5.0
CMA / ARV
- ARV (on-the-fly)
- $219,555
- Comps found
- 12
Show comp detail 12 sales within ~0.75 mi
| Address | Dist | Beds/Ba | Sqft | Sold | Price | $/sf | Match |
|---|---|---|---|---|---|---|---|
| 2463 S Olivia Ave | 0.09mi | 3/1.0 | 1,024 (-4%) | 2mo | $225,000 | $220 | 87 |
| 2488 S Barbara Ave | 0.06mi | 3/1.0 | 1,000 (-7%) | 4mo | $225,000 | $225 | 83 |
| 2271 S Olivia Ave | 0.33mi | 3/1.0 | 1,075 (+0%) | 2mo | $265,000 | $247 | 83 |
| 1310 E 25 Pl | 0.20mi | 3/1.0 | 1,052 (-2%) | 7mo | $210,000 | $200 | 82 |
| 2098 E La Mesa St | 0.24mi | 3/1.5 | 1,020 (-5%) | 4mo | $209,000 | $205 | 76 |
| 1465 E 23 St | 0.30mi | 3/2.0 | 1,188 (+11%) | 1mo | $265,000 | $223 | 63 |
| 919 E 25 Pl | 0.39mi | 3/2.0 | 1,203 (+12%) | 4mo | $235,000 | $195 | 54 |
| 2901 S Palo Verde Ln #14 | 0.46mi | 2/2.5 (-1) | 1,212 (+13%) | 4mo | $120,000 | $99 | 42 |
| 2901 S Palo Verde Ln #51 | 0.46mi | 2/2.5 (-1) | 1,212 (+13%) | 5mo | $125,000 | $103 | 42 |
| 2901 S Palo Verde Ln #48 | 0.46mi | 2/2.5 (-1) | 1,212 (+13%) | 6mo | $135,000 | $111 | 40 |
| 2901 S Palo Verde Ln #46 | 0.46mi | 2/2.5 (-1) | 1,212 (+13%) | 6mo | $135,000 | $111 | 40 |
| 563 E 25 St | 0.69mi | 2/2.0 (-1) | 1,230 (+15%) | 3mo | $252,000 | $205 | 32 |
Match score weights: distance 35% · size 25% · config 20% · recency 20%. Top-matched comps best support the ARV.
Projected returns pro-forma
-3.0% appreciation · 0.0% rent growth · sell at horizon
- IRR
- 18.9%
- Equity multiple
- 1.74×
- Total profit
- $20,677
- Equity at exit
- $14,910
- IRR
- 25.1%
- Equity multiple
- 2.89×
- Total profit
- $52,906
- Equity at exit
- $8,646
Cash invested: $28,000 (down + closing). Projections, not guarantees.
Landlord ↔ Tenant lean methodology
- Overall (STATE)
- 87 Strongly Landlord-Friendly
- State Arizona
- 87 Strongly Landlord-Friendly · R+3
- County
- — inherits STATE
- City
- — inherits STATE
ZIP-level market 85365
- Home prices YoY
- -23.6%
- Rents YoY
- -0.4%
- Active inventory
- 472
- Price-to-rent
- 5.0×
Monthly cashflow live
- Estimated rent
- $1,670 high interval (Pro) →
- Mortgage (P&I)
- −$524
- Tax from tax record
- −$98 /mo · $1,172/yr
- Insurance
- −$42
- HOA
- −$0
- Vacancy / Maint / Mgmt
- −$351
- Net cashflow
- $656
Break-even live
UW: 25.0% down · 7.5% · 30yr · 1.5% tax · 5.0% vac · 8.0% maint · 8.0% mgmt
Financing live
Cash to close
- Down payment
- $25,000
- Closing costs
- $3,000
- Reserves months
- —
- Total cash needed
- —
Loan-product check · same deal, 3 products live
Conventional
25% down · 7.5% · 30yr
- Down + closing
- —
- Monthly P&I
- —
- Monthly cashflow
- —
- DSCR
- —
- Eligible?
- —
Personal DTI + credit; lowest rate.
DSCR
20% down · 8.5% · 30yr
- Down + closing
- —
- Monthly P&I
- —
- Monthly cashflow
- —
- DSCR
- —
- Eligible?
- —
No personal income docs; deal must DSCR.
Hard money
10% down · 12.0% · 12mo
- Down + closing
- —
- Monthly P&I
- —
- Monthly cashflow
- —
- DSCR
- —
- Eligible?
- —
Short-term bridge; refi at stabilization.
Rent comps 9 comps
| Address | Beds | Baths | Sqft | Rent | $/sqft | DOM | Units | Dist |
|---|---|---|---|---|---|---|---|---|
| 2533 S Olivia Ave Yuma, AZ | 3.0 | 2.0 | 1287 | $1,495 | $1.16 | 13d | 1 | 0.03mi |
| 2400 S Engler Ave Yuma, AZ | 3.0 | 2.0 | 1366 | $1,500 | $1.10 | 13d | 1 | 0.53mi |
| 2045 S Walnut Ave Yuma, AZ | 3.0 | 1.0 | 940 | $1,480 | $1.57 | 21d | 1 | 0.99mi |
| 2668 S Madison Ave Yuma, AZ | 4.0 | 2.0 | 1356 | $1,600 | $1.18 | 13d | 1 | 1.01mi |
| 517 E Country Club Dr Unit 517D Yuma, AZ | 2.0 | 1.0 | 800 | $1,200 | $1.50 | 13d | 1 | 1.02mi |
| 515 E Country Club Dr Unit 515B Yuma, AZ | 2.0 | 1.0 | 800 | $1,200 | $1.50 | 13d | 1 | 1.03mi |
| 143 W 27th Pl Yuma, AZ | 3.0 | 2.0 | 1277 | $1,500 | $1.17 | 21d | 1 | 1.09mi |
| 2714 S Virginia Dr Yuma, AZ | 2.0 | 1.0 | 750 | $925 | $1.23 | 13d | 2 | 1.19mi |
| 225 W Catalina Dr Yuma, AZ | 1.0–2.0 | 1.0–2.0 | 777 | $1,363 | $1.75 | 13d | 7 | 1.28mi |
Listing history 3 events
-
2026-06-09status $100,000 Pending 1 DOM
-
2026-06-09remarks 391-char remark
-
2026-06-09$100,000 Active 1 DOM
ⓘ Source: listings_history table (triggers on properties + properties_extension) + one-shot
backfill from property_details.listing_events for pre-trigger history.
Tax reassessment forecast AZ · Resets to sale price
- Current annual tax
- $1,172 · $98/mo
- Projected year-2 tax
- $1,172 · $98/mo
- Expected delta
- $0/yr ($0/mo · 0.0%)
ⓘ Screening estimate from a state-policy table — verify with the county assessor before closing.
Climate risk First Street
- Flood 1/10 Low FEMA zone X (shaded) · 0% chance over 30 yrs
- Wildfire 3/10 Moderate
- Heat 9/10 Extreme 7 d/yr ≥113°F today · 20 d/yr by 30 yrs out
- Wind 1/10 Low
- Air quality 2/10 Low 2 unhealthy d/yr today · 2 by 30 yrs out
Nearby sold comps map
Loading sold comps map…
Walkable amenities ~0.75 mi
Loading nearby amenities…
Taxation est. · year 1
- Rental income
- $20,043
- − Mortgage interest
- −$5,602
- − Property taxes
- −$1,172
- − Insurance
- −$500
- − Repairs & maintenance
- −$1,603
- − Management
- −$1,603
- − Depreciation
- −$2,909
- Taxable income
- $6,654
- Est. tax owed @ 24.0%
- −$1,597
- After-tax cash flow
- $6,273/yr
For passive investors: Depreciation is non-cash, so a rental often shows a tax loss while cash-flowing — sheltering income. Rental losses are passive: they offset passive income freely, and up to $25,000/yr can offset ordinary (W-2) income if you actively participate and your MAGI is under $100k (phasing out to $0 by $150k); unused losses carry forward. On sale, claimed depreciation is recaptured at up to 25%, and gains may owe capital-gains tax (a 1031 exchange can defer both). Figures are a year-1 estimate at your 24.0% rate — not tax advice; consult a CPA.
Schools (NCES district)
- District
- Yuma Union High School District (4507)
- NCES district ID
- 0409630
- Math proficiency
- 14% ▼ -12.00%
- Reading proficiency
- 16% ▼ -10.00%
- Median HH income
- $40,512
- Composite
- 12.86/100
- National rank
- #9592
- State rank
- #212 of 249 in AZ
Livability — Yuma
- Score
- 71/100
- State rank
- #30
- US rank
- #6635
Category grades
Schools grade is shown separately in the Schools card above.
Census & demographics
- Census place
- Yuma, AZ
- County
- Yuma County · 149,809 people
- City population
- 149,809
- Metro
- Yuma, AZ
- Population (ZIP)
- 54,775
- Household income
- $70,331
- Rent vs Own
- Severe rent burden
- 766.0
Population outlook (Yuma County) Hauer SSP2
- Today (2025)
- 211,633 people
- By 2030
- 214,114 · +1.2%
- By 2040
- 217,856 · +2.9%
- By 2050
- 220,276 · +4.1%
- By 2075
- 222,359 · +5.1%
- By 2100
- 198,880 · -6.0%
Race, ethnicity, and origin ACS 2023
- Neighborhood character
- Diverse neighborhood (Simpson 0.58)
- Race & ethnicity
- Hispanic / Latino 47% White 44% Two or more races 23% Black 2% Asian 1% Native American 1%
- Hispanic origin (detail)
- Mexican 43%
- Common ancestry
- Lithuanian 2% Italian 1% Romanian 1%
- Foreign-born
- 17% · Canada
- Languages at home
- 62% English-only · Spanish 36% Tagalog/Filipino 1% Other Asian/Pacific 1%
Political lean MEDSL · Yuma
- 2024 margin
- Strong R (+20.4) · D 39.3% · R 59.8%
- 2008→2024 swing
- -6.6pp toward R · 2008: -13.8pp · 2024: -20.4pp
- All cycles
- 2024: R+20.4 2020: R+6.2 2016: R+5.5 2012: R+16.1 2008: R+13.8
Not yet ingested
- Civics
- —
Market trends
- HPI YoY
- ▼ -75.03%
- Current HPI
- 242.8651
- Rent YoY
- ▼ -0.38%
- Metro
- Yuma, AZ
- State GDP YoY
- ▲ 4.54%
- F500 in state
- 20
Industry mix (Fortune 500 HQ in AZ)
| Industry | F500 HQs | Revenue |
|---|---|---|
| Technology | 2 | $13B |
|
||
| Mining / Metals | 1 | $23B |
|
||
| Environmental Services | 1 | $16B |
|
||
| Metals / Steel | 1 | $14B |
|
||
| Technology Distribution | 1 | $9B |
|
||
| Homebuilding | 1 | $8B |
|
||
Price history
+277.4% since first listed11 events — show timeline
- 2026-06-09 Pending — YAR
- 2026-06-05 Listed $100,000 YAR
- 2023-02-04 Listed $210,000 YAR
- 2021-07-16 Sold (Public Records) $165,000 Public Records
- 2018-06-01 Sold (Public Records) $98,000 Public Records
- 2018-06-01 Sold (MLS) $98,000 YAR
- 2017-11-28 Listed $104,900 YAR
- 2010-04-20 Sold (Public Records) $71,900 Public Records
- 2007-05-22 Sold (Public Records) $121,650 Public Records
- 2007-01-30 Sold (Public Records) $70,000 Public Records
- 1977-08-01 Sold (Public Records) $26,500 Public Records
Property tax history
+4.1%/yrLatest (2025): $1,172 · +3.1% YoY. Source: county tax records.
Cash-flow waterfall
monthlySold comps — $/sqft
last 12 mo · ≤1 miLoading sold comps…