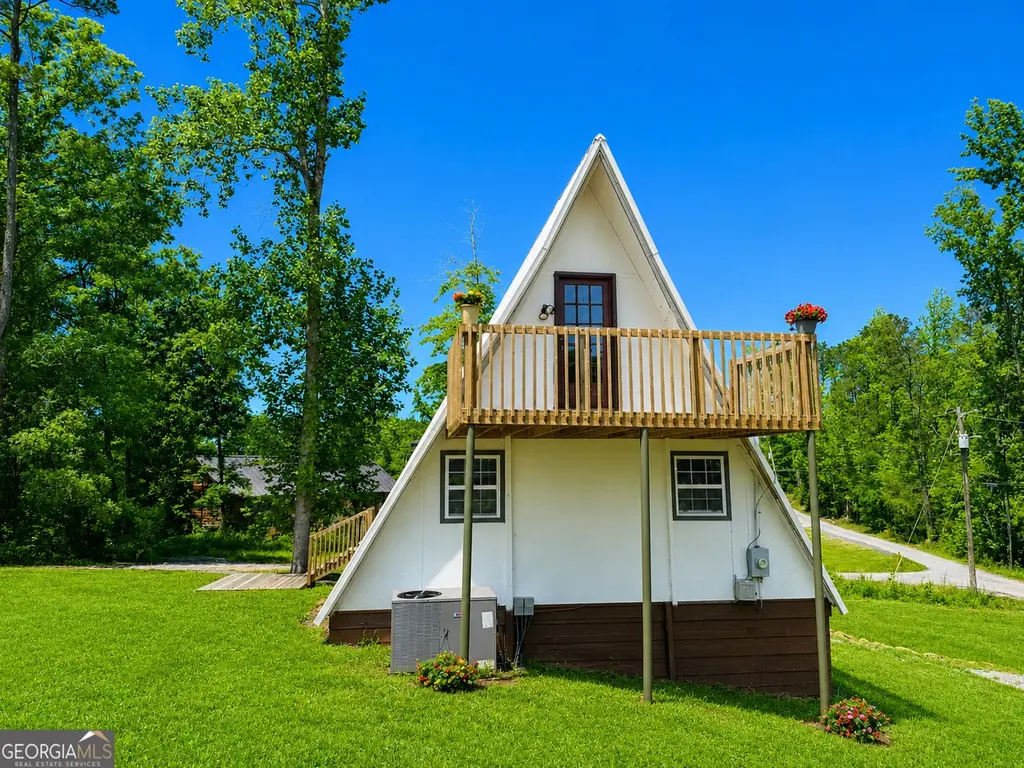
9 Cherokee Resort Rd · Pine Mountain, GA
Flood risk 1/10 · Minimal
- FEMA flood zone
- X (unshaded)
- Chance of flooding over 30 yrs
- 0.0%
- Est. flood insurance / yr
- $507 – $1,088
Fire risk 4/10 · Minor
- Est. fire insurance / yr
- $963 – $1,789
Heat risk 5/10 · Moderate
- Hot days now (above 105°F)
- 7 days/yr
- Hot days in 30 yrs
- 18 days/yr
Wind risk 6/10 · Moderate
- Chance of severe wind over 30 yrs
- 55.0%
Air-quality risk 3/10 · Minor
- Unhealthy air days now
- 3 days/yr
- Unhealthy air days in 30 yrs
- 3 days/yr
Risk factors via First Street. Map © Google.
Why this score? — see what drove the D grade
The composite is a weighted blend of 9 inputs, each scored 0–100. Each bar is that input's sub-score; the figure is the points it added to the 100-point composite (weight × sub-score).
- ARV discount +13.9/15.0
- Cash flow +11.0/30.0
- 1% rule +3.7/10.0
- DSCR +3.2/10.0
- Livability +3.0/5.0
- Rent growth +2.5/5.0
- Condition / age +2.5/5.0
- Schools +2.3/10.0
- Appreciation +0.0/10.0
$125,000
🖨 Deal sheet (PDF) 📄 Offer letter ✓ Due diligence
Listing remarks
Welcome to 9 Cherokee Resort Road, Pine Mountain, Troup County! Cherokee Resort quaint area of 16 properties. The HOA $130 per month, which includes water, garbage pick up and access to the stocked lake. This charming Pine Mountain chalet-style residence ideal weekend getaway. Characterized by its dramatic steep-pitched roofline that extends nearly to the ground, this Pine Mountain beauty known for the striking architectural design, vaulted ceilings, exposed beams, and abundant natural light. This 2 bedroom, 2 bath with partial walkout basement offers stainless appliances, winding staircase, front and back decks for Bbq's. Convenient access to some of West Georgia's most popular outdoor rec
Key facts
- Outdoor recreation
- Convenient access
- Exposed beams
Tags
Property features AI
Finance
- Other: Listing accepts 1031 Exchange, Cash, Conventional, FHA, USDA, and VA financing
- HOA & community: Has association; Annual association fee (amount listed); Association fee covers water, trash, security, reserve fund, and other items; Community features: clubhouse, lake
Exterior
- Parking: Off-street parking; Parking pad; Open parking
- Security: Association-provided security
- Utilities: Public water; Septic tank; Electricity available; Cable available; High-speed internet available
- Home design: Single-family house; One and one-half story; Resale property
- Construction: Built in 1973; Wood siding; Composition roof; Crawl space foundation
- Exterior features: Balcony; Deck; In-ground pool; Grassed and partially wooded yard; Sloped lot; Has a view
Interior
- Kitchen: Cooktop; Dishwasher; Refrigerator; Breakfast bar; Pantry
- Bedrooms: 2 bedrooms total (1 bedroom on the main level)
- Flooring: Laminate
- Bathrooms: 2 full bathrooms
- Heating & cooling: Central heating (electric); Central air (electric); Ceiling fan(s)
- Interior features: Vaulted ceilings; Family room; Loft
- Laundry & utility: Laundry area (other)
Neighborhood map
What this means for you Summary
Snapshot
- This is a 2-bed/1.5-bath single-family listed at $125k.
Deal economics
- At list price, monthly cash flow is $-54 ($-643/yr) — negative.
- To cash-flow at today's rent, offer at most $116k (7.6% below list).
- To meet the 1% rule (rent ≥ 1% of price), the offer needs to be $109k (12.6% below list).
- Recommended offer: $109k (12.6% below list) — sets the bar for 1% rule.
- Cap rate 5.8% vs local median 1.6% in Pine Mountain — top-decile yield for the area; either an underpriced asset or a hidden risk that comps aren't pricing in. Stress-test before assuming the spread holds.
Location & tenants
- Location reads 60/100 on livability (#372 in GA) — a middle-class / working-renter tenant base. Strengths: cost of living A+, housing A-; Watch: amenities F, commute F, employment D-.
- Troup County (rural): math 26% / reading 29% proficiency, ranked #109 of 174 in GA (top 63%) — low school quality limits family demand, transient renter base, plan for 1-2y turnover.
- Zoned schools: Rosemont Elementary School (math 46% / reading 42%, grade F, #356 of 1,228 statewide, top 30%, 581 students, 49% FRL); Gardner-Newman Middle School (math 25% / reading 32%, grade F, #260 of 470 statewide, top 56%, 1,039 students, 94% FRL); Troup County High School (math 15% / reading 38%, grade F, #171 of 424 statewide, top 41%, 1,341 students, 49% FRL).
- Market conditions: 125 active listings in the ZIP; 474 units permitted in Troup County in 2024 (87 in 5+ unit buildings).
Forward outlook
- Local home prices are declining (-3.0%/yr); year-one equity from $864 of loan paydown is wiped out by about $4k of value loss. Plan a longer hold.
- Troup County population projected at +15% by 2050 — long-run rental-demand tailwind backs the buy-and-hold thesis.
Negotiation context
- It's been on market 48 days — a 3% lower offer ($121k) is reasonable based on typical stale-listing flexibility.
- 6 sale attempts since 7y ago; this cycle's ask has dropped $7k (5%) from the opening price — seller is motivated, your offer sets the floor, not the list.
- Current owner paid $68k; list at $125k implies a 84% gain — meaningful room to come down on a strong offer.
Risks & watch-outs
- Climate carrying-cost: major wind risk, 55% chance of damaging wind over 30y; extreme-heat days projected 7→18/yr by 2055 (HVAC capex compounding) — expect insurance premiums to compound above CPI over the hold.
Questions for the listing agent
- What do current leases actually rent for vs. the listed asking? Can we see a recent rent roll and the last 12 months of T-12 income?
- It's been on market 48 days. Have you received any prior offers? Is the seller open to a 13% concession, seller financing, or rate buy-down credit?
- Built in 1973 — when were the roof, HVAC, electrical panel, plumbing, and water heater last replaced?
- What does the HOA fee cover, when was the last increase, and are there any pending special assessments or reserve-fund shortfalls?
- Is there a deadline driving the sale (1031 exchange, divorce, estate, relocation)? That informs how much negotiation room exists.
- Schools are F-rated, which usually means shorter tenancies and higher turnover. Who's the typical renter profile here, and what's been the actual vacancy rate?
- The area grade is low — what's the realistic commute time and amenity access for the typical tenant pool here? Any planned neighborhood developments (good or bad) we should know about?
- What's the average days-on-market for RENTAL listings here right now (not sales)? A rising rental-DOM trend means longer vacancies and softer asking-rent achievability than the comps imply.
- What's the recent tenant-quality profile in this submarket — average credit score on applications, eviction rate, late-payment / NSF rate, and stable-employment percentage? A property-management company in the area should have these aggregated.
- How much new for-sale + rental construction is in the pipeline within 1–3 miles? Heavy new supply typically softens prices + rents 12–24 months out; constrained supply supports both.
Investment metrics
- 1% rule
- 0.87% ✗
- Cap rate
- 5.78%
- Cash-on-cash
- -1.84%
- DSCR
- 0.92
- GRM
- 9.5
CMA / ARV
- ARV (median comp)
- $145,889
- List price
- $125,000
- Delta
- -14.32%
- Verdict
- UNDERPRICED
- Comps
- 4 within 1.0 mi
Show comp detail 2 sales within ~0.75 mi
| Address | Dist | Beds/Ba | Sqft | Sold | Price | $/sf | Match |
|---|---|---|---|---|---|---|---|
| 5 Cherokee Resort Rd | 0.08mi | 2/2.0 | 816 (-2%) | 17mo | $154,000 | $189 | 77 |
| 11 Cherokee Resort Rd | 0.05mi | 2/1.0 | 869 (+4%) | 19mo | $137,000 | $158 | 72 |
Match score weights: distance 35% · size 25% · config 20% · recency 20%. Top-matched comps best support the ARV.
Projected returns pro-forma
-3.0% appreciation · 3.0% rent growth · sell at horizon
- IRR
- -19.3%
- Equity multiple
- 0.33×
- Total profit
- $-23,621
- Equity at exit
- $18,638
- IRR
- -11.9%
- Equity multiple
- 0.29×
- Total profit
- $-24,767
- Equity at exit
- $10,808
Cash invested: $35,000 (down + closing). Projections, not guarantees.
Landlord ↔ Tenant lean methodology
- Overall (STATE)
- 90 Strongly Landlord-Friendly
- State Georgia
- 90 Strongly Landlord-Friendly · R+3
- County
- — inherits STATE
- City
- — inherits STATE
ZIP-level market 31822
- Home prices YoY
- -21.9%
- Active inventory
- 125
- Price-to-rent
- 9.5×
Monthly cashflow live
- Estimated rent
- $1,092 medium interval (Pro) →
- Mortgage (P&I)
- −$656
- Tax from tax record
- −$79 /mo · $947/yr
- Insurance
- −$52
- HOA
- −$130
- Vacancy / Maint / Mgmt
- −$229
- Net cashflow
- $-54
Break-even live
Sensitivity live
| Price | -10% $17 | -5% $-18 | +0% $-54 | +5% $-89 | +10% $-124 |
|---|---|---|---|---|---|
| Rent | -10% $-140 | -5% $-97 | +0% $-54 | +5% $-10 | +10% $33 |
| Rate | -1.0pp $9 | -0.5pp $-22 | base $-54 | +0.5pp $-86 | +1.0pp $-119 |
UW: 25.0% down · 7.5% · 30yr · 1.5% tax · 5.0% vac · 8.0% maint · 8.0% mgmt
Financing live
Cash to close
- Down payment
- $31,250
- Closing costs
- $3,750
- Reserves months
- —
- Total cash needed
- —
Loan-product check · same deal, 3 products live
Conventional
25% down · 7.5% · 30yr
- Down + closing
- —
- Monthly P&I
- —
- Monthly cashflow
- —
- DSCR
- —
- Eligible?
- —
Personal DTI + credit; lowest rate.
DSCR
20% down · 8.5% · 30yr
- Down + closing
- —
- Monthly P&I
- —
- Monthly cashflow
- —
- DSCR
- —
- Eligible?
- —
No personal income docs; deal must DSCR.
Hard money
10% down · 12.0% · 12mo
- Down + closing
- —
- Monthly P&I
- —
- Monthly cashflow
- —
- DSCR
- —
- Eligible?
- —
Short-term bridge; refi at stabilization.
HOA detail
- Monthly dues
- $130 · $1,560/yr
- Likely covers
- watertrash
Listing history 33 events
-
2026-06-22days on market $125,000 Active 48 DOM
-
2026-06-21days on market $125,000 Active 47 DOM
-
2026-06-19days on market $125,000 Active 45 DOM
-
2026-06-18days on market $125,000 Active 44 DOM
-
2026-06-17days on market $125,000 Active 43 DOM
-
2026-06-16days on market $125,000 Active 42 DOM
-
2026-06-15days on market $125,000 Active 41 DOM
-
2026-06-14days on market $125,000 Active 39 DOM
-
2026-06-12days on market $125,000 Active 38 DOM
-
2026-06-09days on market $125,000 Active 35 DOM
-
2026-06-08days on market $125,000 Active 34 DOM
-
2026-06-07days on market $125,000 Active 33 DOM
-
2026-06-05statusdays on market $125,000 Active 30 DOM
-
2026-06-02pricestatusdays on market $125,000 Price Change 28 DOM
-
2026-06-01days on market $132,000 Active 27 DOM
-
2026-05-31days on market $132,000 Active 26 DOM
-
2026-05-30days on market $132,000 Active 25 DOM
-
2026-04-13$132,000 New 1523-char remark
-
2026-03-31historical
-
2026-01-05$130,000 New
-
2025-12-16price $130,000
-
2025-10-11historical
-
2025-07-30price $140,000
-
2025-07-30price $140,000
-
2025-06-13$145,000 New
-
2020-02-10soldstatus $68,000
-
2020-02-07soldstatus $68,000 Sold
-
2020-02-07soldstatus $68,000
-
2020-01-09status Under Contract
-
2019-10-28status Back on Market
-
2019-10-17status Under Contract
-
2019-07-09$79,000 New
-
2019-07-09$79,000
ⓘ Source: listings_history table (triggers on properties + properties_extension) + one-shot
backfill from property_details.listing_events for pre-trigger history.
Tax reassessment forecast GA · Resets to sale price
- Current annual tax
- $947 · $79/mo
- Projected year-2 tax
- $1,150 · $96/mo
- Expected delta
- +$203/yr (+$17/mo · 21.4%)
ⓘ Screening estimate from a state-policy table — verify with the county assessor before closing.
Climate risk First Street
- Flood 1/10 Low FEMA zone X (unshaded) · 0% chance over 30 yrs
- Wildfire 4/10 Moderate
- Heat 5/10 Major 7 d/yr ≥105°F today · 18 d/yr by 30 yrs out
- Wind 6/10 Major 55% chance of damaging wind over 30 yrs
- Air quality 3/10 Moderate 3 unhealthy d/yr today · 3 by 30 yrs out
Nearby sold comps map
Loading sold comps map…
Walkable amenities ~0.75 mi
Loading nearby amenities…
Taxation est. · year 1
- Rental income
- $13,107
- − Mortgage interest
- −$7,002
- − Property taxes
- −$947
- − Insurance
- −$625
- − Repairs & maintenance
- −$1,049
- − Management
- −$1,049
- − HOA
- −$1,560
- − Depreciation
- −$3,636
- Taxable loss
- −$2,760
- Est. tax savings @ 24.0%
- +$662
- After-tax cash flow
- $19/yr
For passive investors: Depreciation is non-cash, so a rental often shows a tax loss while cash-flowing — sheltering income. Rental losses are passive: they offset passive income freely, and up to $25,000/yr can offset ordinary (W-2) income if you actively participate and your MAGI is under $100k (phasing out to $0 by $150k); unused losses carry forward. On sale, claimed depreciation is recaptured at up to 25%, and gains may owe capital-gains tax (a 1031 exchange can defer both). Figures are a year-1 estimate at your 24.0% rate — not tax advice; consult a CPA.
Schools (NCES district)
- District
- Troup County
- NCES district ID
- 1300001
- Math proficiency
- 26% ▼ -10.00%
- Reading proficiency
- 29% ▼ -4.00%
- Median HH income
- $41,354
- Composite
- 23.3/100
- National rank
- #7920
- State rank
- #109 of 174 in GA
Livability — Pine Mountain
- Score
- 60/100
- State rank
- #372
- US rank
- #18917
Category grades
Schools grade is shown separately in the Schools card above.
Census & demographics
- Population (ZIP)
- 5,555
Population outlook (Troup County) Hauer SSP2
- Today (2025)
- 75,537 people
- By 2030
- 78,250 · +3.6%
- By 2040
- 83,184 · +10.1%
- By 2050
- 87,167 · +15.4%
- By 2075
- 95,643 · +26.6%
- By 2100
- 94,234 · +24.8%
Race, ethnicity, and origin ACS 2023
- Neighborhood character
- Majority White (62%)
- Race & ethnicity
- White 62% Black 32% Two or more races 5% Hispanic / Latino 4%
- Common ancestry
- Portuguese 2% Italian 1% Serbian 1%
- Foreign-born
- 0% · Canada
- Languages at home
- 99% English-only · Spanish 1%
Political lean MEDSL · Troup
- 2024 margin
- Strong R (+24.4) · D 37.6% · R 62.0%
- 2008→2024 swing
- -5.4pp toward R · 2008: -19.0pp · 2024: -24.4pp
- All cycles
- 2024: R+24.4 2020: R+21.9 2016: R+23.4 2012: R+17.8 2008: R+19.0
Not yet ingested
- Civics
- —
Market trends
- HPI YoY
- ▼ -58.86%
- Current HPI
- 209.4038
- Rent YoY
- —
- Metro
- —
- State GDP YoY
- ▲ 2.66%
- F500 in state
- 28
Industry mix (Fortune 500 HQ in GA)
| Industry | F500 HQs | Revenue |
|---|---|---|
| Paper / Packaging | 2 | $29B |
|
||
| Retail | 1 | $160B |
|
||
| Transportation / Logistics | 1 | $91B |
|
||
| Airlines | 1 | $62B |
|
||
| Consumer Goods | 1 | $47B |
|
||
| Utilities | 1 | $25B |
|
||
Price history
+58.2% since first listed17 events — show timeline
- 2026-06-02 Price Changed $125,000 GAMLS
- 2026-04-13 Listed $132,000 GAMLS
- 2026-03-31 Listing Removed — GAMLS
- 2026-01-05 Listed $130,000 GAMLS
- 2025-12-16 Price Changed $130,000 CBOR
- 2025-10-11 Listing Removed — GAMLS
- 2025-07-30 Price Changed $140,000 CBOR
- 2025-07-30 Price Changed $140,000 GAMLS
- 2025-06-13 Listed $145,000 GAMLS
- 2020-02-10 Sold (Public Records) $68,000 Public Records
- 2020-02-07 Sold (MLS) $68,000 CBOR
- 2020-02-07 Sold (MLS) $68,000 GAMLS
- 2020-01-09 Pending — GAMLS
- 2019-10-28 Relisted — GAMLS
- 2019-10-17 Pending — GAMLS
- 2019-07-09 Listed $79,000 CBOR
- 2019-07-09 Listed $79,000 GAMLS
Property tax history
+1.6%/yrLatest (2025): $947 · +52.6% YoY. Source: county tax records.
Cash-flow waterfall
monthlySold comps — $/sqft
last 12 mo · ≤1 miLoading sold comps…