3606 E 3rd Pl · Lubbock, TX
Flood risk 1/10 · Minimal
- FEMA flood zone
- X (unshaded)
- Chance of flooding over 30 yrs
- 0.0%
- Est. flood insurance / yr
- $507 – $1,088
Fire risk 5/10 · Moderate
- Est. fire insurance / yr
- $1,222 – $2,270
Heat risk 5/10 · Moderate
- Hot days now (above 100°F)
- 7 days/yr
- Hot days in 30 yrs
- 22 days/yr
Wind risk 2/10 · Minimal
- Chance of severe wind over 30 yrs
- 2.0%
Air-quality risk 2/10 · Minimal
- Unhealthy air days now
- 1 days/yr
- Unhealthy air days in 30 yrs
- 1 days/yr
Risk factors via First Street. Map © Google.
Why this score? — see what drove the D grade
The composite is a weighted blend of 9 inputs, each scored 0–100. Each bar is that input's sub-score; the figure is the points it added to the 100-point composite (weight × sub-score).
- Cash flow +13.6/30.0
- ARV discount +7.5/15.0
- DSCR +4.1/10.0
- Livability +4.0/5.0
- 1% rule +3.8/10.0
- Schools +3.1/10.0
- Rent growth +2.9/5.0
- Condition / age +2.5/5.0
- Appreciation +0.0/10.0
$125,900
🖨 Deal sheet (PDF) 📄 Offer letter ✓ Due diligence
Listing remarks MLS
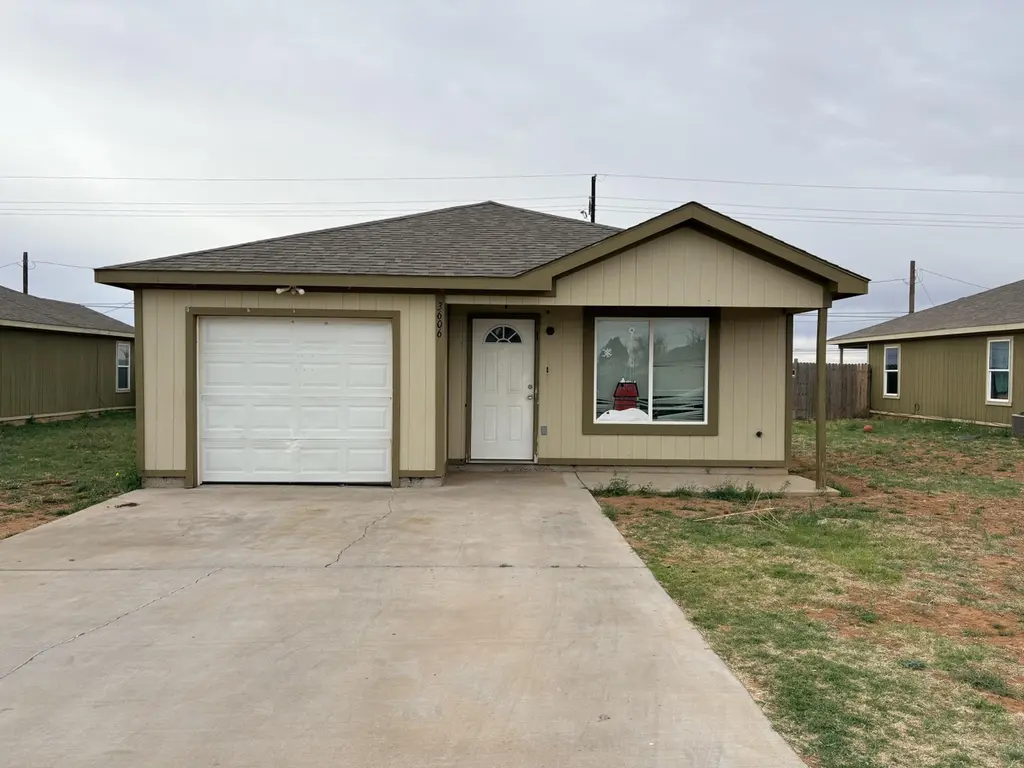
Welcome to this 3-bedroom, 2-bath home featuring an open-concept layout and a 1-car garage. Ideally located with quick access to Marsha Sharp Freeway, offering convenient connectivity to anywhere in the city. The spacious living and dining areas flow seamlessly, making it perfect for everyday living and entertaining. Enjoy peaceful mornings while catching the beautiful sunrise. This property is an excellent opportunity for families seeking comfort and convenience or investors looking to add a solid asset to their portfolio.
Key facts
- 7,112 sq ft lot
- Built 2020
- Listed 51 days
Neighborhood map
What this means for you Summary
Snapshot
- This is a 3-bed/2.0-bath single-family listed at $126k.
Deal economics
- At list price, monthly cash flow is $6 ($77/yr) — positive.
- The deal already cash-flows at list — no discount required.
- To meet the 1% rule (rent ≥ 1% of price), the offer needs to be $111k (11.6% below list).
- Recommended offer: $111k (11.6% below list) — sets the bar for 1% rule.
Location & tenants
- Location reads 80/100 on livability (#37 in TX, #1,749 nationally) — a professional / high-income tenant draw. Strengths: commute A+, cost of living A+, housing A+; Watch: employment C-, crime F.
- Lubbock ISD (urban): math 36% / reading 39% proficiency, ranked #481 of 826 in TX (top 58%) — families likely to look elsewhere, expect single-tenant / working-renter base with shorter leases; 60% free/reduced lunch — lower-income household profile, screen leases tightly.
- Zoned schools: Ervin El (math 17% / reading 17%, grade F, #3,836 of 4,322 statewide, top 91%, 405 students, 97% FRL, charter); Dunbar College Preparatory Academy (math 16% / reading 20%, grade F, #1,491 of 1,662 statewide, top 91%, 430 students, 97% FRL, charter); Estacado H S (math 26% / reading 29%, grade F, #1,183 of 1,632 statewide, top 73%, 897 students, 90% FRL) — zoned schools average 95% FRL vs 60% district-wide (35 pts higher); higher-poverty schools than district average — tighter screening recommended.
- Zoned-school proficiency averages 21% at this address vs 38% district-wide (-17 pts) — the specific schools serving this property underperform the Lubbock ISD average; the district grade overstates school quality for this exact location.
- Market conditions: Rents rising (+1.5%/yr); 166 active listings in the ZIP; 40 comparable units currently listed for rent nearby; rentals at typical pace (median 23d on market — plan ~3-4 weeks tenant-placement turnaround); 2,219 units permitted in Lubbock County in 2024 (252 in 5+ unit buildings).
Forward outlook
- Local home prices are declining (-3.0%/yr); year-one equity from $870 of loan paydown is wiped out by about $4k of value loss. Plan a longer hold.
- Lubbock County population projected at +39% by 2050 — long-run rental-demand tailwind backs the buy-and-hold thesis.
Negotiation context
- It's been on market 51 days — a 3% lower offer ($122k) is reasonable based on typical stale-listing flexibility.
- 2 sale attempts since 3y ago; this cycle's ask is 5% above the opening price — seller raised mid-cycle; expect resistance to lowballs.
Risks & watch-outs
- Climate carrying-cost: moderate wildfire risk; extreme-heat days projected 7→22/yr by 2055 (HVAC capex compounding) — expect insurance premiums to compound above CPI over the hold.
Questions for the listing agent
- It's been on market 51 days. Have you received any prior offers? Is the seller open to a 12% concession, seller financing, or rate buy-down credit?
- Is there a deadline driving the sale (1031 exchange, divorce, estate, relocation)? That informs how much negotiation room exists.
- Schools are D-rated, which usually means shorter tenancies and higher turnover. Who's the typical renter profile here, and what's been the actual vacancy rate?
- Crime grade is F in this area — have there been break-ins, vandalism, or insurance claims at this property in the last 3 years? What carrier currently insures it and at what premium?
- The area grade is low — what's the realistic commute time and amenity access for the typical tenant pool here? Any planned neighborhood developments (good or bad) we should know about?
- What's the average days-on-market for RENTAL listings here right now (not sales)? A rising rental-DOM trend means longer vacancies and softer asking-rent achievability than the comps imply.
- What's the recent tenant-quality profile in this submarket — average credit score on applications, eviction rate, late-payment / NSF rate, and stable-employment percentage? A property-management company in the area should have these aggregated.
- How much new for-sale + rental construction is in the pipeline within 1–3 miles? Heavy new supply typically softens prices + rents 12–24 months out; constrained supply supports both.
Investment metrics
- 1% rule
- 0.88% ✗
- Cap rate
- 6.35%
- Cash-on-cash
- 0.22%
- DSCR
- 1.01
- GRM
- 9.4
CMA / ARV
No comps found within radius.
Projected returns pro-forma
-3.0% appreciation · 1.52% rent growth · sell at horizon
- IRR
- -17.6%
- Equity multiple
- 0.39×
- Total profit
- $-21,605
- Equity at exit
- $18,772
- IRR
- -12.8%
- Equity multiple
- 0.30×
- Total profit
- $-24,715
- Equity at exit
- $10,886
Cash invested: $35,252 (down + closing). Projections, not guarantees.
Landlord ↔ Tenant lean methodology
- Overall (STATE)
- 87 Strongly Landlord-Friendly
- State Texas
- 87 Strongly Landlord-Friendly · R+5
- County
- — inherits STATE
- City
- — inherits STATE
ZIP-level market 79403
- Home prices YoY
- -9.0%
- Rents YoY
- 1.5%
- Active inventory
- 166
- Price-to-rent
- 9.4×
Monthly cashflow live
- Estimated rent
- $1,113 high interval (Pro) →
- Mortgage (P&I)
- −$660
- Tax from tax record
- −$160 /mo · $1,921/yr
- Insurance
- −$52
- HOA
- −$0
- Vacancy / Maint / Mgmt
- −$234
- Net cashflow
- $6
Break-even live
Sensitivity live
| Price | -10% $78 | -5% $42 | +0% $6 | +5% $-29 | +10% $-65 |
|---|---|---|---|---|---|
| Rent | -10% $-81 | -5% $-38 | +0% $6 | +5% $50 | +10% $94 |
| Rate | -1.0pp $70 | -0.5pp $38 | base $6 | +0.5pp $-26 | +1.0pp $-59 |
UW: 25.0% down · 7.5% · 30yr · 1.5% tax · 5.0% vac · 8.0% maint · 8.0% mgmt
Financing live
Cash to close
- Down payment
- $31,475
- Closing costs
- $3,777
- Reserves months
- —
- Total cash needed
- —
Loan-product check · same deal, 3 products live
Conventional
25% down · 7.5% · 30yr
- Down + closing
- —
- Monthly P&I
- —
- Monthly cashflow
- —
- DSCR
- —
- Eligible?
- —
Personal DTI + credit; lowest rate.
DSCR
20% down · 8.5% · 30yr
- Down + closing
- —
- Monthly P&I
- —
- Monthly cashflow
- —
- DSCR
- —
- Eligible?
- —
No personal income docs; deal must DSCR.
Hard money
10% down · 12.0% · 12mo
- Down + closing
- —
- Monthly P&I
- —
- Monthly cashflow
- —
- DSCR
- —
- Eligible?
- —
Short-term bridge; refi at stabilization.
Rent comps 40 comps
| Address | Beds | Baths | Sqft | Rent | $/sqft | DOM | Units | Dist |
|---|---|---|---|---|---|---|---|---|
| 3611 E 3rd Pl Lubbock, TX | 3.0 | 2.0 | 1154 | $1,199 | $1.04 | 45d | 1 | 0.06mi |
| 3016 E 3rd St Lubbock, TX | 3.0 | 1.0 | 978 | $695 | $0.71 | 23d | 1 | 0.52mi |
| 411 David Ave Lubbock, TX | 3.0 | 2.0 | 1204 | $1,200 | $1.00 | 15d | 1 | 0.58mi |
| 804 David Ave Lubbock, TX | 3.0 | 2.0 | 1028 | $1,049 | $1.02 | 15d | 1 | 0.59mi |
| 1014 David Ave Lubbock, TX | 3.0 | 2.0 | 1028 | $1,030 | $1.00 | 15d | 1 | 0.70mi |
| 2815 E 2nd St Apt 2 Lubbock, TX | 3.0 | 1.0 | 750 | $625 | $0.83 | 15d | 1 | 0.71mi |
| 312 Beech Ave Lubbock, TX | 3.0 | 1.0 | 816 | $695 | $0.85 | 23d | 1 | 0.73mi |
| 312 Beech Ave Lubbock, TX | 3.0 | 1.0 | 816 | $800 | $0.98 | 45d | 1 | 0.73mi |
| 3621 E 15th Pl Lubbock, TX | 3.0 | 2.0 | 1028 | $1,114 | $1.08 | 45d | 1 | 0.78mi |
| 2726 E 2nd St Lubbock, TX | 3.0 | 1.0 | 816 | $695 | $0.85 | 23d | 1 | 0.80mi |
| 2721 E 3rd St Lubbock, TX | 3.0 | 2.0 | 1172 | $1,050 | $0.90 | 15d | 1 | 0.80mi |
| 2912 E Baylor St Lubbock, TX | 3.0 | 2.0 | 1176 | $695 | $0.59 | 23d | 1 | 0.83mi |
| 2912 E Baylor St Lubbock, TX | 3.0 | 2.0 | 1176 | $900 | $0.77 | 45d | 1 | 0.83mi |
| 3118 E Cornell St Lubbock, TX | 3.0 | 2.0 | 1125 | $1,150 | $1.02 | 23d | 1 | 0.84mi |
| 3116 E Cornell St Lubbock, TX | 3.0 | 2.0 | 1125 | $1,150 | $1.02 | 23d | 1 | 0.85mi |
| 3411 E 16th St Lubbock, TX | 3.0 | 2.0 | 1400 | $1,100 | $0.79 | 23d | 1 | 0.87mi |
| 2924 E Cornell St Lubbock, TX | 3.0 | 2.0 | 1247 | $1,150 | $0.92 | 23d | 1 | 0.90mi |
| 2612 E Auburn St Lubbock, TX | 4.0 | 2.0 | 1196 | $1,095 | $0.92 | 23d | 1 | 0.94mi |
| 2624 E Cornell St Lubbock, TX | 3.0 | 2.0 | 1298 | $1,330 | $1.02 | 15d | 1 | 1.04mi |
| 306 Zenith Ave Lubbock, TX | 3.0 | 2.0 | 1298 | $1,165 | $0.90 | 23d | 1 | 1.06mi |
| 602 Walnut Ave Lubbock, TX | 3.0 | 2.0 | 1172 | $1,100 | $0.94 | 45d | 1 | 1.07mi |
| 2608 E Colgate St Lubbock, TX | 3.0 | 1.0 | 990 | $900 | $0.91 | 45d | 1 | 1.07mi |
| 310 Zenith Ave Lubbock, TX | 3.0 | 2.0 | 1298 | $1,164 | $0.90 | 15d | 1 | 1.07mi |
| 1828 E 1st St Lubbock, TX | 3.0 | 1.0 | 1011 | $695 | $0.69 | 23d | 1 | 1.14mi |
| 1933 E Colgate St Lubbock, TX | 4.0 | 1.0 | 1310 | $795 | $0.61 | 23d | 1 | 1.15mi |
| 808 Vanda Ave Lubbock, TX | 3.0 | 1.0 | 832 | $695 | $0.84 | 23d | 1 | 1.16mi |
| 2226 E Main St Lubbock, TX | 3.0 | 2.0 | 1100 | $1,150 | $1.05 | 45d | 1 | 1.16mi |
| 824 Vanda Ave Lubbock, TX | 3.0 | 1.0 | 832 | $750 | $0.90 | 45d | 1 | 1.19mi |
| 2123 E Broadway Unit 2 Lubbock, TX | 3.0 | 1.0 | 963 | $950 | $0.99 | 23d | 1 | 1.19mi |
| 2211 E Main St Lubbock, TX | 3.0 | 2.0 | 1172 | $1,100 | $0.94 | 45d | 1 | 1.20mi |
| 2117 E Broadway Unit 1 Lubbock, TX | 3.0 | 1.0 | 963 | $950 | $0.99 | 45d | 1 | 1.21mi |
| 1809 E 2nd St Lubbock, TX | 4.0 | 2.0 | 1203 | $1,000 | $0.83 | 45d | 1 | 1.22mi |
| 2206 E Main St Lubbock, TX | 3.0 | 2.0 | 1152 | $975 | $0.85 | 46d | 1 | 1.23mi |
| 1918 E Cornell St Lubbock, TX | 3.0 | 2.0 | 1028 | $1,080 | $1.05 | 23d | 1 | 1.25mi |
| 1802 E 2nd St Lubbock, TX | 4.0 | 1.0 | 1096 | $875 | $0.80 | 45d | 1 | 1.26mi |
| 1802 E 2nd St Lubbock, TX | 4.0 | 1.0 | 1096 | $695 | $0.63 | 23d | 1 | 1.26mi |
| 1808 E Auburn St Lubbock, TX | 3.0 | 2.0 | 1172 | $1,100 | $0.94 | 23d | 1 | 1.29mi |
| 1711 E 1st St Lubbock, TX | 3.0 | 2.0 | 1124 | $900 | $0.80 | 23d | 1 | 1.38mi |
| 1730 E Dartmouth St Unit A Lubbock, TX | 3.0 | 1.0 | 1015 | $695 | $0.68 | 45d | 1 | 1.41mi |
| 1726 E Dartmouth St Unit A Lubbock, TX | 3.0 | 1.0 | 1100 | $1,000 | $0.91 | 23d | 1 | 1.43mi |
Listing history 8 events
-
2026-04-07$119,900 Active 530-char remark
Show marketing remark (530 chars)
Welcome to this 3-bedroom, 2-bath home featuring an open-concept layout and a 1-car garage. Ideally located with quick access to Marsha Sharp Freeway, offering convenient connectivity to anywhere in the city. The spacious living and dining areas flow seamlessly, making it perfect for everyday living and entertaining. Enjoy peaceful mornings while catching the beautiful sunrise. This property is an excellent opportunity for families seeking comfort and convenience or investors looking to add a solid asset to their portfolio.
-
2024-03-14historical $1,095
-
2024-01-30price $1,095
-
2023-12-13price $1,100
-
2023-11-10
-
2023-05-23historical
-
2020-07-23soldstatus
-
2020-07-23soldstatus
ⓘ Source: listings_history table (triggers on properties + properties_extension) + one-shot
backfill from property_details.listing_events for pre-trigger history.
Tax reassessment forecast TX · Resets to sale price
- Current annual tax
- $1,921 · $160/mo
- Projected year-2 tax
- $2,304 · $192/mo
- Expected delta
- +$383/yr (+$32/mo · 19.9%)
ⓘ Screening estimate from a state-policy table — verify with the county assessor before closing.
Climate risk First Street
- Flood 1/10 Low FEMA zone X (unshaded) · 0% chance over 30 yrs
- Wildfire 5/10 Major
- Heat 5/10 Major 7 d/yr ≥100°F today · 22 d/yr by 30 yrs out
- Wind 2/10 Low 2% chance of damaging wind over 30 yrs
- Air quality 2/10 Low 1 unhealthy d/yr today · 1 by 30 yrs out
Nearby sold comps map
Loading sold comps map…
Walkable amenities ~0.75 mi
Loading nearby amenities…
Taxation est. · year 1
- Rental income
- $13,356
- − Mortgage interest
- −$7,052
- − Property taxes
- −$1,921
- − Insurance
- −$630
- − Repairs & maintenance
- −$1,068
- − Management
- −$1,068
- − Depreciation
- −$3,663
- Taxable loss
- −$2,047
- Est. tax savings @ 24.0%
- +$491
- After-tax cash flow
- $569/yr
For passive investors: Depreciation is non-cash, so a rental often shows a tax loss while cash-flowing — sheltering income. Rental losses are passive: they offset passive income freely, and up to $25,000/yr can offset ordinary (W-2) income if you actively participate and your MAGI is under $100k (phasing out to $0 by $150k); unused losses carry forward. On sale, claimed depreciation is recaptured at up to 25%, and gains may owe capital-gains tax (a 1031 exchange can defer both). Figures are a year-1 estimate at your 24.0% rate — not tax advice; consult a CPA.
Schools (NCES district)
- District
- Lubbock ISD
- NCES district ID
- 4828500
- Math proficiency
- 36% ▼ -8.00%
- Reading proficiency
- 39% ▼ -1.00%
- Median HH income
- $39,820
- Composite
- 31.44/100
- National rank
- #5984
- State rank
- #481 of 826 in TX
Livability — Lubbock
- Score
- 80/100
- State rank
- #37
- US rank
- #1749
Category grades
Schools grade is shown separately in the Schools card above.
Census & demographics
- Census place
- Lubbock, TX
- County
- Lubbock County · 293,542 people
- City population
- 283,030
- Metro
- Lubbock, TX
- Population (ZIP)
- 16,089
- Household income
- $47,907
- Rent vs Own
- Severe rent burden
- 612.0
Population outlook (Lubbock County) Hauer SSP2
- Today (2025)
- 345,960 people
- By 2030
- 371,449 · +7.4%
- By 2040
- 424,539 · +22.7%
- By 2050
- 481,150 · +39.1%
- By 2075
- 633,467 · +83.1%
- By 2100
- 746,853 · +115.9%
Race, ethnicity, and origin ACS 2023
- Neighborhood character
- Diverse neighborhood (Simpson 0.64)
- Race & ethnicity
- Hispanic / Latino 49% White 26% Black 23% Two or more races 16% Native American 1%
- Hispanic origin (detail)
- Mexican 35%
- Common ancestry
- Slovak 1%
- Foreign-born
- 3% · Canada
- Languages at home
- 74% English-only · Spanish 25%
Political lean MEDSL · Lubbock
- 2024 margin
- Solid R (+39.5) · D 29.7% · R 69.2% · Other 1.0%
- 2008→2024 swing
- -2.8pp toward R · 2008: -36.7pp · 2024: -39.5pp
- All cycles
- 2024: R+39.5 2020: R+32.2 2016: R+38.4 2012: R+40.9 2008: R+36.7
Not yet ingested
- Civics
- —
Market trends
- HPI YoY
- ▼ -17.69%
- Current HPI
- 178.9297
- Rent YoY
- ▲ 1.52%
- Metro
- Lubbock, TX
- State GDP YoY
- ▲ 3.95%
- F500 in state
- 110
Industry mix (Fortune 500 HQ in TX)
| Industry | F500 HQs | Revenue |
|---|---|---|
| Energy | 16 | $1,198B |
|
||
| Technology | 5 | $198B |
|
||
| Engineering / Construction | 4 | $72B |
|
||
| Energy Services | 3 | $60B |
|
||
| Utilities | 3 | $41B |
|
||
| Healthcare | 2 | $330B |
|
||
Price history
+10800.0% since first listed8 events — show timeline
- 2026-04-07 Listed $119,900 LARMLS
- 2024-03-14 Rental Removed $1,095 APPFOLIO
- 2024-01-30 Price Changed $1,095 APPFOLIO
- 2023-12-13 Price Changed $1,100 APPFOLIO
- 2023-11-10 Listed for Rent — APPFOLIO
- 2023-05-23 Rental Removed — APPFOLIO
- 2020-07-23 Sold (Public Records) — Public Records
- 2020-07-23 Sold (Public Records) — Public Records
Property tax history
+59.9%/yrLatest (2025): $1,921 · -11.9% YoY. Source: county tax records.
Cash-flow waterfall
monthlySold comps — $/sqft
last 12 mo · ≤1 miLoading sold comps…