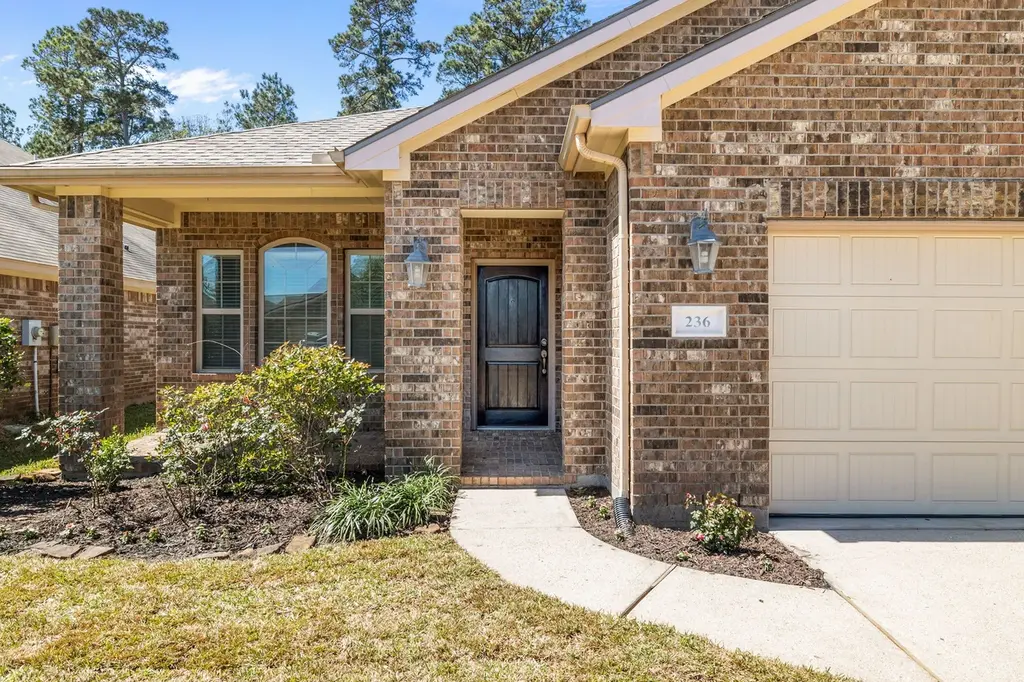
236 Country Crossing Cir · Magnolia, TX
Flood risk 1/10 · Minimal
- FEMA flood zone
- X (unshaded)
- Chance of flooding over 30 yrs
- 0.0%
- Est. flood insurance / yr
- $507 – $1,088
Fire risk 3/10 · Minor
- Est. fire insurance / yr
- $1,222 – $2,270
Heat risk 8/10 · Major
- Hot days now (above 111°F)
- 7 days/yr
- Hot days in 30 yrs
- 23 days/yr
Wind risk 8/10 · Major
- Chance of severe wind over 30 yrs
- 99.0%
Air-quality risk 2/10 · Minimal
- Unhealthy air days now
- 2 days/yr
- Unhealthy air days in 30 yrs
- 2 days/yr
Risk factors via First Street. Map © Google.
Why this score? — see what drove the D+ grade
The composite is a weighted blend of 9 inputs, each scored 0–100. Each bar is that input's sub-score; the figure is the points it added to the 100-point composite (weight × sub-score).
- ARV discount +12.9/15.0
- Appreciation +10.0/10.0
- Cash flow +7.0/30.0
- Schools +3.9/10.0
- Livability +3.7/5.0
- Rent growth +2.6/5.0
- Condition / age +2.5/5.0
- 1% rule +2.3/10.0
- DSCR +1.2/10.0
$264,999
🖨 Deal sheet (PDF) 📄 Offer letter ✓ Due diligence
Listing remarks
Move-In Ready + Spacious Backyard With Storage Shed + No MUD Tax in Magnolia Ridge! Welcome to this beautifully updated one-story home in Magnolia Ridge featuring 3 bedrooms, 2 baths, and a private home office. Built in 2012, this open-concept floor plan offers luxury vinyl plank flooring and a spacious dining and living area flowing seamlessly into the kitchen--ideal for everyday living and entertaining. The well-appointed kitchen includes granite countertops, travertine backsplash, a large island with breakfast bar, gas range, recessed lighting, and a generous walk-in pantry. The primary suite provides a relaxing retreat with double sinks, a garden tub, separate shower, and a large walk-
Key facts
- Spacious backyard
- Storage shed
- Private home office
Tags
Property features AI
Finance
- HOA & community: Homeowners association managed by Real Manage; Annual association fee of $400; HOA covers common areas and recreation facilities; Community features include curbs
Exterior
- Parking: Attached garage (2 spaces)
- Security: Owned security system
- Utilities: Public water; Public sewer
- Home design: Residential property; Faces south
- Construction: Built in 2012; Brick and cement siding exterior; Composition roof; Slab foundation
- Exterior features: Covered patio; Patio; Porch; Deck; Fence (back yard); Storage shed
Interior
- Kitchen: Double oven; Gas range; Gas oven; Dishwasher; Microwave; Refrigerator; Garbage disposal
- Bedrooms: Primary bedroom (First floor) — 15 x 13; Bedroom (First floor) — 12 x 11; Bedroom (First floor) — 12 x 10; Office (First floor) — 10 x 11; Dining room (First floor) — 16 x 7; Family room (First floor) — 16 x 14; Kitchen (First floor) — 16 x 8
- Flooring: Plank flooring; Vinyl flooring
- Bathrooms: 2 full bathrooms
- Heating & cooling: Central heating (gas); Central air conditioning (electric)
- Interior features: Breakfast bar; Double vanity; Granite counters; Kitchen open to family room; Pantry; Soaking tub; Tub with shower; Living and dining area
- Laundry & utility: Washer hookup; Electric dryer hookup; Gas dryer hookup
Neighborhood map
What this means for you Summary
Snapshot
- This is a 3-bed/2.0-bath single-family listed at $265k.
Deal economics
- At list price, monthly cash flow is $-388 ($-5k/yr) — negative.
- To cash-flow at today's rent, offer at most $197k (25.8% below list).
- To meet the 1% rule (rent ≥ 1% of price), the offer needs to be $193k (27.1% below list).
- Recommended offer: $193k (27.1% below list) — sets the bar for 1% rule.
- Cap rate 4.5% vs local median 3.4% in Magnolia — top-decile yield for the area; either an underpriced asset or a hidden risk that comps aren't pricing in. Stress-test before assuming the spread holds.
Location & tenants
- Location reads 73/100 on livability (#222 in TX) — a middle-class / working-renter tenant base. Strengths: crime A+, cost of living A+, housing A+; Watch: amenities F, commute F.
- Magnolia ISD (rural): math 42% / reading 45% proficiency, ranked #247 of 826 in TX (top 30%) — families likely to look elsewhere, expect single-tenant / working-renter base with shorter leases.
- Zoned schools: Willie E Williams El (math 46% / reading 41%, grade F, #1,269 of 4,322 statewide, top 30%, 869 students, 70% FRL); Magnolia J H (math 35% / reading 37%, grade F, #805 of 1,662 statewide, top 50%, 1,103 students, 57% FRL); Magnolia H S (math 47% / reading 62%, grade C-, #379 of 1,632 statewide, top 26%, 2,248 students, 31% FRL).
- Market conditions: Rents flat; 1622 active listings in the ZIP; 12 comparable units currently listed for rent nearby; rentals at typical pace (median 26d on market — plan ~3-4 weeks tenant-placement turnaround); high-income renter base; 13,259 units permitted in Montgomery County in 2024 (1,402 in 5+ unit buildings).
Forward outlook
- In year one you build about $28k of equity ($2k loan paydown + $26k appreciation (10.0% local appreciation)).
- Montgomery County population projected at +65% by 2050 — long-run rental-demand tailwind backs the buy-and-hold thesis.
- By year 2, paydown + projected appreciation supports a ~$46k cash-out refi (75% LTV) — recoverable capital for the next deal without selling this one.
Negotiation context
- It's been on market 50 days — a 3% lower offer ($257k) is reasonable based on typical stale-listing flexibility.
- 2 sale attempts since 10y ago with the ask held roughly flat each time — persistent listings suggest the price (not the market) is what's stuck; bring a comps-based counter.
Risks & watch-outs
- Climate carrying-cost: severe wind risk, 99% chance of damaging wind over 30y; extreme-heat days projected 7→23/yr by 2055 (HVAC capex compounding) — expect insurance premiums to compound above CPI over the hold.
Questions for the listing agent
- What do current leases actually rent for vs. the listed asking? Can we see a recent rent roll and the last 12 months of T-12 income?
- It's been on market 50 days. Have you received any prior offers? Is the seller open to a 27% concession, seller financing, or rate buy-down credit?
- What does the HOA fee cover, when was the last increase, and are there any pending special assessments or reserve-fund shortfalls?
- Is there a deadline driving the sale (1031 exchange, divorce, estate, relocation)? That informs how much negotiation room exists.
- Schools are D-rated, which usually means shorter tenancies and higher turnover. Who's the typical renter profile here, and what's been the actual vacancy rate?
- The area grade is low — what's the realistic commute time and amenity access for the typical tenant pool here? Any planned neighborhood developments (good or bad) we should know about?
- What's the average days-on-market for RENTAL listings here right now (not sales)? A rising rental-DOM trend means longer vacancies and softer asking-rent achievability than the comps imply.
- What's the recent tenant-quality profile in this submarket — average credit score on applications, eviction rate, late-payment / NSF rate, and stable-employment percentage? A property-management company in the area should have these aggregated.
- How much new for-sale + rental construction is in the pipeline within 1–3 miles? Heavy new supply typically softens prices + rents 12–24 months out; constrained supply supports both.
Investment metrics
- 1% rule
- 0.73% ✗
- Cap rate
- 4.54%
- Cash-on-cash
- -6.27%
- DSCR
- 0.72
- GRM
- 11.4
CMA / ARV
- ARV (on-the-fly)
- $301,231
- Comps found
- 12
Show comp detail 12 sales within ~0.75 mi
| Address | Dist | Beds/Ba | Sqft | Sold | Price | $/sf | Match |
|---|---|---|---|---|---|---|---|
| 236 Country Crossing Cir | 0.00mi | 3/2.0 | 1,871 (0%) | 1mo | $264,999 | $142 | 99 |
| 158 Piney Pathway | 0.09mi | 3/2.0 | 2,053 (+10%) | 2mo | $283,000 | $138 | 78 |
| 705 Autumn Lake Ln | 0.31mi | 4/2.0 (+1) | 1,920 (+3%) | 1mo | $350,000 | $182 | 76 |
| 309 Cumberland Forest Dr | 0.32mi | 4/2.0 (+1) | 1,788 (-4%) | 2mo | $265,000 | $148 | 72 |
| 307 Bandit Cove Ct | 0.18mi | 4/2.0 (+1) | 1,716 (-8%) | 4mo | $285,990 | $167 | 70 |
| 31814 Oak Xing | 0.50mi | 3/2.0 | 1,790 (-4%) | 1mo | $264,900 | $148 | 69 |
| 311 Bandit Cove Ct | 0.17mi | 4/2.0 (+1) | 1,676 (-10%) | 4mo | $277,990 | $166 | 67 |
| 827 Deerhurst Ln | 0.58mi | 3/2.5 | 1,772 (-5%) | 3mo | $219,900 | $124 | 59 |
| 1047 Brighton Orchards Ln | 0.69mi | 4/2.5 (+1) | 1,826 (-2%) | 2mo | $250,000 | $137 | 55 |
| 706 Umbrella Tree Dr | 0.61mi | 4/2.0 (+1) | 1,607 (-14%) | 0mo | $258,990 | $161 | 42 |
| 514 Southern Magnolia Way | 0.70mi | 4/2.0 (+1) | 1,607 (-14%) | 3mo | $265,990 | $166 | 36 |
| 530 Southern Magnolia Way | 0.73mi | 4/2.0 (+1) | 1,607 (-14%) | 3mo | $263,990 | $164 | 35 |
Match score weights: distance 35% · size 25% · config 20% · recency 20%. Top-matched comps best support the ARV.
Projected returns pro-forma
10.0% appreciation · 0.32% rent growth · sell at horizon
- IRR
- 19.1%
- Equity multiple
- 2.55×
- Total profit
- $114,648
- Equity at exit
- $238,732
- IRR
- 17.1%
- Equity multiple
- 5.69×
- Total profit
- $347,981
- Equity at exit
- $514,835
Cash invested: $74,200 (down + closing). Projections, not guarantees.
Landlord ↔ Tenant lean methodology
- Overall (STATE)
- 87 Strongly Landlord-Friendly
- State Texas
- 87 Strongly Landlord-Friendly · R+5
- County
- — inherits STATE
- City
- — inherits STATE
ZIP-level market 77354
- Home prices YoY
- 2.4%
- Rents YoY
- 0.3%
- Active inventory
- 1622
- Price-to-rent
- 11.4×
Monthly cashflow live
- Estimated rent
- $1,932 high interval (Pro) →
- Mortgage (P&I)
- −$1,390
- Tax from tax record
- −$380 /mo · $4,565/yr
- Insurance
- −$110
- HOA
- −$33
- Vacancy / Maint / Mgmt
- −$406
- Net cashflow
- $-388
Break-even live
Sensitivity live
| Price | -10% $-238 | -5% $-313 | +0% $-388 | +5% $-463 | +10% $-538 |
|---|---|---|---|---|---|
| Rent | -10% $-540 | -5% $-464 | +0% $-388 | +5% $-311 | +10% $-235 |
| Rate | -1.0pp $-254 | -0.5pp $-320 | base $-388 | +0.5pp $-456 | +1.0pp $-526 |
UW: 25.0% down · 7.5% · 30yr · 1.5% tax · 5.0% vac · 8.0% maint · 8.0% mgmt
Financing live
Cash to close
- Down payment
- $66,250
- Closing costs
- $7,950
- Reserves months
- —
- Total cash needed
- —
Loan-product check · same deal, 3 products live
Conventional
25% down · 7.5% · 30yr
- Down + closing
- —
- Monthly P&I
- —
- Monthly cashflow
- —
- DSCR
- —
- Eligible?
- —
Personal DTI + credit; lowest rate.
DSCR
20% down · 8.5% · 30yr
- Down + closing
- —
- Monthly P&I
- —
- Monthly cashflow
- —
- DSCR
- —
- Eligible?
- —
No personal income docs; deal must DSCR.
Hard money
10% down · 12.0% · 12mo
- Down + closing
- —
- Monthly P&I
- —
- Monthly cashflow
- —
- DSCR
- —
- Eligible?
- —
Short-term bridge; refi at stabilization.
Rent comps 12 comps
| Address | Beds | Baths | Sqft | Rent | $/sqft | DOM | Units | Dist |
|---|---|---|---|---|---|---|---|---|
| 139 Piney Pathway Magnolia, TX | 4.0 | 2.0 | 2332 | $1,971 | $0.85 | 26d | 1 | 0.08mi |
| 134 Piney Pathway Magnolia, TX | 3.0 | 2.0 | 2329 | $1,966 | $0.84 | 0d | 1 | 0.10mi |
| 297 Country Crossing Cir Magnolia, TX | 3.0 | 2.0 | 1806 | $1,731 | $0.96 | 0d | 1 | 0.11mi |
| 359 Cumberland Forest Dr Magnolia, TX | 4.0 | 2.0 | 1459 | $1,725 | $1.18 | 26d | 1 | 0.43mi |
| 273 Douglas Hills Dr Magnolia, TX | 4.0 | 3.0 | 1922 | $1,895 | $0.99 | 45d | 1 | 0.49mi |
| 202 Alder Laurels Cv Magnolia, TX | 4.0 | 2.5 | 2229 | $2,036 | $0.91 | 24d | 1 | 0.51mi |
| 764 Autumn Cherry Trl Magnolia, TX | 4.0 | 3.0 | 2196 | $1,665 | $0.76 | 45d | 1 | 0.51mi |
| 408 Cumberland Forest Dr Magnolia, TX | 3.0 | 2.0 | 1402 | $1,795 | $1.28 | 45d | 1 | 0.53mi |
| 423 Jewett Meadow Dr Magnolia, TX | 3.0 | 2.0 | 1311 | $1,781 | $1.36 | 24d | 1 | 0.55mi |
| 937 Gentle Moss Dr Magnolia, TX | 3.0 | 2.0 | 1252 | $1,635 | $1.31 | 7d | 1 | 0.75mi |
| 948 Oak Mist Ln Magnolia, TX | 3.0 | 2.0 | 1470 | $2,000 | $1.36 | 26d | 1 | 0.92mi |
| 30906 Sweetwater Cir Magnolia, TX | 4.0 | 2.5 | 2154 | $1,949 | $0.90 | 24d | 1 | 1.45mi |
HOA detail
- Monthly dues
- $33 · $396/yr
- Likely covers
- gas
Listing history 8 events
-
2026-05-09status Pending
-
2026-05-01status Pending
-
2026-04-20price $264,999
-
2026-03-19$275,000 Active
-
2016-09-26historical
-
2016-09-11price $189,900
-
2016-08-19price $194,900
-
2016-07-09$199,900 Active
ⓘ Source: listings_history table (triggers on properties + properties_extension) + one-shot
backfill from property_details.listing_events for pre-trigger history.
Tax reassessment forecast TX · Resets to sale price
- Current annual tax
- $4,565 · $380/mo
- Projected year-2 tax
- $4,849 · $404/mo
- Expected delta
- +$284/yr (+$24/mo · 6.2%)
ⓘ Screening estimate from a state-policy table — verify with the county assessor before closing.
Climate risk First Street
- Flood 1/10 Low FEMA zone X (unshaded) · 0% chance over 30 yrs
- Wildfire 3/10 Moderate
- Heat 8/10 Severe 7 d/yr ≥111°F today · 23 d/yr by 30 yrs out
- Wind 8/10 Severe 99% chance of damaging wind over 30 yrs
- Air quality 2/10 Low 2 unhealthy d/yr today · 2 by 30 yrs out
Nearby sold comps map
Loading sold comps map…
Walkable amenities ~0.75 mi
Loading nearby amenities…
Taxation est. · year 1
- Rental income
- $23,179
- − Mortgage interest
- −$14,844
- − Property taxes
- −$4,565
- − Insurance
- −$1,325
- − Repairs & maintenance
- −$1,854
- − Management
- −$1,854
- − HOA
- −$396
- − Depreciation
- −$7,709
- Taxable loss
- −$9,369
- Est. tax savings @ 24.0%
- +$2,249
- After-tax cash flow
- $-2,402/yr
For passive investors: Depreciation is non-cash, so a rental often shows a tax loss while cash-flowing — sheltering income. Rental losses are passive: they offset passive income freely, and up to $25,000/yr can offset ordinary (W-2) income if you actively participate and your MAGI is under $100k (phasing out to $0 by $150k); unused losses carry forward. On sale, claimed depreciation is recaptured at up to 25%, and gains may owe capital-gains tax (a 1031 exchange can defer both). Figures are a year-1 estimate at your 24.0% rate — not tax advice; consult a CPA.
Schools (NCES district)
- District
- Magnolia ISD
- NCES district ID
- 4828740
- Math proficiency
- 42% ▼ -7.00%
- Reading proficiency
- 45% ▼ -4.00%
- Median HH income
- $71,692
- Composite
- 39.46/100
- National rank
- #3958
- State rank
- #247 of 826 in TX
Livability — Magnolia
- Score
- 73/100
- State rank
- #222
- US rank
- #5442
Category grades
Schools grade is shown separately in the Schools card above.
Census & demographics
- Census place
- Magnolia, TX
- County
- Montgomery County · 663,713 people
- City population
- 32,847
- Metro
- Houston-The Woodlands-Sugar Land, TX
- Population (ZIP)
- 44,900
- Household income
- $112,504
- Rent vs Own
- Severe rent burden
- 586.0
Population outlook (Montgomery County) Hauer SSP2
- Today (2025)
- 713,896 people
- By 2030
- 805,263 · +12.8%
- By 2040
- 992,708 · +39.1%
- By 2050
- 1,179,590 · +65.2%
- By 2075
- 1,628,084 · +128.1%
- By 2100
- 1,937,880 · +171.5%
Race, ethnicity, and origin ACS 2023
- Neighborhood character
- Predominantly White (66%)
- Race & ethnicity
- White 66% Hispanic / Latino 25% Two or more races 18% Black 3% Asian 1%
- Hispanic origin (detail)
- Mexican 14% Puerto Rican 1%
- Common ancestry
- Lithuanian 4% Slovak 2% Italian 2%
- Foreign-born
- 11% · Canada, Vietnam
- Languages at home
- 83% English-only · Spanish 15% Other Indo-European 1% German/W. Germanic 1%
Political lean MEDSL · Montgomery
- 2024 margin
- Solid R (+45.5) · D 26.8% · R 72.3%
- 2008→2024 swing
- +7.2pp toward D · 2008: -52.7pp · 2024: -45.5pp
- All cycles
- 2024: R+45.5 2020: R+43.8 2016: R+51.4 2012: R+60.7 2008: R+52.7
Not yet ingested
- Civics
- —
Market trends
- HPI YoY
- ▲ 12.09%
- Current HPI
- 512.87
- Rent YoY
- ▲ 0.32%
- Metro
- Houston-The Woodlands-Sugar Land, TX
- State GDP YoY
- ▲ 3.95%
- F500 in state
- 110
Industry mix (Fortune 500 HQ in TX)
| Industry | F500 HQs | Revenue |
|---|---|---|
| Energy | 16 | $1,198B |
|
||
| Technology | 5 | $198B |
|
||
| Engineering / Construction | 4 | $72B |
|
||
| Energy Services | 3 | $60B |
|
||
| Utilities | 3 | $41B |
|
||
| Healthcare | 2 | $330B |
|
||
Price history
+32.6% since first listed8 events — show timeline
- 2026-05-09 Pending — HARMLS
- 2026-05-01 Pending — HARMLS
- 2026-04-20 Price Changed $264,999 HARMLS
- 2026-03-19 Listed $275,000 HARMLS
- 2016-09-26 Listing Removed — HARMLS
- 2016-09-11 Price Changed $189,900 HARMLS
- 2016-08-19 Price Changed $194,900 HARMLS
- 2016-07-09 Listed $199,900 HARMLS
Property tax history
+18.7%/yrLatest (2025): $4,565 · -13.1% YoY. Source: county tax records.
Cash-flow waterfall
monthlySold comps — $/sqft
last 12 mo · ≤1 miLoading sold comps…