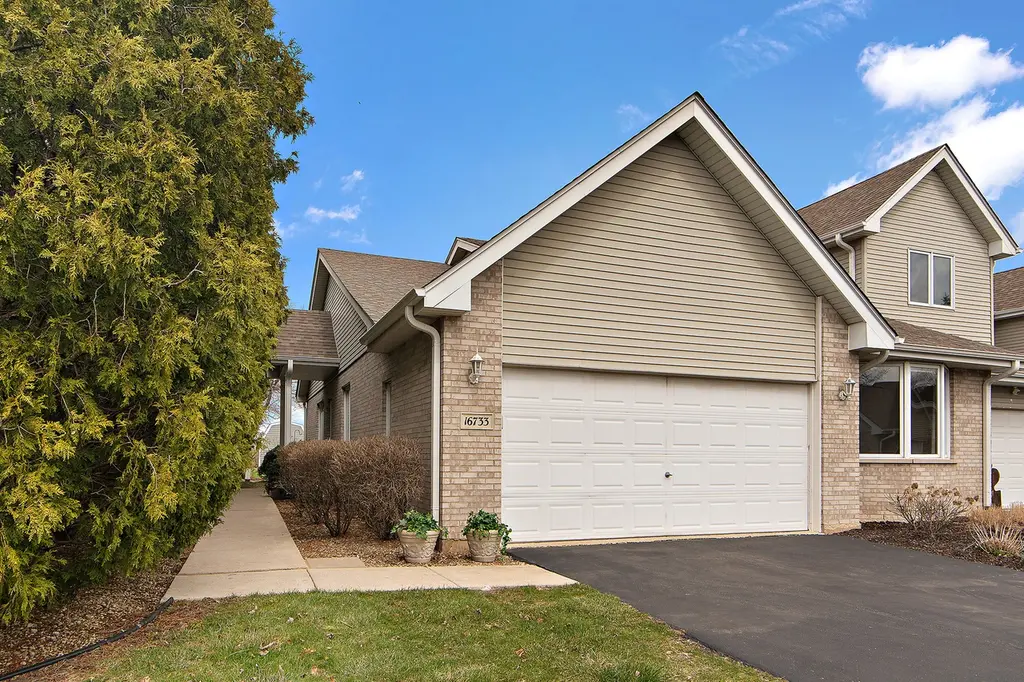
16733 Summercrest Ave · Orland Park, IL
Flood risk 1/10 · Minimal
- FEMA flood zone
- X (unshaded)
- Chance of flooding over 30 yrs
- 0.0%
- Est. flood insurance / yr
- $473 – $860
Fire risk 1/10 · Minimal
- Est. fire insurance / yr
- $804 – $1,492
Heat risk 3/10 · Minor
- Hot days now (above 102°F)
- 7 days/yr
- Hot days in 30 yrs
- 15 days/yr
Wind risk 2/10 · Minimal
- Chance of severe wind over 30 yrs
- 1.0%
Air-quality risk 2/10 · Minimal
- Unhealthy air days now
- 1 days/yr
- Unhealthy air days in 30 yrs
- 1 days/yr
Risk factors via First Street. Map © Google.
Why this score? — see what drove the D grade
The composite is a weighted blend of 9 inputs, each scored 0–100. Each bar is that input's sub-score; the figure is the points it added to the 100-point composite (weight × sub-score).
- Cash flow +18.2/30.0
- DSCR +5.7/10.0
- 1% rule +4.4/10.0
- Livability +4.2/5.0
- ARV discount +3.4/15.0
- Schools +3.4/10.0
- Rent growth +2.5/5.0
- Condition / age +2.5/5.0
- Appreciation +0.0/10.0
$389,900
🖨 Deal sheet 📄 Offer letter ✓ Due diligence
Listing remarks
If you are looking for one level living in and END unit with lots of privacy and nice views, then this is the property for you! New appliances, carpeting and air conditioning. Furnace is approximately 3 years old roof 2017, new gutters and 4" downspouts in 2023/2024. In 2025 the entire driveway was done. Freshly painted as well. With a north facing deck that provides a stunning view of nature at its best! This unit offers a bright, clean, versatile floor plan designed to fit your lifestyle. The spacious eat in kitchen provides ample room for casual dining, while the flexible adjacent space can easily serve as a formal dining area or additional entertaining space. Beautifully maintain
Key facts
- New gutters
- North facing deck
- New appliances
Tags
Property features AI
Finance
- Other: Directions: Will Cook Road to 167th Street East to Grasslands Entrance; Parcel number available
- Financial info:
- HOA & community: Monthly association fee of $180; Association covers insurance, lawn care, and snow removal; Pets allowed (cats and dogs)
Exterior
- Parking: Attached garage with garage door opener; Asphalt parking; Two garage spaces (two total parking spaces)
- Security:
- Utilities: Water source: Lake Michigan; Public sewer
- Home design: Attached single (townhouse-ranch); Entry level: 1; Fee simple ownership with homeowners association; Approximately 26–30 years old
- Construction: Aluminum siding; Asphalt roof; Concrete perimeter foundation; Building contains 4 units
- Exterior features: Deck
Interior
- Kitchen: Kitchen with eating area/table space (10 x 13); Range; Microwave; Dishwasher
- Bedrooms: Master bedroom on main level (17 x 12) with full bath access; Second bedroom on main level (10 x 12); Third and fourth bedrooms (levels not specified)
- Flooring: Carpet in dining room and living room
- Bathrooms: Two full baths
- Heating & cooling: Natural gas forced-air heating; Central air conditioning
- Interior features: Five total rooms; Unfinished full basement; Double-sided fireplace in the living room
- Laundry & utility: In-unit laundry; Washer; Dryer
Neighborhood map
What this means for you Summary
Snapshot
- This is a 2-bed/2.5-bath townhouse listed at $390k.
Deal economics
- At list price, monthly cash flow is $352 ($4k/yr) — positive.
- The deal already cash-flows at list — no discount required.
- To meet the 1% rule (rent ≥ 1% of price), the offer needs to be $365k (6.4% below list).
- Recommended offer: $365k (6.4% below list) — sets the bar for 1% rule.
- Cap rate 7.4% vs local median 4.3% in Orland Park — top-decile yield for the area; either an underpriced asset or a hidden risk that comps aren't pricing in. Stress-test before assuming the spread holds.
Location & tenants
- Location reads 85/100 on livability (#29 in IL, #529 nationally) — a professional / high-income tenant draw. Strengths: crime A+, amenities A+, commute A+.
- Cons Hsd 230 (suburban): math 35% / reading 39% proficiency, ranked #146 of 620 in IL (top 24%) — families likely to look elsewhere, expect single-tenant / working-renter base with shorter leases.
- Market conditions: 119 active listings in the ZIP; 2 comparable units currently listed for rent nearby; 6,272 units permitted in Cook County in 2024 (4,658 in 5+ unit buildings).
Forward outlook
- Local home prices are declining (-3.0%/yr); year-one equity from $3k of loan paydown is wiped out by about $12k of value loss. Plan a longer hold.
Negotiation context
- It's been on market 17 days — a 2% lower offer ($384k) is reasonable based on typical stale-listing flexibility.
Questions for the listing agent
- What does the HOA fee cover, when was the last increase, and are there any pending special assessments or reserve-fund shortfalls?
- Is there a deadline driving the sale (1031 exchange, divorce, estate, relocation)? That informs how much negotiation room exists.
- The area grade is low — what's the realistic commute time and amenity access for the typical tenant pool here? Any planned neighborhood developments (good or bad) we should know about?
- What's the average days-on-market for RENTAL listings here right now (not sales)? A rising rental-DOM trend means longer vacancies and softer asking-rent achievability than the comps imply.
- What's the recent tenant-quality profile in this submarket — average credit score on applications, eviction rate, late-payment / NSF rate, and stable-employment percentage? A property-management company in the area should have these aggregated.
- How much new for-sale + rental construction is in the pipeline within 1–3 miles? Heavy new supply typically softens prices + rents 12–24 months out; constrained supply supports both.
Investment metrics
- 1% rule
- 0.94% ✗
- Cap rate
- 7.38%
- Cash-on-cash
- 3.87%
- DSCR
- 1.17
- GRM
- 8.9
CMA / ARV
- ARV (on-the-fly)
- $357,304
- Comps found
- 12
Show comp detail 12 sales within ~0.75 mi
| Address | Dist | Beds/Ba | Sqft | Sold | Price | $/sf | Match |
|---|---|---|---|---|---|---|---|
| 11138 Aquinas Ct | 0.51mi | 3/2.5 (+1) | 1,406 (-7%) | 1mo | $333,000 | $237 | 59 |
| 11424 Lakebrook Ct | 0.66mi | 2/2.5 | 1,456 (-4%) | 7mo | $363,000 | $249 | 57 |
| 10937 Saffron Ct | 0.56mi | 3/3.0 (+1) | 1,549 (+2%) | 9mo | $349,000 | $225 | 56 |
| 10935 Barbs Way | 0.56mi | 3/3.0 (+1) | 1,486 (-2%) | 11mo | $390,000 | $262 | 55 |
| 11244 Lakefield Dr | 0.54mi | 2/2.5 | 1,428 (-6%) | 13mo | $310,000 | $217 | 54 |
| 17273 Lakebrook Dr | 0.68mi | 2/2.5 | 1,428 (-6%) | 5mo | $302,000 | $211 | 54 |
| 17330 Lakebrook Dr | 0.74mi | 3/2.5 (+1) | 1,456 (-4%) | 2mo | $350,000 | $240 | 53 |
| 16712 Sheridans Trl | 0.70mi | 2/3.0 | 1,528 (+1%) | 21mo | $360,000 | $236 | 46 |
| 17238 Lakebrook Dr | 0.62mi | 2/2.5 | 1,428 (-6%) | 19mo | $330,000 | $231 | 46 |
| 11132 Aquinas Ct | 0.51mi | 2/1.5 | 1,406 (-7%) | 20mo | $334,000 | $238 | 44 |
| 17265 Lakebrook Dr | 0.68mi | 2/2.5 | 1,604 (+6%) | 19mo | $329,000 | $205 | 42 |
| 11104 Karen Dr | 0.71mi | 2/2.0 | 1,717 (+13%) | 11mo | $355,000 | $207 | 33 |
Match score weights: distance 35% · size 25% · config 20% · recency 20%. Top-matched comps best support the ARV.
Projected returns pro-forma
-3.0% appreciation · 3.0% rent growth · sell at horizon
- IRR
- -10.3%
- Equity multiple
- 0.63×
- Total profit
- $-40,814
- Equity at exit
- $58,135
- IRR
- -0.9%
- Equity multiple
- 0.94×
- Total profit
- $-6,868
- Equity at exit
- $33,711
Cash invested: $109,172 (down + closing). Projections, not guarantees.
Landlord ↔ Tenant lean methodology
- Overall (STATE)
- 43 Moderately Tenant-Leaning
- State Illinois
- 43 Moderately Tenant-Leaning · D+7
- County
- — inherits STATE
- City
- — inherits STATE
ZIP-level market 60467
- Home prices YoY
- -30.4%
- Active inventory
- 119
- Price-to-rent
- 8.9×
Monthly cashflow live
- Estimated rent
- $3,648 medium interval (Pro) →
- Mortgage (P&I)
- −$2,045
- Tax from tax record
- −$143 /mo · $1,717/yr
- Insurance
- −$162
- HOA
- −$180
- Vacancy / Maint / Mgmt
- −$766
- Net cashflow
- $352
Break-even live
UW: 25.0% down · 7.5% · 30yr · 1.5% tax · 5.0% vac · 8.0% maint · 8.0% mgmt
Financing live
Cash to close
- Down payment
- $97,475
- Closing costs
- $11,697
- Reserves months
- —
- Total cash needed
- —
Loan-product check · same deal, 3 products live
Conventional
25% down · 7.5% · 30yr
- Down + closing
- —
- Monthly P&I
- —
- Monthly cashflow
- —
- DSCR
- —
- Eligible?
- —
Personal DTI + credit; lowest rate.
DSCR
20% down · 8.5% · 30yr
- Down + closing
- —
- Monthly P&I
- —
- Monthly cashflow
- —
- DSCR
- —
- Eligible?
- —
No personal income docs; deal must DSCR.
Hard money
10% down · 12.0% · 12mo
- Down + closing
- —
- Monthly P&I
- —
- Monthly cashflow
- —
- DSCR
- —
- Eligible?
- —
Short-term bridge; refi at stabilization.
Rent comps 2 comps
| Address | Beds | Baths | Sqft | Rent | $/sqft | DOM | Units | Dist |
|---|---|---|---|---|---|---|---|---|
| 16527 Orange Ave Orland Park, IL | 3.0 | 3.5 | 1870 | $3,800 | $2.03 | 3d | 1 | 0.42mi |
| 11251 158th St Orland Park, IL | 3.0 | 2.5 | 1175 | $3,200 | $2.72 | 1d | 1 | 1.20mi |
HOA detail
- Monthly dues
- $180 · $2,160/yr
Listing history 15 events
-
2026-06-18days on market $389,900 Active 17 DOM
-
2026-06-17days on market $389,900 Active 16 DOM
-
2026-06-16days on market $389,900 Active 15 DOM
-
2026-06-15days on market $389,900 Active 14 DOM
-
2026-06-13days on market $389,900 Active 12 DOM
-
2026-06-09days on market $389,900 Active 8 DOM
-
2026-06-08days on market $389,900 Active 7 DOM
-
2026-06-07days on market $389,900 Active 6 DOM
-
2026-06-04days on market $389,900 Active 3 DOM
-
2026-06-03days on market $389,900 Active 2 DOM
-
2026-06-02pricedays on market $389,900 Active 1 DOM
-
2026-06-01days on market $399,999 Active 52 DOM
-
2026-05-31days on market $399,999 Active 51 DOM
-
2026-04-10historical
-
2026-04-10$399,999 Active
ⓘ Source: listings_history table (triggers on properties + properties_extension) + one-shot
backfill from property_details.listing_events for pre-trigger history.
Tax reassessment forecast IL · Partial reset (capped growth)
- Current annual tax
- $1,717 · $143/mo
- Projected year-2 tax
- $5,284 · $440/mo
- Expected delta
- +$3,567/yr (+$297/mo · 207.8%)
ⓘ Screening estimate from a state-policy table — verify with the county assessor before closing.
Climate risk First Street
- Flood 1/10 Low FEMA zone X (unshaded) · 0% chance over 30 yrs
- Wildfire 1/10 Low
- Heat 3/10 Moderate 7 d/yr ≥102°F today · 15 d/yr by 30 yrs out
- Wind 2/10 Low 100% chance of damaging wind over 30 yrs
- Air quality 2/10 Low 1 unhealthy d/yr today · 1 by 30 yrs out
Nearby sold comps map
Loading sold comps map…
Walkable amenities ~0.75 mi
Loading nearby amenities…
Taxation est. · year 1
- Rental income
- $43,779
- − Mortgage interest
- −$21,840
- − Property taxes
- −$1,717
- − Insurance
- −$1,950
- − Repairs & maintenance
- −$3,502
- − Management
- −$3,502
- − HOA
- −$2,160
- − Depreciation
- −$11,343
- Taxable loss
- −$2,235
- Est. tax savings @ 24.0%
- +$536
- After-tax cash flow
- $4,759/yr
For passive investors: Depreciation is non-cash, so a rental often shows a tax loss while cash-flowing — sheltering income. Rental losses are passive: they offset passive income freely, and up to $25,000/yr can offset ordinary (W-2) income if you actively participate and your MAGI is under $100k (phasing out to $0 by $150k); unused losses carry forward. On sale, claimed depreciation is recaptured at up to 25%, and gains may owe capital-gains tax (a 1031 exchange can defer both). Figures are a year-1 estimate at your 24.0% rate — not tax advice; consult a CPA.
Schools (NCES district)
- District
- Cons Hsd 230
- NCES district ID
- 1708400
- Math proficiency
- 35% ▼ -8.00%
- Reading proficiency
- 39% ▼ -6.00%
- Median HH income
- $73,953
- Composite
- 34.29/100
- National rank
- #5244
- State rank
- #146 of 620 in IL
Livability — Orland Park
- Score
- 85/100
- State rank
- #29
- US rank
- #529
Category grades
Schools grade is shown separately in the Schools card above.
Census & demographics
- Census place
- Orland Park, IL
- City population
- 41,456
- Population (ZIP)
- 24,952
Population outlook (Cook County) Hauer SSP2
- Today (2025)
- 5,347,519 people
- By 2030
- 5,357,703 · +0.2%
- By 2040
- 5,324,924 · -0.4%
- By 2050
- 5,230,762 · -2.2%
- By 2075
- 4,785,735 · -10.5%
- By 2100
- 4,188,836 · -21.7%
Race, ethnicity, and origin ACS 2023
- Neighborhood character
- Predominantly White (83%)
- Race & ethnicity
- White 83% Hispanic / Latino 6% Asian 5% Two or more races 4% Black 4%
- Hispanic origin (detail)
- Mexican 5%
- Common ancestry
- Romanian 15% Armenian 2% Iranian 2%
- Foreign-born
- 14% · Canada, South Korea, China
- Languages at home
- 78% English-only · Arabic 9% Russian/Polish/Slavic 4% Other Indo-European 4%
Political lean MEDSL · Cook
- 2024 margin
- Solid D (+42.0) · D 70.4% · R 28.4% · Other 1.2%
- 2008→2024 swing
- -11.4pp toward R · 2008: 53.4pp · 2024: 42.0pp
- All cycles
- 2024: D+42.0 2020: D+50.3 2016: D+53.0 2012: D+49.4 2008: D+53.4
Not yet ingested
- Civics
- —
Market trends
- HPI YoY
- ▼ -82.13%
- Current HPI
- 188.3676
- Rent YoY
- —
- Metro
- —
- State GDP YoY
- ▲ 1.59%
- F500 in state
- 60
Industry mix (Fortune 500 HQ in IL)
| Industry | F500 HQs | Revenue |
|---|---|---|
| Insurance | 4 | $201B |
|
||
| Consumer Goods | 4 | $87B |
|
||
| Industrial Machinery | 3 | $64B |
|
||
| Healthcare | 2 | $55B |
|
||
| Retail / Pharmacy | 1 | $148B |
|
||
| Agriculture / Food | 1 | $86B |
|
||
Price history
2 events — show timeline
- 2026-04-10 Listed $399,999 MRED as Distributed by MLS Grid
- 2026-04-10 Listing Removed — MRED as Distributed by MLS Grid
Property tax history
-5.2%/yrLatest (2023): $1,717 · -19.0% YoY. Source: county tax records.
Cash-flow waterfall
monthlySold comps — $/sqft
last 12 mo · ≤1 miLoading sold comps…