 Duplex
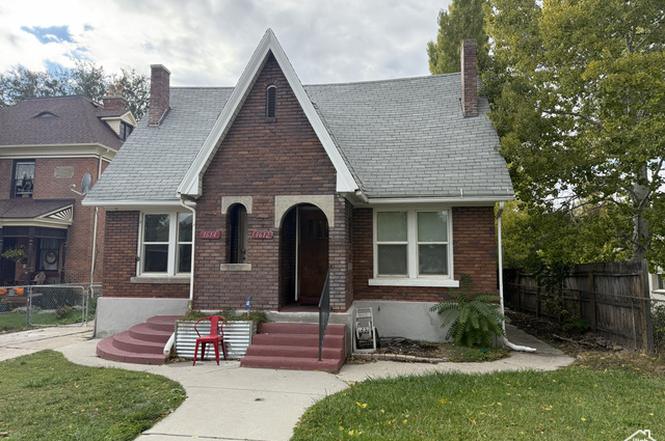
1612 S 500 E · Salt Lake City, UT
Flood risk 2/10 · Minimal
- FEMA flood zone
- X (unshaded)
- Chance of flooding over 30 yrs
- 0.09%
- Est. flood insurance / yr
- $473 – $860
Fire risk 1/10 · Minimal
- Est. fire insurance / yr
- $453 – $841
Heat risk 4/10 · Minor
- Hot days now (above 94°F)
- 7 days/yr
- Hot days in 30 yrs
- 19 days/yr
Wind risk 1/10 · Minimal
- Chance of severe wind over 30 yrs
- —
Air-quality risk 4/10 · Minor
- Unhealthy air days now
- 5 days/yr
- Unhealthy air days in 30 yrs
- 6 days/yr
Risk factors via First Street. Map © Google.
Why this score? — see what drove the D grade
The composite is a weighted blend of 9 inputs, each scored 0–100. Each bar is that input's sub-score; the figure is the points it added to the 100-point composite (weight × sub-score).
- Cash flow +14.6/30.0
- ARV discount +7.5/15.0
- DSCR +4.5/10.0
- Livability +3.8/5.0
- Rent growth +3.5/5.0
- 1% rule +3.0/10.0
- Schools +2.9/10.0
- Condition / age +2.5/5.0
- Appreciation +0.0/10.0
$724,900
🖨 Deal sheet 📄 Offer letter ✓ Due diligence
Multi-family units
County records classify this as Multi-Family (2-4 Unit). Listing-text estimate: 2 units. confirmed
Listing remarks
Fantastic updated duplex. South unit is vacant and available to show. North unit is rented month to month. Large lot in back, ADU may be possible, or other future development. Great for possible owner occupant or solid income property. Property sold As-is.
Key facts
- Adu may be possible
- Updated duplex
- Large lot
Tags
Neighborhood map
What this means for you Summary
Snapshot
- This is a 2 × 4-bed/2.0-bath units multifamily listed at $725k.
Deal economics
- At list price, monthly cash flow is $174 ($2k/yr) — positive. Per door: $87/mo.
- The deal already cash-flows at list — no discount required.
- To meet the 1% rule (rent ≥ 1% of price), the offer needs to be $579k (20.2% below list).
- Recommended offer: $579k (20.2% below list) — sets the bar for 1% rule.
Location & tenants
- Location reads 75/100 on livability (#64 in UT, #3,994 nationally) — a middle-class / working-renter tenant base. Strengths: amenities A+, commute A+, housing A; Watch: cost of living D+, crime F.
- Salt Lake District (urban): math 30% / reading 37% proficiency, ranked #65 of 80 in UT (top 81%) — families likely to look elsewhere, expect single-tenant / working-renter base with shorter leases.
- Zoned schools: Hawthorne School (math 63% / reading 66%, grade B, #23 of 585 statewide, top 4%, 362 students, 22% FRL); Hillside Middle (math 44% / reading 46%, grade D, #43 of 138 statewide, top 33%, 555 students, 29% FRL); Highland High (math 21% / reading 54%, grade F, #76 of 171 statewide, top 45%, 1,980 students, 30% FRL) — zoned schools average 27% FRL vs 57% district-wide (30 pts lower); this property's tenant base skews higher-income than the district average.
- Zoned-school proficiency averages 49% at this address vs 34% district-wide (+16 pts) — the actual schools serving this property are materially stronger than the Salt Lake District average implies; a family-tenant draw the district grade alone would hide.
- Market conditions: Rents rising (+3.9%/yr); 98 active listings in the ZIP; solid renter incomes; 4,970 units permitted in Salt Lake County in 2024 (1,963 in 5+ unit buildings).
- At $5,787/mo this rent would consume 70% of the median local household income ($100k/yr) (locally 873% of renters already pay >50% of income on rent) — very limited rent-growth headroom before tenants either downsize or default.
Forward outlook
- Local home prices are declining (-3.0%/yr); year-one equity from $5k of loan paydown is wiped out by about $22k of value loss. Plan a longer hold.
- Salt Lake County population projected at +37% by 2050 — long-run rental-demand tailwind backs the buy-and-hold thesis.
Negotiation context
- It's been on market 121 days — a 12% lower offer ($638k) is reasonable based on typical stale-listing flexibility.
- 8 sale attempts since 20y ago with the ask held roughly flat each time — persistent listings suggest the price (not the market) is what's stuck; bring a comps-based counter.
Risks & watch-outs
- Watch-outs: built in 1929 — expect roof / HVAC / electrical / plumbing capex.
Questions for the listing agent
- It's been on market 121 days. Have you received any prior offers? Is the seller open to a 20% concession, seller financing, or rate buy-down credit?
- Can we see the unit-by-unit rent roll, current vacancy, and any below-market leases? What's the average tenancy length?
- What capital expenditures (roof, boiler, parking lot, exteriors) have been made in the last 5 years, and what's planned in the next 2?
- Built in 1929 — when were the roof, HVAC, electrical panel, plumbing, and water heater last replaced?
- Why hasn't it sold? Are there any deal-killer items the seller is aware of (foundation, flood, title, zoning, code violations)?
- Is there a deadline driving the sale (1031 exchange, divorce, estate, relocation)? That informs how much negotiation room exists.
- Crime grade is F in this area — have there been break-ins, vandalism, or insurance claims at this property in the last 3 years? What carrier currently insures it and at what premium?
- The area grade is low — what's the realistic commute time and amenity access for the typical tenant pool here? Any planned neighborhood developments (good or bad) we should know about?
- What's the average days-on-market for RENTAL listings here right now (not sales)? A rising rental-DOM trend means longer vacancies and softer asking-rent achievability than the comps imply.
- What's the recent tenant-quality profile in this submarket — average credit score on applications, eviction rate, late-payment / NSF rate, and stable-employment percentage? A property-management company in the area should have these aggregated.
- How much new apartment / multifamily construction is in the pipeline within 1–3 miles? Heavy new supply (>2% of stock underway) typically softens rents 12–24 months out; light construction supports rent growth.
Investment metrics
- 1% rule
- 0.80% ✗
- Cap rate
- 6.58%
- Cash-on-cash
- 1.03%
- DSCR
- 1.05
- GRM
- 10.4
CMA / ARV
No comps found within radius.
Projected returns pro-forma
-3.0% appreciation · 3.93% rent growth · sell at horizon
- IRR
- -13.8%
- Equity multiple
- 0.50×
- Total profit
- $-101,191
- Equity at exit
- $108,085
- IRR
- -3.7%
- Equity multiple
- 0.74×
- Total profit
- $-52,145
- Equity at exit
- $62,676
Cash invested: $202,972 (down + closing). Projections, not guarantees.
Landlord ↔ Tenant lean methodology
- Overall (STATE)
- 86 Strongly Landlord-Friendly
- State Utah
- 86 Strongly Landlord-Friendly · R+15
- County
- — inherits STATE
- City
- — inherits STATE
ZIP-level market 84105
- Rents YoY
- 3.9%
- Active inventory
- 98
- Price-to-rent
- 20.9×
Monthly cashflow live
- Estimated rent
- $5,787 high interval (Pro) →
- Mortgage (P&I)
- −$3,801
- Tax from tax record
- −$294 /mo · $3,528/yr
- Insurance
- −$302
- HOA
- −$0
- Vacancy / Maint / Mgmt
- −$1,215
- Net cashflow
- $174
Break-even live
2-unit breakdown (identical units grouped — click to expand)
| Units | Beds | Baths | Est. rent |
|---|---|---|---|
| 2× units | 4 | 2 | $5,788 |
| #1 | 4 | 2 | $2,894 |
| #2 | 4 | 2 | $2,894 |
| Total (2 units) | $5,787 | ||
UW: 25.0% down · 7.5% · 30yr · 1.5% tax · 5.0% vac · 8.0% maint · 8.0% mgmt
Financing live
Cash to close
- Down payment
- $181,225
- Closing costs
- $21,747
- Reserves months
- —
- Total cash needed
- —
Loan-product check · same deal, 3 products live
Conventional
25% down · 7.5% · 30yr
- Down + closing
- —
- Monthly P&I
- —
- Monthly cashflow
- —
- DSCR
- —
- Eligible?
- —
Personal DTI + credit; lowest rate.
DSCR
20% down · 8.5% · 30yr
- Down + closing
- —
- Monthly P&I
- —
- Monthly cashflow
- —
- DSCR
- —
- Eligible?
- —
No personal income docs; deal must DSCR.
Hard money
10% down · 12.0% · 12mo
- Down + closing
- —
- Monthly P&I
- —
- Monthly cashflow
- —
- DSCR
- —
- Eligible?
- —
Short-term bridge; refi at stabilization.
Listing history 24 events
-
2026-02-17status Under Contract
-
2025-10-31price $724,900
-
2025-10-19$749,900 Active
-
2025-08-18historical
-
2025-06-25$769,500 Active
-
2024-09-06historical
-
2024-08-09price $724,500
-
2024-08-02price $769,500
-
2024-07-16price $789,500
-
2024-07-14$589,500 Active
-
2020-10-02soldstatus
-
2013-12-09soldstatus
-
2013-12-06soldstatus
-
2013-06-07$275,000
-
2007-11-19historical
-
2007-06-29$319,900
-
2006-09-14soldstatus
-
2006-09-14soldstatus
-
2006-06-22historical
-
2006-06-22$269,000
-
2006-06-14$295,000
-
2006-02-27soldstatus
-
2006-02-08soldstatus
-
2006-01-09$245,500
ⓘ Source: listings_history table (triggers on properties + properties_extension) + one-shot
backfill from property_details.listing_events for pre-trigger history.
Tax reassessment forecast UT · Resets to sale price
- Current annual tax
- $3,528 · $294/mo
- Projected year-2 tax
- $4,784 · $399/mo
- Expected delta
- +$1,256/yr (+$105/mo · 35.6%)
ⓘ Screening estimate from a state-policy table — verify with the county assessor before closing.
Climate risk First Street
- Flood 2/10 Low FEMA zone X (unshaded) · 9% chance over 30 yrs
- Wildfire 1/10 Low
- Heat 4/10 Moderate 7 d/yr ≥94°F today · 19 d/yr by 30 yrs out
- Wind 1/10 Low
- Air quality 4/10 Moderate 5 unhealthy d/yr today · 6 by 30 yrs out
Nearby sold comps map
Loading sold comps map…
Walkable amenities ~0.75 mi
Loading nearby amenities…
Taxation est. · year 1
- Rental income
- $69,444
- − Mortgage interest
- −$40,606
- − Property taxes
- −$3,528
- − Insurance
- −$3,624
- − Repairs & maintenance
- −$5,556
- − Management
- −$5,556
- − Depreciation
- −$21,088
- Taxable loss
- −$10,513
- Est. tax savings @ 24.0%
- +$2,523
- After-tax cash flow
- $4,614/yr
For passive investors: Depreciation is non-cash, so a rental often shows a tax loss while cash-flowing — sheltering income. Rental losses are passive: they offset passive income freely, and up to $25,000/yr can offset ordinary (W-2) income if you actively participate and your MAGI is under $100k (phasing out to $0 by $150k); unused losses carry forward. On sale, claimed depreciation is recaptured at up to 25%, and gains may owe capital-gains tax (a 1031 exchange can defer both). Figures are a year-1 estimate at your 24.0% rate — not tax advice; consult a CPA.
Schools (NCES district)
- District
- Salt Lake District
- NCES district ID
- 4900870
- Math proficiency
- 30% ▼ -13.00%
- Reading proficiency
- 37% ▼ -6.00%
- Median HH income
- $47,550
- Composite
- 28.85/100
- National rank
- #6645
- State rank
- #65 of 80 in UT
Livability — Salt Lake City
- Score
- 75/100
- State rank
- #64
- US rank
- #3994
Category grades
Schools grade is shown separately in the Schools card above.
Census & demographics
- Census place
- Salt Lake City, UT
- County
- Salt Lake County · 1,195,750 people
- City population
- 172,615
- Metro
- Salt Lake City, UT
- Population (ZIP)
- 23,491
- Household income
- $99,562
- Rent vs Own
- Severe rent burden
- 873.0
Population outlook (Salt Lake County) Hauer SSP2
- Today (2025)
- 1,305,860 people
- By 2030
- 1,402,611 · +7.4%
- By 2040
- 1,594,533 · +22.1%
- By 2050
- 1,787,244 · +36.9%
- By 2075
- 2,224,138 · +70.3%
- By 2100
- 2,551,390 · +95.4%
Race, ethnicity, and origin ACS 2023
- Neighborhood character
- Predominantly White (81%)
- Race & ethnicity
- White 81% Two or more races 8% Hispanic / Latino 8% Asian 3% Black 2%
- Hispanic origin (detail)
- Mexican 4%
- Common ancestry
- Slovak 5% Italian 4% Portuguese 3%
- Foreign-born
- 8% · Canada, Dominican Republic, Jamaica
- Languages at home
- 89% English-only · Spanish 3% Other Indo-European 2% German/W. Germanic 1%
Political lean MEDSL · Salt Lake
- 2024 margin
- D (+10.2) · D 53.7% · R 43.5% · Other 2.8%
- 2008→2024 swing
- +10.1pp toward D · 2008: 0.1pp · 2024: 10.2pp
- All cycles
- 2024: D+10.2 2020: D+11.0 2016: D+10.2 2012: R+19.3 2008: D+0.1
Not yet ingested
- Civics
- —
Market trends
- HPI YoY
- ▼ -917.09%
- Current HPI
- 331.0911
- Rent YoY
- ▲ 3.93%
- Metro
- Salt Lake City, UT
- State GDP YoY
- ▲ 3.54%
- F500 in state
- 2
Industry mix (Fortune 500 HQ in UT)
| Industry | F500 HQs | Revenue |
|---|---|---|
| Financial Services | 1 | $3B |
|
||
Price history
+195.3% since first listed24 events — show timeline
- 2026-02-17 Pending — WFRMLS
- 2025-10-31 Price Changed $724,900 WFRMLS
- 2025-10-19 Listed $749,900 WFRMLS
- 2025-08-18 Listing Removed — WFRMLS
- 2025-06-25 Listed $769,500 WFRMLS
- 2024-09-06 Listing Removed — WFRMLS
- 2024-08-09 Price Changed $724,500 WFRMLS
- 2024-08-02 Price Changed $769,500 WFRMLS
- 2024-07-16 Price Changed $789,500 WFRMLS
- 2024-07-14 Listed $589,500 WFRMLS
- 2020-10-02 Sold (Public Records) — Public Records
- 2013-12-09 Sold (Public Records) — Public Records
- 2013-12-06 Sold (MLS) — WFRMLS
- 2013-06-07 Listed $275,000 WFRMLS
- 2007-11-19 Listing Removed — WFRMLS
- 2007-06-29 Listed $319,900 WFRMLS
- 2006-09-14 Sold (Public Records) — Public Records
- 2006-09-14 Sold (MLS) — WFRMLS
- 2006-06-22 Listing Removed — WFRMLS
- 2006-06-22 Listed $269,000 WFRMLS
- 2006-06-14 Listed $295,000 WFRMLS
- 2006-02-27 Sold (MLS) — WFRMLS
- 2006-02-08 Sold (Public Records) — Public Records
- 2006-01-09 Listed $245,500 WFRMLS
Property tax history
+4.8%/yrLatest (2025): $3,528 · +3.8% YoY. Source: county tax records.
Cash-flow waterfall
monthlySold comps — $/sqft
last 12 mo · ≤1 miLoading sold comps…