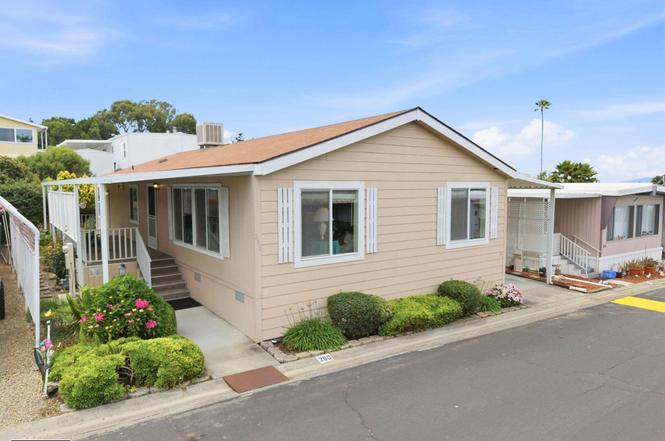
16401 San Pablo Ave #290 · Montalvin Manor, CA
Flood risk 1/10 · Minimal
- FEMA flood zone
- X (unshaded)
- Chance of flooding over 30 yrs
- 0.0%
- Est. flood insurance / yr
- $507 – $1,088
Fire risk 2/10 · Minimal
- Est. fire insurance / yr
- $659 – $1,223
Heat risk 4/10 · Minor
- Hot days now (above 86°F)
- 7 days/yr
- Hot days in 30 yrs
- 14 days/yr
Wind risk 1/10 · Minimal
- Chance of severe wind over 30 yrs
- —
Air-quality risk 8/10 · Major
- Unhealthy air days now
- 15 days/yr
- Unhealthy air days in 30 yrs
- 15 days/yr
Risk factors via First Street. Map © Google.
Why this score? — see what drove the C grade
The composite is a weighted blend of 9 inputs, each scored 0–100. Each bar is that input's sub-score; the figure is the points it added to the 100-point composite (weight × sub-score).
- Cash flow +25.3/30.0
- DSCR +8.3/10.0
- ARV discount +7.5/15.0
- 1% rule +6.6/10.0
- Livability +3.5/5.0
- Rent growth +3.3/5.0
- Schools +3.0/10.0
- Condition / age +2.5/5.0
- Appreciation +0.0/10.0
$280,000
🖨 Deal sheet 📄 Offer letter ✓ Due diligence
Listing remarks
Custom-Built 2006 Home in Tara Hills Mobile Manor Senior Park • 3 Bedroom / 2 Bath 1,605 Sq Ft One-Owner Manufactured Home • Enjoy the Afternoon Breezes from the Golden Gate • Includes Designer Furnishings Throughout • Custom Kitchen with Wood Cabinets, Granite Counters & Island • Updated Bathrooms & Walk-in Wardrobe Closet • Laundry Room with Washer/Dryer and Cabinetry • Vaulted Ceilings, Dual-Paned Windows, Central Heat/Evaporative Cooler • Large Front Porch & Landscaped Garden Areas • Well-Maintained Amenities and much more … • Community Amenities include: • Year-Round Heated Pool, Spa & Sauna • C
Key facts
- Custom kitchen
- Large front porch
- Granite counters
Tags
Property features AI
Finance
- HOA & community: Park: Tara Hills Mobile; Senior community; Clubhouse; Greenbelt; Community pool; Sauna and spa; Game room; On-site laundry; Pet restrictions (size limit)
Exterior
- Parking: 2-car garage; Carport for two or more vehicles; Awning-covered parking; Two covered parking spaces; Two spaces per unit
- Utilities: Public water; Public sewer; Individual electric meter; Individual gas meter
- Home design: Manufactured in park (mobile home); Double wide model; Single-story living; Main entry at street level
- Construction: Wood frame construction
- Exterior features: Front porch; Deck; Carpeted patio/porch; Awnings; Automatic sprinklers; Shed(s); Landscaped
Interior
- Kitchen: Stone counters; Kitchen island; Dishwasher; Disposal; Gas range / cooktop; Free-standing range; Microwave; Range/oven free standing; Refrigerator; Updated kitchen
- Bedrooms: 3 bedrooms (street level); Primary bedroom suite
- Flooring: Laminate flooring; Tile flooring; Carpet
- Bathrooms: 2 full bathrooms; Updated bathrooms with windows
- Heating & cooling: Forced-air heating (natural gas); Evaporative cooling
- Interior features: Updated kitchen; Main entry; Laundry facility; Window coverings; Screens; Double-pane windows; Storage area; Updated baths; Shower over tub; Stall shower; Tub; Windows in baths
- Laundry & utility: Laundry room with washer and dryer; Cabinets in laundry area; Gas water heater
Neighborhood map
What this means for you Summary
Snapshot
- This is a 3-bed/2.0-bath manufactured listed at $280k.
Deal economics
- At list price, monthly cash flow is $637 ($8k/yr) — positive.
- The deal already cash-flows at list — no discount required.
- Meets the 1% rule at list price ($3k rent vs $280k).
Location & tenants
- Location reads 69/100 on livability (#262 in CA) — a middle-class / working-renter tenant base. Strengths: commute A+, housing A+, employment A; Watch: amenities F, cost of living F, health & safety F.
- West Contra Costa Unified (suburban): math 24% / reading 35% proficiency, ranked #993 of 1,400 in CA (top 71%) — low school quality limits family demand, transient renter base, plan for 1-2y turnover.
- Market conditions: Rents rising (+3.1%/yr); 123 active listings in the ZIP; 11 comparable units currently listed for rent nearby; rentals leasing fast (median 11d on market — plan ~1-2 weeks tenant-placement turnaround); solid renter incomes; 2,169 units permitted in Contra Costa County in 2024 (896 in 5+ unit buildings).
- At $3,256/mo this rent would consume 45% of the median local household income ($86k/yr) (locally 2830% of renters already pay >50% of income on rent) — very limited rent-growth headroom before tenants either downsize or default.
Forward outlook
- Local home prices are declining (-3.0%/yr); year-one equity from $2k of loan paydown is wiped out by about $8k of value loss. Plan a longer hold.
- Contra Costa County population projected at +26% by 2050 — long-run rental-demand tailwind backs the buy-and-hold thesis.
Negotiation context
- Only 8 days on market — expect competitive offers; lowballing is unlikely to land.
Questions for the listing agent
- Is there a deadline driving the sale (1031 exchange, divorce, estate, relocation)? That informs how much negotiation room exists.
- What's the average days-on-market for RENTAL listings here right now (not sales)? A rising rental-DOM trend means longer vacancies and softer asking-rent achievability than the comps imply.
- What's the recent tenant-quality profile in this submarket — average credit score on applications, eviction rate, late-payment / NSF rate, and stable-employment percentage? A property-management company in the area should have these aggregated.
- How much new for-sale + rental construction is in the pipeline within 1–3 miles? Heavy new supply typically softens prices + rents 12–24 months out; constrained supply supports both.
Investment metrics
- 1% rule
- 1.16% ✓
- Cap rate
- 9.02%
- Cash-on-cash
- 9.75%
- DSCR
- 1.43
- GRM
- 7.2
CMA / ARV
- ARV (on-the-fly)
- $178,155
- Comps found
- 5
Show comp detail 5 sales within ~0.75 mi
| Address | Dist | Beds/Ba | Sqft | Sold | Price | $/sf | Match |
|---|---|---|---|---|---|---|---|
| 16401 San Pablo Ave #433 | 0.00mi | 3/2.0 | 1,428 (-11%) | 11mo | $260,000 | $182 | 72 |
| 16401 San Pablo Ave #413 | 0.08mi | 2/2.0 (-1) | 1,440 (-10%) | 11mo | $160,000 | $111 | 65 |
| 16401 San Pablo Ave #429 | 0.07mi | 2/2.0 (-1) | 1,368 (-15%) | 3mo | $200,000 | $146 | 65 |
| 16401 San Pablo Ave #338 | 0.08mi | 2/2.0 (-1) | 1,400 (-13%) | 8mo | $120,000 | $86 | 63 |
| 16401 San Pablo Ave #131 | 0.07mi | 2/2.0 (-1) | 1,368 (-15%) | 22mo | $140,000 | $102 | 48 |
Match score weights: distance 35% · size 25% · config 20% · recency 20%. Top-matched comps best support the ARV.
Projected returns pro-forma
-3.0% appreciation · 3.06% rent growth · sell at horizon
- IRR
- -1.5%
- Equity multiple
- 0.94×
- Total profit
- $-4,561
- Equity at exit
- $41,749
- IRR
- 8.2%
- Equity multiple
- 1.63×
- Total profit
- $49,271
- Equity at exit
- $24,209
Cash invested: $78,400 (down + closing). Projections, not guarantees.
Landlord ↔ Tenant lean methodology
- Overall (STATE)
- 18 Strongly Tenant-Friendly
- State California
- 18 Strongly Tenant-Friendly · D+13
- County
- — inherits STATE
- City
- — inherits STATE
ZIP-level market 94806
- Rents YoY
- 3.1%
- Active inventory
- 123
- Price-to-rent
- 7.2×
Monthly cashflow live
- Estimated rent
- $3,256 high interval (Pro) →
- Mortgage (P&I)
- −$1,468
- Tax est. 1.5%
- −$350 /mo · $4,200/yr
- Insurance
- −$117
- HOA
- −$0
- Vacancy / Maint / Mgmt
- −$684
- Net cashflow
- $637
Break-even live
UW: 25.0% down · 7.5% · 30yr · 1.5% tax · 5.0% vac · 8.0% maint · 8.0% mgmt
Financing live
Cash to close
- Down payment
- $70,000
- Closing costs
- $8,400
- Reserves months
- —
- Total cash needed
- —
Loan-product check · same deal, 3 products live
Conventional
25% down · 7.5% · 30yr
- Down + closing
- —
- Monthly P&I
- —
- Monthly cashflow
- —
- DSCR
- —
- Eligible?
- —
Personal DTI + credit; lowest rate.
DSCR
20% down · 8.5% · 30yr
- Down + closing
- —
- Monthly P&I
- —
- Monthly cashflow
- —
- DSCR
- —
- Eligible?
- —
No personal income docs; deal must DSCR.
Hard money
10% down · 12.0% · 12mo
- Down + closing
- —
- Monthly P&I
- —
- Monthly cashflow
- —
- DSCR
- —
- Eligible?
- —
Short-term bridge; refi at stabilization.
Rent comps 11 comps
| Address | Beds | Baths | Sqft | Rent | $/sqft | DOM | Units | Dist |
|---|---|---|---|---|---|---|---|---|
| 2633 Rim Rd San Pablo, CA | 3.0 | 2.0 | 1187 | $3,500 | $2.95 | 43d | 1 | 0.12mi |
| 2689 Limerick Rd San Pablo, CA | 3.0 | 2.0 | 1170 | $3,650 | $3.12 | 43d | 1 | 0.59mi |
| 2275 Cypress Ave San Pablo, CA | 3.0 | 2.0 | 1204 | $3,095 | $2.57 | 16d | 1 | 0.77mi |
| 3400 Richmond Pkwy San Pablo, CA | 1.0–2.0 | 1.0–2.0 | 906 | $2,417 | $2.67 | 1d | 67 | 0.83mi |
| 2933 Cornelius Dr San Pablo, CA | 4.0 | 2.0 | 1302 | $2,755 | $2.12 | 11d | 1 | 0.97mi |
| 2601 Hilltop Dr San Pablo, CA | 1.0–2.0 | 1.0–2.0 | 963 | $3,279 | $3.40 | 1d | 21 | 0.99mi |
| 530 Sunnyview Dr Pinole, CA | 2.0–3.0 | 1.0–2.0 | 986 | $3,126 | $3.17 | 1d | 16 | 1.30mi |
| 3614 Stoneglen S San Pablo, CA | 2.0 | 2.0 | 1176 | $2,395 | $2.04 | 43d | 1 | 1.31mi |
| 1611 Summer Ln San Pablo, CA | 4.0 | 3.5 | 2103 | $4,050 | $1.93 | 14d | 1 | 1.40mi |
| 3185 Garrity Way Richmond, CA | 1.0–2.0 | 1.0–2.0 | 967 | $3,620 | $3.74 | 1d | 17 | 1.47mi |
| 24 Park Ln El Sobrante, CA | 2.0 | 1.5 | 1080 | $3,200 | $2.96 | 2d | 1 | 1.49mi |
Listing history 7 events
-
2026-06-18days on market $280,000 Active 8 DOM
-
2026-06-17days on market $280,000 Active 7 DOM
-
2026-06-16days on market $280,000 Active 6 DOM
-
2026-06-15days on market $280,000 Active 5 DOM
-
2026-06-13days on market $280,000 Active 3 DOM
-
2026-06-13remarks 616-char remark
-
2026-06-13$280,000 Active 2 DOM
ⓘ Source: listings_history table (triggers on properties + properties_extension) + one-shot
backfill from property_details.listing_events for pre-trigger history.
Climate risk First Street
- Flood 1/10 Low FEMA zone X (unshaded) · 0% chance over 30 yrs
- Wildfire 2/10 Low
- Heat 4/10 Moderate 7 d/yr ≥86°F today · 14 d/yr by 30 yrs out
- Wind 1/10 Low
- Air quality 8/10 Severe 15 unhealthy d/yr today · 15 by 30 yrs out
Nearby sold comps map
Loading sold comps map…
Walkable amenities ~0.75 mi
Loading nearby amenities…
Taxation est. · year 1
- Rental income
- $39,067
- − Mortgage interest
- −$15,684
- − Property taxes
- −$4,200
- − Insurance
- −$1,400
- − Repairs & maintenance
- −$3,125
- − Management
- −$3,125
- − Depreciation
- −$8,145
- Taxable income
- $3,387
- Est. tax owed @ 24.0%
- −$813
- After-tax cash flow
- $6,830/yr
For passive investors: Depreciation is non-cash, so a rental often shows a tax loss while cash-flowing — sheltering income. Rental losses are passive: they offset passive income freely, and up to $25,000/yr can offset ordinary (W-2) income if you actively participate and your MAGI is under $100k (phasing out to $0 by $150k); unused losses carry forward. On sale, claimed depreciation is recaptured at up to 25%, and gains may owe capital-gains tax (a 1031 exchange can defer both). Figures are a year-1 estimate at your 24.0% rate — not tax advice; consult a CPA.
Schools (NCES district)
- District
- West Contra Costa Unified
- NCES district ID
- 0632550
- Math proficiency
- 24% ▲ 1.00%
- Reading proficiency
- 35% ▲ 1.00%
- Median HH income
- $64,837
- Composite
- 30.04/100
- National rank
- #11623
- State rank
- #993 of 1400 in CA
Livability — Montalvin Manor
- Score
- 69/100
- State rank
- #262
- US rank
- #8705
Category grades
Schools grade is shown separately in the Schools card above.
Census & demographics
- Census place
- Montalvin Manor, CA
- County
- Contra Costa County · 1,059,880 people
- Metro
- San Francisco-Oakland-Berkeley, CA
- Population (ZIP)
- 62,546
- Household income
- $86,034
- Rent vs Own
- Severe rent burden
- 2830.0
Population outlook (Contra Costa County) Hauer SSP2
- Today (2025)
- 1,287,720 people
- By 2030
- 1,364,937 · +6.0%
- By 2040
- 1,506,209 · +17.0%
- By 2050
- 1,624,373 · +26.1%
- By 2075
- 1,853,193 · +43.9%
- By 2100
- 1,901,231 · +47.6%
Race, ethnicity, and origin ACS 2023
- Neighborhood character
- Diverse neighborhood (Simpson 0.68)
- Race & ethnicity
- Hispanic / Latino 51% Two or more races 16% Asian 16% Black 13% White 12% Native American 1%
- Hispanic origin (detail)
- Mexican 34%
- Common ancestry
- Estonian 2% Italian 1% Russian 1%
- Foreign-born
- 38% · Canada, China, Vietnam
- Languages at home
- 39% English-only · Spanish 43% Other Indo-European 4% Tagalog/Filipino 3%
Political lean MEDSL · Contra Costa
- 2024 margin
- Solid D (+38.0) · D 67.3% · R 29.4% · Other 3.3%
- 2008→2024 swing
- +0.2pp no change · 2008: 37.8pp · 2024: 38.0pp
- All cycles
- 2024: D+38.0 2020: D+45.3 2016: D+43.5 2012: D+33.7 2008: D+37.8
Not yet ingested
- Civics
- —
Market trends
- HPI YoY
- ▼ -665.89%
- Current HPI
- 323.0082
- Rent YoY
- ▲ 3.06%
- Metro
- San Francisco-Oakland-Berkeley, CA
- State GDP YoY
- ▲ 3.21%
- F500 in state
- 116
Industry mix (Fortune 500 HQ in CA)
| Industry | F500 HQs | Revenue |
|---|---|---|
| Technology | 27 | $1,492B |
|
||
| Financial Services | 3 | $174B |
|
||
| Retail | 3 | $44B |
|
||
| Insurance | 3 | $26B |
|
||
| Media / Entertainment | 2 | $115B |
|
||
| Pharmaceuticals / Biotech | 2 | $62B |
|
||
Price history
1 event — show timeline
- 2026-06-10 Listed $280,000 bridgeMLS, Bay East AOR, or Contra Costa AOR
Property tax history
-2.4%/yrLatest (2025): $555 · +4.8% YoY. Source: county tax records.
Cash-flow waterfall
monthlySold comps — $/sqft
last 12 mo · ≤1 miLoading sold comps…