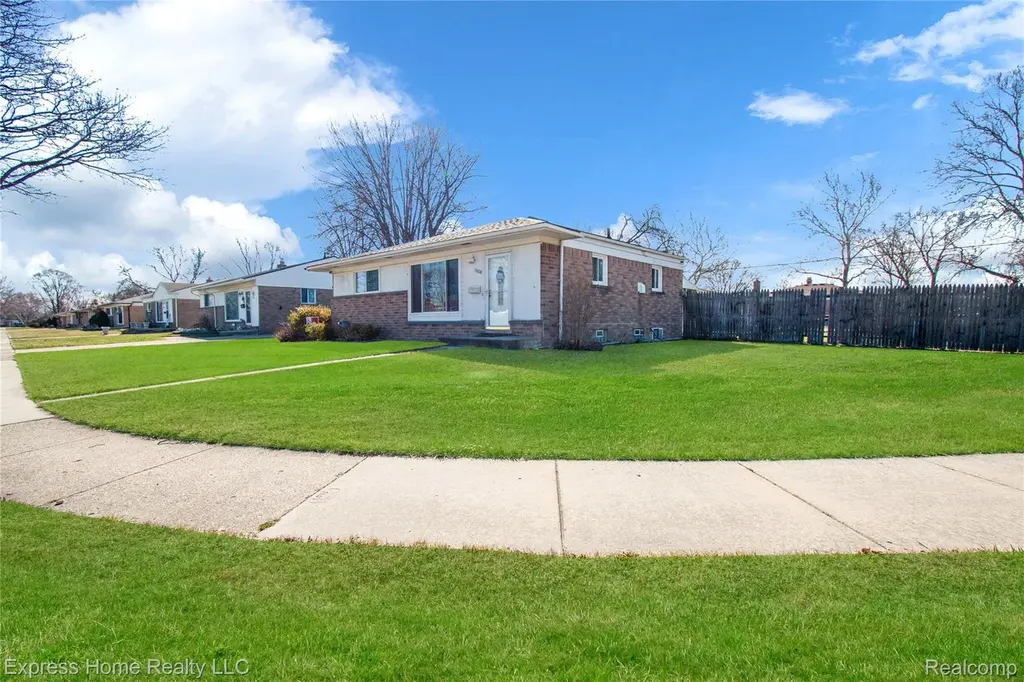
11808 Mckinley Dr · Warren, MI
Flood risk 1/10 · Minimal
- FEMA flood zone
- X (unshaded)
- Chance of flooding over 30 yrs
- 0.0%
- Est. flood insurance / yr
- $473 – $860
Fire risk 1/10 · Minimal
- Est. fire insurance / yr
- $784 – $1,456
Heat risk 3/10 · Minor
- Hot days now (above 96°F)
- 7 days/yr
- Hot days in 30 yrs
- 15 days/yr
Wind risk 1/10 · Minimal
- Chance of severe wind over 30 yrs
- —
Air-quality risk 3/10 · Minor
- Unhealthy air days now
- 3 days/yr
- Unhealthy air days in 30 yrs
- 4 days/yr
Risk factors via First Street. Map © Google.
Why this score? — see what drove the D grade
The composite is a weighted blend of 9 inputs, each scored 0–100. Each bar is that input's sub-score; the figure is the points it added to the 100-point composite (weight × sub-score).
- ARV discount +15.0/15.0
- Cash flow +10.2/30.0
- Livability +3.7/5.0
- 1% rule +3.4/10.0
- Rent growth +3.2/5.0
- DSCR +2.9/10.0
- Schools +2.7/10.0
- Condition / age +2.5/5.0
- Appreciation +0.0/10.0
$185,000
🖨 Deal sheet (PDF) 📄 Offer letter ✓ Due diligence
Listing remarks MLS
Welcome to this charming ranch home located in a quiet, established neighborhood in Warren. This well-maintained property offers comfortable single-level living with a functional layout, featuring spacious living areas filled with natural light. The home sits on a nicely sized lot with generous frontage, providing great curb appeal and outdoor potential. Enjoy a convenient location close to major roads, shopping, dining, and everyday amenities, making commuting and errands easy. Whether you're a first-time buyer, downsizing, or looking for an investment opportunity, this home offers solid value and endless possibilities. Schedule your showing today and see all that this home has to offer! Please allow at least 2 hours' notice to schedule all showings, as the seller currently occupies the home.
Key facts
- Ranch home
- Natural light
- Generous frontage
Tags
Neighborhood map
What this means for you Summary
Snapshot
- This is a 3-bed/1.0-bath single-family listed at $185k.
Deal economics
- At list price, monthly cash flow is $-106 ($-1k/yr) — negative.
- To cash-flow at today's rent, offer at most $166k (10.1% below list).
- To meet the 1% rule (rent ≥ 1% of price), the offer needs to be $156k (15.9% below list).
- Recommended offer: $156k (15.9% below list) — sets the bar for 1% rule.
Location & tenants
- Location reads 74/100 on livability (#171 in MI, #4,491 nationally) — a middle-class / working-renter tenant base. Strengths: commute A+, cost of living A+, housing A+; Watch: amenities D, employment D, crime D-.
- Warren Woods Public Schools (urban): math 23% / reading 40% proficiency, ranked #336 of 540 in MI (top 62%) — families likely to look elsewhere, expect single-tenant / working-renter base with shorter leases.
- Zoned schools: Westwood Elementary School (math 32% / reading 47%, grade F, #606 of 1,397 statewide, top 48%, 508 students, 76% FRL); Warren Woods Middle School (math 22% / reading 41%, grade F, #323 of 493 statewide, top 66%, 707 students, 67% FRL); Warren Woods Tower High School (math 26% / reading 50%, grade F, #331 of 713 statewide, top 46%, 1,047 students, 59% FRL) — zoned schools average 67% FRL vs 43% district-wide (25 pts higher); higher-poverty schools than district average — tighter screening recommended.
- Market conditions: Rents rising (+2.9%/yr); 168 active listings in the ZIP; 14 comparable units currently listed for rent nearby; rentals at typical pace (median 23d on market — plan ~3-4 weeks tenant-placement turnaround); 1,321 units permitted in Macomb County in 2024 (86 in 5+ unit buildings).
- This rent runs 36% of the median local income ($52k/yr) — at the standard rent-burdened threshold; future hikes will face affordability resistance.
Forward outlook
- Local home prices are declining (-3.0%/yr); year-one equity from $1k of loan paydown is wiped out by about $6k of value loss. Plan a longer hold.
- Macomb County population projected at +9% by 2050 — modest demand growth; plan on rents tracking national, not racing it.
Negotiation context
- It's been on market 80 days — a 6% lower offer ($174k) is reasonable based on typical stale-listing flexibility.
- 14 sale attempts since 18y ago; this cycle's ask has dropped $10k (5%) from the opening price — seller is motivated, your offer sets the floor, not the list.
- Current owner paid $95k; list at $185k implies a 95% gain — meaningful room to come down on a strong offer.
Questions for the listing agent
- What do current leases actually rent for vs. the listed asking? Can we see a recent rent roll and the last 12 months of T-12 income?
- It's been on market 80 days. Have you received any prior offers? Is the seller open to a 16% concession, seller financing, or rate buy-down credit?
- Built in 1961 — when were the roof, HVAC, electrical panel, plumbing, and water heater last replaced?
- Why hasn't it sold? Are there any deal-killer items the seller is aware of (foundation, flood, title, zoning, code violations)?
- Is there a deadline driving the sale (1031 exchange, divorce, estate, relocation)? That informs how much negotiation room exists.
- Schools are D-rated, which usually means shorter tenancies and higher turnover. Who's the typical renter profile here, and what's been the actual vacancy rate?
- Crime grade is D in this area — have there been break-ins, vandalism, or insurance claims at this property in the last 3 years? What carrier currently insures it and at what premium?
- The area grade is low — what's the realistic commute time and amenity access for the typical tenant pool here? Any planned neighborhood developments (good or bad) we should know about?
- What's the average days-on-market for RENTAL listings here right now (not sales)? A rising rental-DOM trend means longer vacancies and softer asking-rent achievability than the comps imply.
- What's the recent tenant-quality profile in this submarket — average credit score on applications, eviction rate, late-payment / NSF rate, and stable-employment percentage? A property-management company in the area should have these aggregated.
- How much new for-sale + rental construction is in the pipeline within 1–3 miles? Heavy new supply typically softens prices + rents 12–24 months out; constrained supply supports both.
Investment metrics
- 1% rule
- 0.84% ✗
- Cap rate
- 5.60%
- Cash-on-cash
- -2.46%
- DSCR
- 0.89
- GRM
- 9.9
CMA / ARV
- ARV (median comp)
- $222,123
- List price
- $185,000
- Delta
- -16.71%
- Verdict
- UNDERPRICED
- Comps
- 20 within 1.0 mi
Show comp detail 11 sales within ~0.75 mi
| Address | Dist | Beds/Ba | Sqft | Sold | Price | $/sf | Match |
|---|---|---|---|---|---|---|---|
| 11927 Stamford Ave | 0.10mi | 3/2.0 | 963 (-4%) | 4mo | $200,000 | $208 | 81 |
| 27278 Shackett Ave | 0.32mi | 3/2.0 | 954 (-5%) | 7mo | $217,000 | $227 | 67 |
| 11038 Jim Pl | 0.53mi | 3/1.5 | 980 (-2%) | 16mo | $218,500 | $223 | 56 |
| 11478 Engleman Rd | 0.62mi | 3/1.0 | 936 (-7%) | 7mo | $169,000 | $181 | 54 |
| 11002 Dale Ave | 0.71mi | 3/1.0 | 1,007 (+0%) | 16mo | $185,000 | $184 | 53 |
| 27045 Fairfield Dr | 0.60mi | 3/1.5 | 1,112 (+11%) | 11mo | $282,000 | $254 | 43 |
| 11246 Garbor Dr | 0.55mi | 3/1.5 | 1,145 (+14%) | 10mo | $205,000 | $179 | 41 |
| 26095 Burg Rd | 0.45mi | 3/1.5 | 1,115 (+11%) | 22mo | $210,000 | $188 | 41 |
| 25226 Roan Ave | 0.75mi | 3/1.0 | 914 (-9%) | 12mo | $209,000 | $229 | 40 |
| 25146 Wagner Ave | 0.72mi | 3/1.0 | 906 (-10%) | 16mo | $192,000 | $212 | 36 |
| 25317 Palomino Ave | 0.71mi | 3/1.0 | 928 (-8%) | 23mo | $212,000 | $228 | 35 |
Match score weights: distance 35% · size 25% · config 20% · recency 20%. Top-matched comps best support the ARV.
Projected returns pro-forma
-3.0% appreciation · 2.94% rent growth · sell at horizon
- IRR
- -20.4%
- Equity multiple
- 0.29×
- Total profit
- $-36,781
- Equity at exit
- $27,584
- IRR
- -13.6%
- Equity multiple
- 0.21×
- Total profit
- $-40,889
- Equity at exit
- $15,995
Cash invested: $51,800 (down + closing). Projections, not guarantees.
Landlord ↔ Tenant lean methodology
- Overall (STATE)
- 62 Landlord-Friendly
- State Michigan
- 62 Landlord-Friendly · EVEN
- County
- — inherits STATE
- City
- — inherits STATE
ZIP-level market 48089
- Rents YoY
- 2.9%
- Active inventory
- 168
- Price-to-rent
- 9.9×
Monthly cashflow live
- Estimated rent
- $1,557 high interval (Pro) →
- Mortgage (P&I)
- −$970
- Tax from tax record
- −$289 /mo · $3,465/yr
- Insurance
- −$77
- HOA
- −$0
- Vacancy / Maint / Mgmt
- −$327
- Net cashflow
- $-106
Break-even live
Sensitivity live
| Price | -10% $-2 | -5% $-54 | +0% $-106 | +5% $-159 | +10% $-211 |
|---|---|---|---|---|---|
| Rent | -10% $-229 | -5% $-168 | +0% $-106 | +5% $-45 | +10% $17 |
| Rate | -1.0pp $-13 | -0.5pp $-59 | base $-106 | +0.5pp $-154 | +1.0pp $-203 |
UW: 25.0% down · 7.5% · 30yr · 1.5% tax · 5.0% vac · 8.0% maint · 8.0% mgmt
Financing live
Cash to close
- Down payment
- $46,250
- Closing costs
- $5,550
- Reserves months
- —
- Total cash needed
- —
Loan-product check · same deal, 3 products live
Conventional
25% down · 7.5% · 30yr
- Down + closing
- —
- Monthly P&I
- —
- Monthly cashflow
- —
- DSCR
- —
- Eligible?
- —
Personal DTI + credit; lowest rate.
DSCR
20% down · 8.5% · 30yr
- Down + closing
- —
- Monthly P&I
- —
- Monthly cashflow
- —
- DSCR
- —
- Eligible?
- —
No personal income docs; deal must DSCR.
Hard money
10% down · 12.0% · 12mo
- Down + closing
- —
- Monthly P&I
- —
- Monthly cashflow
- —
- DSCR
- —
- Eligible?
- —
Short-term bridge; refi at stabilization.
Rent comps 14 comps
| Address | Beds | Baths | Sqft | Rent | $/sqft | DOM | Units | Dist |
|---|---|---|---|---|---|---|---|---|
| 11809 McKinley Dr Warren, MI | 3.0 | 1.5 | 1212 | $1,800 | $1.49 | 19d | 1 | 0.01mi |
| 27239 Hoover Rd Warren, MI | 1.0–2.0 | 1.0 | 670 | $945 | $1.41 | 45d | 1 | 0.34mi |
| 13006 E 11 Mile Rd Unit 6 Warren, MI | 2.0 | 1.0 | 850 | $1,075 | $1.26 | 16d | 1 | 0.63mi |
| 13006 E 11 Mile Rd Unit 6 Warren, MI | 2.0 | 1.0 | 850 | $1,050 | $1.24 | 45d | 1 | 0.63mi |
| 8625 Dale Center Line, MI | 3.0 | 1.5 | 1179 | $1,796 | $1.52 | 45d | 1 | 0.73mi |
| 25146 Wagner Ave Warren, MI | 3.0 | 1.0 | 906 | $1,900 | $2.10 | 25d | 1 | 0.74mi |
| 25108 Hoover Rd Warren, MI | 1.0–2.0 | 1.0 | 702 | $1,324 | $1.88 | 0d | 61 | 0.74mi |
| 11404 Warren Blvd Unit 102 Warren, MI | 2.0 | 1.0 | 900 | $1,250 | $1.39 | 25d | 1 | 0.75mi |
| 28250 Hoover Rd Warren, MI | 1.0–2.0 | 1.0–2.0 | 912 | $1,640 | $1.80 | 0d | 17 | 0.87mi |
| 13250 De Mott Dr Warren, MI | 3.0 | 1.5 | 1386 | $1,900 | $1.37 | 45d | 1 | 0.90mi |
| 13741 McKinley Ave Unit 1032320P Warren, MI | 2.0 | 1.0 | 839 | $4,983 | $5.94 | 0d | 1 | 1.02mi |
| 28801 Imperial Dr Warren, MI | 1.0–2.0 | 1.0 | 887 | $1,205 | $1.36 | 18d | 6 | 1.12mi |
| 27107 Seyburn Ave Warren, MI | 2.0 | 1.0 | 750 | $1,300 | $1.73 | 23d | 1 | 1.25mi |
| 11130 Stephens Rd Warren, MI | 2.0 | 1.0 | 750 | $1,275 | $1.70 | 0d | 1 | 1.43mi |
Listing history 48 events
-
2026-06-21days on market $185,000 Active 80 DOM
-
2026-06-18days on market $185,000 Active 77 DOM
-
2026-06-17days on market $185,000 Active 76 DOM
-
2026-06-16days on market $185,000 Active 75 DOM
-
2026-06-15days on market $185,000 Active 74 DOM
-
2026-06-13days on market $185,000 Active 72 DOM
-
2026-06-13days on market $185,000 Active 71 DOM
-
2026-06-09days on market $185,000 Active 68 DOM
-
2026-06-08days on market $185,000 Active 67 DOM
-
2026-06-07days on market $185,000 Active 66 DOM
-
2026-06-04days on market $185,000 Active 63 DOM
-
2026-06-03days on market $185,000 Active 62 DOM
-
2026-06-02days on market $185,000 Active 61 DOM
-
2026-06-01days on market $185,000 Active 60 DOM
-
2026-05-31pricedays on market $185,000 Active 59 DOM
-
2026-04-02$195,000 Active 804-char remark
Show marketing remark (810 chars)
Welcome to this charming ranch home located in a quiet, established neighborhood in Warren. This well-maintained property offers comfortable single-level living with a functional layout, featuring spacious living areas filled with natural light. The home sits on a nicely sized lot with generous frontage, providing great curb appeal and outdoor potential. Enjoy a convenient location close to major roads, shopping, dining, and everyday amenities, making commuting and errands easy. Whether you're a first-time buyer, downsizing, or looking for an investment opportunity, this home offers solid value and endless possibilities. Schedule your showing today and see all that this home has to offer! Please allow at least 2 hours’ notice to schedule all showings, as the seller currently occupies the home.
-
2026-04-02$195,000 Active 810-char remark
Show marketing remark (810 chars)
Welcome to this charming ranch home located in a quiet, established neighborhood in Warren. This well-maintained property offers comfortable single-level living with a functional layout, featuring spacious living areas filled with natural light. The home sits on a nicely sized lot with generous frontage, providing great curb appeal and outdoor potential. Enjoy a convenient location close to major roads, shopping, dining, and everyday amenities, making commuting and errands easy. Whether you're a first-time buyer, downsizing, or looking for an investment opportunity, this home offers solid value and endless possibilities. Schedule your showing today and see all that this home has to offer! Please allow at least 2 hours’ notice to schedule all showings, as the seller currently occupies the home.
-
2019-03-05soldstatus $95,000
-
2019-03-01soldstatus $95,000
-
2019-03-01soldstatus $95,000 Closed
-
2019-01-22status Pending
-
2018-11-29price $105,000
-
2018-11-29status Active
-
2018-11-27status Pending
-
2018-11-13price $110,000
-
2018-10-21price $115,000
-
2018-10-14price $120,000
-
2018-10-12$105,000
-
2018-10-12$110,000 Active
-
2012-05-10soldstatus $56,700
-
2009-04-10historical
-
2009-04-08soldstatus $56,700
-
2009-03-25$44,900
-
2009-03-25$44,900
-
2009-03-24historical
-
2009-03-24historical
-
2008-09-24$44,900
-
2008-09-24$49,900
-
2008-08-13historical
-
2008-08-13historical
-
2008-08-01$59,900
-
2008-08-01$59,900
-
2008-08-01historical
-
2008-08-01historical
-
2008-06-03$59,900
-
2008-06-03$59,900
-
2008-06-03historical
-
2008-01-02$64,500
ⓘ Source: listings_history table (triggers on properties + properties_extension) + one-shot
backfill from property_details.listing_events for pre-trigger history.
Tax reassessment forecast MI · Partial reset (capped growth)
- Current annual tax
- $3,465 · $289/mo
- Projected year-2 tax
- $3,465 · $289/mo
- Expected delta
- $0/yr ($0/mo · 0.0%)
ⓘ Screening estimate from a state-policy table — verify with the county assessor before closing.
Climate risk First Street
- Flood 1/10 Low FEMA zone X (unshaded) · 0% chance over 30 yrs
- Wildfire 1/10 Low
- Heat 3/10 Moderate 7 d/yr ≥96°F today · 15 d/yr by 30 yrs out
- Wind 1/10 Low
- Air quality 3/10 Moderate 3 unhealthy d/yr today · 4 by 30 yrs out
Nearby sold comps map
Loading sold comps map…
Walkable amenities ~0.75 mi
Loading nearby amenities…
Taxation est. · year 1
- Rental income
- $18,679
- − Mortgage interest
- −$10,363
- − Property taxes
- −$3,465
- − Insurance
- −$925
- − Repairs & maintenance
- −$1,494
- − Management
- −$1,494
- − Depreciation
- −$5,382
- Taxable loss
- −$4,444
- Est. tax savings @ 24.0%
- +$1,067
- After-tax cash flow
- $-209/yr
For passive investors: Depreciation is non-cash, so a rental often shows a tax loss while cash-flowing — sheltering income. Rental losses are passive: they offset passive income freely, and up to $25,000/yr can offset ordinary (W-2) income if you actively participate and your MAGI is under $100k (phasing out to $0 by $150k); unused losses carry forward. On sale, claimed depreciation is recaptured at up to 25%, and gains may owe capital-gains tax (a 1031 exchange can defer both). Figures are a year-1 estimate at your 24.0% rate — not tax advice; consult a CPA.
Schools (NCES district)
- District
- Warren Woods Public Schools
- NCES district ID
- 2635220
- Math proficiency
- 23% ▼ -9.00%
- Reading proficiency
- 40% ▼ -5.00%
- Median HH income
- $49,013
- Composite
- 27.29/100
- National rank
- #7003
- State rank
- #336 of 540 in MI
Livability — Warren
- Score
- 74/100
- State rank
- #171
- US rank
- #4491
Category grades
Schools grade is shown separately in the Schools card above.
Census & demographics
- Census place
- Warren, MI
- County
- Macomb County · 638,552 people
- City population
- 114,937
- Metro
- Detroit-Warren-Dearborn, MI
- Population (ZIP)
- 31,853
- Household income
- $52,366
- Rent vs Own
- Severe rent burden
- 1754.0
Population outlook (Macomb County) Hauer SSP2
- Today (2025)
- 925,296 people
- By 2030
- 948,226 · +2.5%
- By 2040
- 983,961 · +6.3%
- By 2050
- 1,010,200 · +9.2%
- By 2075
- 1,076,222 · +16.3%
- By 2100
- 1,077,065 · +16.4%
Race, ethnicity, and origin ACS 2023
- Neighborhood character
- Diverse neighborhood (Simpson 0.61)
- Race & ethnicity
- White 53% Black 31% Asian 7% Two or more races 6% Hispanic / Latino 3%
- Common ancestry
- Romanian 11% Lithuanian 3% Slovak 2%
- Foreign-born
- 5% · Canada
- Languages at home
- 92% English-only · Other Asian/Pacific 3% Other Indo-European 2% Arabic 1%
Political lean MEDSL · Macomb
- 2024 margin
- R (+13.7) · D 42.2% · R 55.9% · Other 1.9%
- 2008→2024 swing
- -22.3pp toward R · 2008: 8.6pp · 2024: -13.7pp
- All cycles
- 2024: R+13.7 2020: R+8.1 2016: R+11.6 2012: D+4.0 2008: D+8.6
Not yet ingested
- Civics
- —
Market trends
- HPI YoY
- ▼ -211.46%
- Current HPI
- 154.8325
- Rent YoY
- ▲ 2.94%
- Metro
- Detroit-Warren-Dearborn, MI
- State GDP YoY
- ▲ 1.37%
- F500 in state
- 28
Industry mix (Fortune 500 HQ in MI)
| Industry | F500 HQs | Revenue |
|---|---|---|
| Automotive Parts | 3 | $48B |
|
||
| Automotive | 2 | $372B |
|
||
| Chemicals | 1 | $45B |
|
||
| Automotive Retail | 1 | $29B |
|
||
| Healthcare / Medical Devices | 1 | $23B |
|
||
| Automotive Technology | 1 | $20B |
|
||
Price history
+202.3% since first listed33 events — show timeline
- 2026-04-02 Listed $195,000 REALCOMP
- 2026-04-02 Listed $195,000 MiRealSource-MiMLS
- 2019-03-05 Sold (Public Records) $95,000 Public Records
- 2019-03-01 Sold (MLS) $95,000 MiRealSource-MiMLS
- 2019-03-01 Sold (MLS) $95,000 REALCOMP
- 2019-01-22 Pending — MiRealSource-MiMLS
- 2018-11-29 Price Changed $105,000 MiRealSource-MiMLS
- 2018-11-29 Relisted — MiRealSource-MiMLS
- 2018-11-27 Pending — MiRealSource-MiMLS
- 2018-11-13 Price Changed $110,000 MiRealSource-MiMLS
- 2018-10-21 Price Changed $115,000 MiRealSource-MiMLS
- 2018-10-14 Price Changed $120,000 MiRealSource-MiMLS
- 2018-10-12 Listed $110,000 MiRealSource-MiMLS
- 2018-10-12 Listed $105,000 REALCOMP
- 2012-05-10 Sold (Public Records) $56,700 Public Records
- 2009-04-10 Listing Removed — MiRealSource-MiMLS
- 2009-04-08 Sold (MLS) $56,700 REALCOMP
- 2009-03-25 Listed $44,900 REALCOMP
- 2009-03-25 Listed $44,900 MiRealSource-MiMLS
- 2009-03-24 Listing Removed — MiRealSource-MiMLS
- 2009-03-24 Listing Removed — REALCOMP
- 2008-09-24 Listed $49,900 MiRealSource-MiMLS
- 2008-09-24 Listed $44,900 REALCOMP
- 2008-08-13 Listing Removed — REALCOMP
- 2008-08-13 Listing Removed — MiRealSource-MiMLS
- 2008-08-01 Listing Removed — REALCOMP
- 2008-08-01 Listing Removed — MiRealSource-MiMLS
- 2008-08-01 Listed $59,900 REALCOMP
- 2008-08-01 Listed $59,900 MiRealSource-MiMLS
- 2008-06-03 Listing Removed — REALCOMP
- 2008-06-03 Listed $59,900 REALCOMP
- 2008-06-03 Listed $59,900 MiRealSource-MiMLS
- 2008-01-02 Listed $64,500 REALCOMP
Property tax history
+5.9%/yrLatest (2025): $3,465 · +2.5% YoY. Source: county tax records.
Cash-flow waterfall
monthlySold comps — $/sqft
last 12 mo · ≤1 miLoading sold comps…