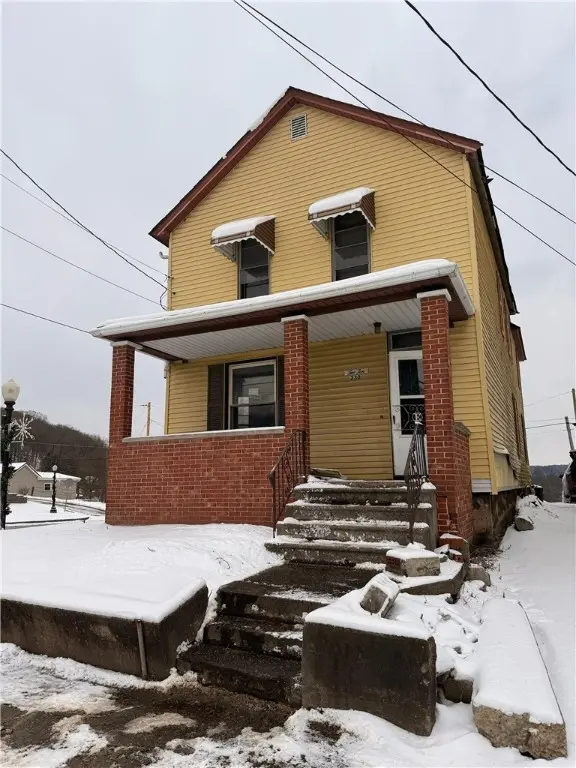
230 13th St · Ellwood City, PA
Flood risk 1/10 · Minimal
- FEMA flood zone
- X (unshaded)
- Chance of flooding over 30 yrs
- 0.0%
- Est. flood insurance / yr
- $473 – $860
Fire risk 1/10 · Minimal
- Est. fire insurance / yr
- $511 – $949
Heat risk 3/10 · Minor
- Hot days now (above 97°F)
- 7 days/yr
- Hot days in 30 yrs
- 18 days/yr
Wind risk 1/10 · Minimal
- Chance of severe wind over 30 yrs
- 0.0%
Air-quality risk 3/10 · Minor
- Unhealthy air days now
- 2 days/yr
- Unhealthy air days in 30 yrs
- 3 days/yr
Risk factors via First Street. Map © Google.
Why this score? — see what drove the B- grade
The composite is a weighted blend of 9 inputs, each scored 0–100. Each bar is that input's sub-score; the figure is the points it added to the 100-point composite (weight × sub-score).
- Cash flow +30.0/30.0
- 1% rule +10.0/10.0
- DSCR +10.0/10.0
- ARV discount +7.5/15.0
- Livability +3.6/5.0
- Schools +3.5/10.0
- Rent growth +2.5/5.0
- Condition / age +2.5/5.0
- Appreciation +0.0/10.0
$39,900
🖨 Deal sheet (PDF) 📄 Offer letter ✓ Due diligence
Listing remarks MLS
Bring your vision and tools! This 3-bedroom, 1-bath home offers a chance to create value through a complete renovation. Property is cash only and sold as-is, with extensive work needed. Features include a detached one-car garage and newer roofs on the house and garage. Perfect project for seasoned investors or contractors.
Key facts
- Newer roofs
- 3,223 sq ft lot
- Garage
Tags
Neighborhood map
What this means for you Summary
Snapshot
- This is a 3-bed/1.0-bath single-family listed at $40k.
Deal economics
- At list price, monthly cash flow is $747 ($9k/yr) — positive.
- The deal already cash-flows at list — no discount required.
- Meets the 1% rule at list price ($1k rent vs $40k).
- Recommended offer: $35k (12.0% below list) — sets the bar for market timing.
- Cap rate 28.8% vs local median 5.3% in Ellwood City — top-decile yield for the area; either an underpriced asset or a hidden risk that comps aren't pricing in. Stress-test before assuming the spread holds.
Location & tenants
- Location reads 72/100 on livability (#610 in PA) — a middle-class / working-renter tenant base. Strengths: crime A+, cost of living A+, housing A+; Watch: health & safety C-, amenities F, commute F.
- Ellwood City Area SD (town): math 28% / reading 56% proficiency, ranked #334 of 539 in PA (top 62%) — families likely to look elsewhere, expect single-tenant / working-renter base with shorter leases.
- Zoned schools: North Side Primary School (364 students, 58% FRL); Hartman Intrmd Sch (math 25% / reading 64%, grade D, #194 of 512 statewide, top 39%, 263 students, 58% FRL); Lincoln Jshs (math 32% / reading 52%, grade F, #232 of 437 statewide, top 57%, 672 students, 53% FRL) — zoned schools average 56% FRL vs 38% district-wide (18 pts higher); higher-poverty schools than district average — tighter screening recommended.
- Market conditions: 53 active listings in the ZIP; 1 comparable units currently listed for rent nearby; 51 units permitted in Lawrence County in 2024 (0 in 5+ unit buildings).
Forward outlook
- Local home prices are declining (-3.0%/yr); year-one equity from $276 of loan paydown is wiped out by about $1k of value loss. Plan a longer hold.
- Lawrence County population projected at -25% by 2050 — secular population decline; favor cash flow + early exit over multi-decade hold.
- At projected returns (-3.0% appreciation + 3.0% rent growth), your $11k cash investment doubles in ~2 years — after that, you're playing with house money.
Negotiation context
- It's been on market 187 days — a 12% lower offer ($35k) is reasonable based on typical stale-listing flexibility.
Risks & watch-outs
- Watch-outs: built in 1920 — expect roof / HVAC / electrical / plumbing capex.
Questions for the listing agent
- It's been on market 187 days. Have you received any prior offers? Is the seller open to a 12% concession, seller financing, or rate buy-down credit?
- Built in 1920 — when were the roof, HVAC, electrical panel, plumbing, and water heater last replaced?
- Why hasn't it sold? Are there any deal-killer items the seller is aware of (foundation, flood, title, zoning, code violations)?
- Is there a deadline driving the sale (1031 exchange, divorce, estate, relocation)? That informs how much negotiation room exists.
- Schools are B-rated — typically a magnet for longer-tenancy family renters. What's the average tenant stay here, and is there a school-zone premium baked into asking?
- What's the average days-on-market for RENTAL listings here right now (not sales)? A rising rental-DOM trend means longer vacancies and softer asking-rent achievability than the comps imply.
- What's the recent tenant-quality profile in this submarket — average credit score on applications, eviction rate, late-payment / NSF rate, and stable-employment percentage? A property-management company in the area should have these aggregated.
- How much new for-sale + rental construction is in the pipeline within 1–3 miles? Heavy new supply typically softens prices + rents 12–24 months out; constrained supply supports both.
Investment metrics
- 1% rule
- 3.25% ✓
- Cap rate
- 28.77%
- Cash-on-cash
- 80.27%
- DSCR
- 4.57
- GRM
- 2.6
CMA / ARV
- ARV (median comp)
- $157,228
- List price
- $39,900
- Delta
- -74.62%
- Verdict
- UNDERPRICED
- Comps
- 20 within 1.0 mi
Show comp detail 10 sales within ~0.75 mi
| Address | Dist | Beds/Ba | Sqft | Sold | Price | $/sf | Match |
|---|---|---|---|---|---|---|---|
| 1104 Center Ave | 0.17mi | 3/1.5 | 1,538 (-7%) | 1mo | $140,000 | $91 | 77 |
| 1206 Lawrence Ave | 0.07mi | 3/1.5 | 1,554 (-6%) | 13mo | $125,000 | $80 | 73 |
| 1112 Beaver Ave | 0.14mi | 3/1.5 | 1,472 (-11%) | 11mo | $164,900 | $112 | 63 |
| 1855 W Lawrence Ave | 0.46mi | 3/2.0 | 1,474 (-11%) | 0mo | $211,000 | $143 | 56 |
| 218 Keystone Way | 0.74mi | 3/1.0 | 1,712 (+3%) | 6mo | $30,000 | $18 | 54 |
| 1904 W Lawrence Ave | 0.52mi | 3/2.0 | 1,566 (-5%) | 14mo | $200,000 | $128 | 51 |
| 317 9th St | 0.37mi | 3/2.0 | 1,508 (-9%) | 15mo | $166,000 | $110 | 51 |
| 713 Crescent Ave | 0.51mi | 3/1.0 | 1,496 (-10%) | 12mo | $37,500 | $25 | 50 |
| 1517 Wampum Rd | 0.45mi | 3/3.0 | 1,810 (+9%) | 6mo | $175,000 | $97 | 50 |
| 705 Wayne Ave | 0.56mi | 3/1.0 | 1,512 (-9%) | 23mo | $123,772 | $82 | 40 |
Match score weights: distance 35% · size 25% · config 20% · recency 20%. Top-matched comps best support the ARV.
Projected returns pro-forma
-3.0% appreciation · 3.0% rent growth · sell at horizon
- IRR
- 80.5%
- Equity multiple
- 4.68×
- Total profit
- $41,151
- Equity at exit
- $5,949
- IRR
- 83.9%
- Equity multiple
- 9.70×
- Total profit
- $97,201
- Equity at exit
- $3,450
Cash invested: $11,172 (down + closing). Projections, not guarantees.
Landlord ↔ Tenant lean methodology
- Overall (STATE)
- 62 Landlord-Friendly
- State Pennsylvania
- 62 Landlord-Friendly · EVEN
- County
- — inherits STATE
- City
- — inherits STATE
ZIP-level market 16117
- Home prices YoY
- -7.5%
- Active inventory
- 53
- Price-to-rent
- 2.6×
Monthly cashflow live
- Estimated rent
- $1,295 medium interval (Pro) →
- Mortgage (P&I)
- −$209
- Tax est. 1.5%
- −$50 /mo · $598/yr
- Insurance
- −$17
- HOA
- −$0
- Vacancy / Maint / Mgmt
- −$272
- Net cashflow
- $747
Break-even live
Sensitivity live
| Price | -10% $775 | -5% $761 | +0% $747 | +5% $734 | +10% $720 |
|---|---|---|---|---|---|
| Rent | -10% $645 | -5% $696 | +0% $747 | +5% $798 | +10% $850 |
| Rate | -1.0pp $767 | -0.5pp $757 | base $747 | +0.5pp $737 | +1.0pp $726 |
UW: 25.0% down · 7.5% · 30yr · 1.5% tax · 5.0% vac · 8.0% maint · 8.0% mgmt
Financing live
Cash to close
- Down payment
- $9,975
- Closing costs
- $1,197
- Reserves months
- —
- Total cash needed
- —
Loan-product check · same deal, 3 products live
Conventional
25% down · 7.5% · 30yr
- Down + closing
- —
- Monthly P&I
- —
- Monthly cashflow
- —
- DSCR
- —
- Eligible?
- —
Personal DTI + credit; lowest rate.
DSCR
20% down · 8.5% · 30yr
- Down + closing
- —
- Monthly P&I
- —
- Monthly cashflow
- —
- DSCR
- —
- Eligible?
- —
No personal income docs; deal must DSCR.
Hard money
10% down · 12.0% · 12mo
- Down + closing
- —
- Monthly P&I
- —
- Monthly cashflow
- —
- DSCR
- —
- Eligible?
- —
Short-term bridge; refi at stabilization.
Rent comps 1 comps
| Address | Beds | Baths | Sqft | Rent | $/sqft | DOM | Units | Dist |
|---|---|---|---|---|---|---|---|---|
| 412 Wayne Ave Ellwood City, PA | 4.0 | 1.0 | 2200 | $1,295 | $0.59 | 9d | 1 | 0.78mi |
Listing history 18 events
-
2026-06-22days on market $39,900 Active 187 DOM
-
2026-06-19days on market $39,900 Active 184 DOM
-
2026-06-18days on market $39,900 Active 183 DOM
-
2026-06-17days on market $39,900 Active 182 DOM
-
2026-06-16days on market $39,900 Active 181 DOM
-
2026-06-15days on market $39,900 Active 180 DOM
-
2026-06-14days on market $39,900 Active 178 DOM
-
2026-06-12days on market $39,900 Active 177 DOM
-
2026-06-09days on market $39,900 Active 174 DOM
-
2026-06-08days on market $39,900 Active 173 DOM
-
2026-06-07days on market $39,900 Active 172 DOM
-
2026-06-03days on market $39,900 Active 168 DOM
-
2026-06-02days on market $39,900 Active 167 DOM
-
2026-06-01days on market $39,900 Active 166 DOM
-
2026-05-31days on market $39,900 Active 165 DOM
-
2026-05-30days on market $39,900 Active 164 DOM
-
2025-12-15$39,900 Active 324-char remark
Show marketing remark (324 chars)
Bring your vision and tools! This 3-bedroom, 1-bath home offers a chance to create value through a complete renovation. Property is cash only and sold as-is, with extensive work needed. Features include a detached one-car garage and newer roofs on the house and garage. Perfect project for seasoned investors or contractors.
-
1999-08-11soldstatus $57,500
ⓘ Source: listings_history table (triggers on properties + properties_extension) + one-shot
backfill from property_details.listing_events for pre-trigger history.
Climate risk First Street
- Flood 1/10 Low FEMA zone X (unshaded) · 0% chance over 30 yrs
- Wildfire 1/10 Low
- Heat 3/10 Moderate 7 d/yr ≥97°F today · 18 d/yr by 30 yrs out
- Wind 1/10 Low 0% chance of damaging wind over 30 yrs
- Air quality 3/10 Moderate 2 unhealthy d/yr today · 3 by 30 yrs out
Nearby sold comps map
Loading sold comps map…
Walkable amenities ~0.75 mi
Loading nearby amenities…
Taxation est. · year 1
- Rental income
- $15,540
- − Mortgage interest
- −$2,235
- − Property taxes
- −$598
- − Insurance
- −$200
- − Repairs & maintenance
- −$1,243
- − Management
- −$1,243
- − Depreciation
- −$1,161
- Taxable income
- $8,860
- Est. tax owed @ 24.0%
- −$2,126
- After-tax cash flow
- $6,841/yr
For passive investors: Depreciation is non-cash, so a rental often shows a tax loss while cash-flowing — sheltering income. Rental losses are passive: they offset passive income freely, and up to $25,000/yr can offset ordinary (W-2) income if you actively participate and your MAGI is under $100k (phasing out to $0 by $150k); unused losses carry forward. On sale, claimed depreciation is recaptured at up to 25%, and gains may owe capital-gains tax (a 1031 exchange can defer both). Figures are a year-1 estimate at your 24.0% rate — not tax advice; consult a CPA.
Schools (NCES district)
- District
- Ellwood City Area SD
- NCES district ID
- 4209240
- Math proficiency
- 28% ▼ -17.00%
- Reading proficiency
- 56% ▼ -14.00%
- Median HH income
- $44,230
- Composite
- 35.49/100
- National rank
- #4921
- State rank
- #334 of 539 in PA
Livability — Ellwood City
- Score
- 72/100
- State rank
- #610
- US rank
- #5866
Category grades
Schools grade is shown separately in the Schools card above.
Census & demographics
- Census place
- Ellwood City, PA
- Population (ZIP)
- 16,013
Population outlook (Lawrence County) Hauer SSP2
- Today (2025)
- 81,781 people
- By 2030
- 77,978 · -4.7%
- By 2040
- 69,522 · -15.0%
- By 2050
- 61,344 · -25.0%
- By 2075
- 45,027 · -44.9%
- By 2100
- 31,305 · -61.7%
Race, ethnicity, and origin ACS 2023
- Neighborhood character
- Predominantly White (95%)
- Race & ethnicity
- White 95% Two or more races 3% Hispanic / Latino 2%
- Common ancestry
- Romanian 6% Serbian 3% Lithuanian 2%
- Foreign-born
- 1%
- Languages at home
- 97% English-only · Spanish 2%
Political lean MEDSL · Lawrence
- 2024 margin
- Solid R (+33.8) · D 32.8% · R 66.5%
- 2008→2024 swing
- -28.7pp toward R · 2008: -5.1pp · 2024: -33.8pp
- All cycles
- 2024: R+33.8 2020: R+29.6 2016: R+28.1 2012: R+9.0 2008: R+5.1
Not yet ingested
- Civics
- —
Market trends
- HPI YoY
- ▼ -20.81%
- Current HPI
- 257.3336
- Rent YoY
- —
- Metro
- —
- State GDP YoY
- ▲ 1.68%
- F500 in state
- 34
Industry mix (Fortune 500 HQ in PA)
| Industry | F500 HQs | Revenue |
|---|---|---|
| Healthcare | 2 | $309B |
|
||
| Insurance | 2 | $27B |
|
||
| Telecommunications / Media | 1 | $124B |
|
||
| Industrial Distribution | 1 | $22B |
|
||
| Financial Services | 1 | $20B |
|
||
| Chemicals / Materials | 1 | $18B |
|
||
Price history
-30.6% since first listed2 events — show timeline
- 2025-12-15 Listed $39,900 West Penn MLS
- 1999-08-11 Sold (Public Records) $57,500 Public Records
Property tax history
+2.6%/yrLatest (2025): $2,018 · +3.8% YoY. Source: county tax records.
Cash-flow waterfall
monthlySold comps — $/sqft
last 12 mo · ≤1 miLoading sold comps…