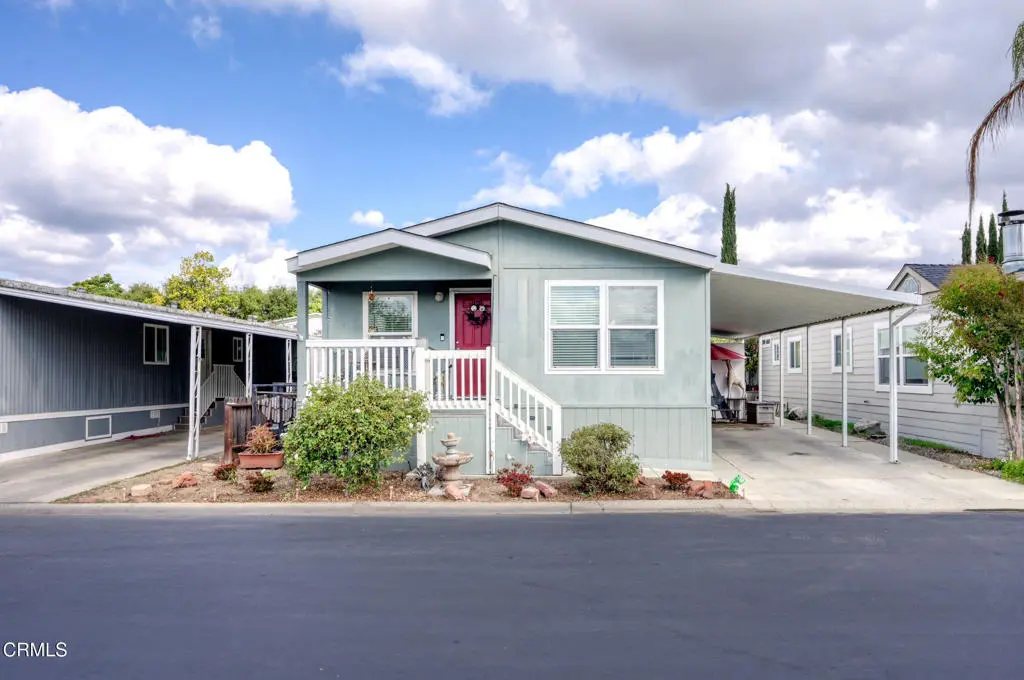
950 Woodland Ave #26 · Mira Monte, CA
Flood risk 1/10 · Minimal
- FEMA flood zone
- X (unshaded)
- Chance of flooding over 30 yrs
- 0.0%
- Est. flood insurance / yr
- $507 – $1,088
Fire risk 5/10 · Moderate
- Est. fire insurance / yr
- $659 – $1,223
Heat risk 5/10 · Moderate
- Hot days now (above 96°F)
- 7 days/yr
- Hot days in 30 yrs
- 18 days/yr
Wind risk 1/10 · Minimal
- Chance of severe wind over 30 yrs
- —
Air-quality risk 8/10 · Major
- Unhealthy air days now
- 12 days/yr
- Unhealthy air days in 30 yrs
- 12 days/yr
Risk factors via First Street. Map © Google.
Why this score? — see what drove the C- grade
The composite is a weighted blend of 9 inputs, each scored 0–100. Each bar is that input's sub-score; the figure is the points it added to the 100-point composite (weight × sub-score).
- Cash flow +25.6/30.0
- DSCR +8.5/10.0
- 1% rule +5.4/10.0
- Schools +3.2/10.0
- Livability +3.2/5.0
- Rent growth +2.5/5.0
- Condition / age +2.5/5.0
- ARV discount +0.0/15.0
- Appreciation +0.0/10.0
$399,990
🖨 Deal sheet (PDF) 📄 Offer letter ✓ Due diligence
Listing remarks MLS
Built in 2015, this move-in-ready 3-bedroom, 2-bath retreat is located in the premium all-ages community of Ojai Oaks Village. Just steps from the pool and spa, this home offers a relaxed, vacation-like lifestyle. Enjoy a wonderful open floor plan designed for comfortable living. Laminate/tile flooring flows throughout the main living areas, and the charming front porch invites quiet moments overlooking the peaceful surroundings. French doors open to the den -- an ideal flex space that can serve as a 3rd bedroom, home office, guest room, or hobby area. The home features fresh landscaping and a brand-new carport awning to protect your vehicle. As a resident of Ojai Oaks Village, you'll have access to a pool, spa, clubhouse, billiard room, and beautifully maintained gas-lit pathways. The property sits adjacent to a scenic trail winding through oak groves, offering a serene natural backdrop and effortless access to outdoor enjoyment. Despite the tranquil setting, you'll be just minutes from Downtown Ojai's shops, restaurants, galleries, and cultural venues. Lake Casitas is also nearby, providing wonderful options for lakeside recreation. Combining modern finishes, resort-style amenities, and a prime Ojai location, 12 minutes beach, this home offers a rare opportunity in today's manufactured housing market.
Key facts
- Open floor plan
- Charming front porch
- Flex space
Tags
Neighborhood map
What this means for you Summary
Snapshot
- This is a 3-bed/2.0-bath manufactured listed at $400k.
Deal economics
- At list price, monthly cash flow is $942 ($11k/yr) — positive.
- The deal already cash-flows at list — no discount required.
- Meets the 1% rule at list price ($4k rent vs $400k).
- Recommended offer: $376k (6.0% below list) — sets the bar for market timing.
- Cap rate 9.1% vs local median 3.2% in Mira Monte — top-decile yield for the area; either an underpriced asset or a hidden risk that comps aren't pricing in. Stress-test before assuming the spread holds.
Location & tenants
- Location reads 64/100 on livability (#401 in CA) — a middle-class / working-renter tenant base. Strengths: commute A+, employment A+, crime A-; Watch: amenities F, cost of living F.
- Ojai Unified (suburban): math 27% / reading 43% proficiency, ranked #257 of 517 in CA (top 50%) — families likely to look elsewhere, expect single-tenant / working-renter base with shorter leases.
- Market conditions: 135 active listings in the ZIP; 4 comparable units currently listed for rent nearby; rentals at typical pace (median 17d on market — plan ~3-4 weeks tenant-placement turnaround); solid renter incomes; 1,759 units permitted in Ventura County in 2024 (1,196 in 5+ unit buildings).
- At $4,147/mo this rent would consume 61% of the median local household income ($81k/yr) (locally 723% of renters already pay >50% of income on rent) — very limited rent-growth headroom before tenants either downsize or default.
Forward outlook
- Local home prices are declining (-3.0%/yr); year-one equity from $3k of loan paydown is wiped out by about $12k of value loss. Plan a longer hold.
- Ventura County population projected at +4% by 2050 — modest demand growth; plan on rents tracking national, not racing it.
Negotiation context
- It's been on market 89 days — a 6% lower offer ($376k) is reasonable based on typical stale-listing flexibility.
- 8 sale attempts since 11y ago with the ask held roughly flat each time — persistent listings suggest the price (not the market) is what's stuck; bring a comps-based counter.
- Current owner paid $139k; list at $400k implies a 188% gain — meaningful room to come down on a strong offer.
Risks & watch-outs
- Climate carrying-cost: moderate wildfire risk; extreme-heat days projected 7→18/yr by 2055 (HVAC capex compounding) — expect insurance premiums to compound above CPI over the hold.
Questions for the listing agent
- It's been on market 89 days. Have you received any prior offers? Is the seller open to a 6% concession, seller financing, or rate buy-down credit?
- Why hasn't it sold? Are there any deal-killer items the seller is aware of (foundation, flood, title, zoning, code violations)?
- Is there a deadline driving the sale (1031 exchange, divorce, estate, relocation)? That informs how much negotiation room exists.
- Schools are B-rated — typically a magnet for longer-tenancy family renters. What's the average tenant stay here, and is there a school-zone premium baked into asking?
- What's the average days-on-market for RENTAL listings here right now (not sales)? A rising rental-DOM trend means longer vacancies and softer asking-rent achievability than the comps imply.
- What's the recent tenant-quality profile in this submarket — average credit score on applications, eviction rate, late-payment / NSF rate, and stable-employment percentage? A property-management company in the area should have these aggregated.
- How much new for-sale + rental construction is in the pipeline within 1–3 miles? Heavy new supply typically softens prices + rents 12–24 months out; constrained supply supports both.
Investment metrics
- 1% rule
- 1.04% ✓
- Cap rate
- 9.12%
- Cash-on-cash
- 10.10%
- DSCR
- 1.45
- GRM
- 8.0
CMA / ARV
- ARV (median comp)
- $312,644
- List price
- $399,990
- Delta
- 27.94%
- Verdict
- OVERPRICED
- Comps
- 20 within 1.0 mi
Show comp detail 12 sales within ~0.75 mi
| Address | Dist | Beds/Ba | Sqft | Sold | Price | $/sf | Match |
|---|---|---|---|---|---|---|---|
| 110 Don Carlos Way #110 | 0.41mi | 3/2.0 | 1,344 (0%) | 1mo | $300,000 | $223 | 80 |
| 950 Woodland Ave #123 | 0.05mi | 3/2.0 | 1,450 (+8%) | 8mo | $325,000 | $224 | 78 |
| 950 Woodland Ave #115 | 0.06mi | 3/2.0 | 1,488 (+11%) | 6mo | $325,000 | $218 | 74 |
| 11195 N Ventura Ave #17 | 0.39mi | 3/2.0 | 1,236 (-8%) | 4mo | $345,000 | $279 | 65 |
| 950 Woodland Ave #59 | 0.03mi | 2/2.0 (-1) | 1,152 (-14%) | 8mo | $302,500 | $263 | 63 |
| 56 Don Antonio Way #56 | 0.56mi | 2/2.0 (-1) | 1,440 (+7%) | 1mo | $270,000 | $188 | 56 |
| 1273 S Rice Rd #12 | 0.72mi | 3/2.0 | 1,248 (-7%) | 2mo | $410,000 | $329 | 53 |
| 1273 S Rice Rd #55 | 0.72mi | 3/2.0 | 1,232 (-8%) | 3mo | $320,000 | $260 | 50 |
| 11 Don Antonio Way #11 | 0.56mi | 2/2.0 (-1) | 1,248 (-7%) | 9mo | $310,000 | $248 | 50 |
| 1273 S Rice Rd #53 | 0.72mi | 2/2.0 (-1) | 1,272 (-5%) | 5mo | $425,000 | $334 | 48 |
| 16 Don Antonio Way #16 | 0.56mi | 3/2.0 | 1,521 (+13%) | 6mo | $405,000 | $266 | 46 |
| 16 Don Antonio Way | 0.57mi | 3/2.0 | 1,521 (+13%) | 6mo | $405,000 | $266 | 46 |
Match score weights: distance 35% · size 25% · config 20% · recency 20%. Top-matched comps best support the ARV.
Projected returns pro-forma
-3.0% appreciation · 3.0% rent growth · sell at horizon
- IRR
- -1.2%
- Equity multiple
- 0.96×
- Total profit
- $-4,992
- Equity at exit
- $59,640
- IRR
- 8.5%
- Equity multiple
- 1.64×
- Total profit
- $72,124
- Equity at exit
- $34,584
Cash invested: $111,997 (down + closing). Projections, not guarantees.
Landlord ↔ Tenant lean methodology
- Overall (STATE)
- 18 Strongly Tenant-Friendly
- State California
- 18 Strongly Tenant-Friendly · D+13
- County
- — inherits STATE
- City
- — inherits STATE
ZIP-level market 93023
- Active inventory
- 135
- Price-to-rent
- 8.0×
Monthly cashflow live
- Estimated rent
- $4,147 medium interval (Pro) →
- Mortgage (P&I)
- −$2,098
- Tax from tax record
- −$69 /mo · $832/yr
- Insurance
- −$167
- HOA
- −$0
- Vacancy / Maint / Mgmt
- −$871
- Net cashflow
- $942
Break-even live
Sensitivity live
| Price | -10% $1,169 | -5% $1,056 | +0% $942 | +5% $374 | +10% $235 |
|---|---|---|---|---|---|
| Rent | -10% $615 | -5% $779 | +0% $942 | +5% $1,106 | +10% $1,270 |
| Rate | -1.0pp $1,144 | -0.5pp $1,044 | base $942 | +0.5pp $839 | +1.0pp $733 |
UW: 25.0% down · 7.5% · 30yr · 1.5% tax · 5.0% vac · 8.0% maint · 8.0% mgmt
Financing live
Cash to close
- Down payment
- $99,998
- Closing costs
- $12,000
- Reserves months
- —
- Total cash needed
- —
Loan-product check · same deal, 3 products live
Conventional
25% down · 7.5% · 30yr
- Down + closing
- —
- Monthly P&I
- —
- Monthly cashflow
- —
- DSCR
- —
- Eligible?
- —
Personal DTI + credit; lowest rate.
DSCR
20% down · 8.5% · 30yr
- Down + closing
- —
- Monthly P&I
- —
- Monthly cashflow
- —
- DSCR
- —
- Eligible?
- —
No personal income docs; deal must DSCR.
Hard money
10% down · 12.0% · 12mo
- Down + closing
- —
- Monthly P&I
- —
- Monthly cashflow
- —
- DSCR
- —
- Eligible?
- —
Short-term bridge; refi at stabilization.
Rent comps 4 comps
| Address | Beds | Baths | Sqft | Rent | $/sqft | DOM | Units | Dist |
|---|---|---|---|---|---|---|---|---|
| 218 Barbara St Oak View, CA | 3.0 | 2.0 | 1786 | $3,500 | $1.96 | 17d | 1 | 0.65mi |
| 401 Burnham Rd Oak View, CA | 2.0 | 1.0 | 1045 | $3,895 | $3.73 | 3d | 1 | 1.33mi |
| 401 Burnham Rd Unit 1 Oak View, CA | 2.0 | 1.0 | 1450 | $3,795 | $2.62 | 4d | 1 | 1.33mi |
| 718 S La Luna Ave Ojai, CA | 2.0 | 2.0 | 1250 | $3,600 | $2.88 | 45d | 1 | 1.33mi |
Listing history 28 events
-
2026-06-10days on market $399,990 Active 89 DOM
-
2026-06-09days on market $399,990 Active 88 DOM
-
2026-06-08days on market $399,990 Active 87 DOM
-
2026-06-07days on market $399,990 Active 86 DOM
-
2026-06-05days on market $399,990 Active 83 DOM
-
2026-06-03days on market $399,990 Active 82 DOM
-
2026-06-02days on market $399,990 Active 81 DOM
-
2026-06-01days on market $399,990 Active 80 DOM
-
2026-05-31days on market $399,990 Active 79 DOM
-
2026-03-13$399,990 Active 1324-char remark
Show marketing remark (1324 chars)
Built in 2015, this move-in-ready 3-bedroom, 2-bath retreat is located in the premium all-ages community of Ojai Oaks Village. Just steps from the pool and spa, this home offers a relaxed, vacation-like lifestyle. Enjoy a wonderful open floor plan designed for comfortable living. Laminate/tile flooring flows throughout the main living areas, and the charming front porch invites quiet moments overlooking the peaceful surroundings. French doors open to the den -- an ideal flex space that can serve as a 3rd bedroom, home office, guest room, or hobby area. The home features fresh landscaping and a brand-new carport awning to protect your vehicle. As a resident of Ojai Oaks Village, you'll have access to a pool, spa, clubhouse, billiard room, and beautifully maintained gas-lit pathways. The property sits adjacent to a scenic trail winding through oak groves, offering a serene natural backdrop and effortless access to outdoor enjoyment. Despite the tranquil setting, you'll be just minutes from Downtown Ojai's shops, restaurants, galleries, and cultural venues. Lake Casitas is also nearby, providing wonderful options for lakeside recreation. Combining modern finishes, resort-style amenities, and a prime Ojai location, 12 minutes beach, this home offers a rare opportunity in today's manufactured housing market.
-
2026-02-04historical
-
2026-01-20price $429,000
-
2025-11-14price $434,000
-
2025-10-15$459,000 Active
-
2016-09-01soldstatus $139,000 Closed
-
2016-09-01soldstatus $139,000
-
2016-08-25status Pending
-
2016-08-04status Active
-
2016-08-02$139,900
-
2016-07-02status Pending
-
2016-06-24status Backup Offers Accepted
-
2016-05-04status Active
-
2016-05-01historical
-
2016-01-29$139,900 Active
-
2016-01-28price $139,900
-
2016-01-26historical
-
2015-08-02$159,900 Active
-
2015-08-01$139,900
ⓘ Source: listings_history table (triggers on properties + properties_extension) + one-shot
backfill from property_details.listing_events for pre-trigger history.
Tax reassessment forecast CA · Resets to sale price
- Current annual tax
- $832 · $69/mo
- Projected year-2 tax
- $3,040 · $253/mo
- Expected delta
- +$2,207/yr (+$184/mo · 265.2%)
ⓘ Screening estimate from a state-policy table — verify with the county assessor before closing.
Climate risk First Street
- Flood 1/10 Low FEMA zone X (unshaded) · 0% chance over 30 yrs
- Wildfire 5/10 Major
- Heat 5/10 Major 7 d/yr ≥96°F today · 18 d/yr by 30 yrs out
- Wind 1/10 Low
- Air quality 8/10 Severe 12 unhealthy d/yr today · 12 by 30 yrs out
Nearby sold comps map
Loading sold comps map…
Walkable amenities ~0.75 mi
Loading nearby amenities…
Taxation est. · year 1
- Rental income
- $49,763
- − Mortgage interest
- −$22,406
- − Property taxes
- −$832
- − Insurance
- −$2,000
- − Repairs & maintenance
- −$3,981
- − Management
- −$3,981
- − Depreciation
- −$11,636
- Taxable income
- $4,927
- Est. tax owed @ 24.0%
- −$1,182
- After-tax cash flow
- $10,127/yr
For passive investors: Depreciation is non-cash, so a rental often shows a tax loss while cash-flowing — sheltering income. Rental losses are passive: they offset passive income freely, and up to $25,000/yr can offset ordinary (W-2) income if you actively participate and your MAGI is under $100k (phasing out to $0 by $150k); unused losses carry forward. On sale, claimed depreciation is recaptured at up to 25%, and gains may owe capital-gains tax (a 1031 exchange can defer both). Figures are a year-1 estimate at your 24.0% rate — not tax advice; consult a CPA.
Schools (NCES district)
- District
- Ojai Unified
- NCES district ID
- 0628270
- Math proficiency
- 27% ▼ -5.00%
- Reading proficiency
- 43% ▼ -1.00%
- Median HH income
- $67,618
- Composite
- 31.97/100
- National rank
- #5839
- State rank
- #257 of 517 in CA
Livability — Mira Monte
- Score
- 64/100
- State rank
- #401
- US rank
- #13701
Category grades
Schools grade is shown separately in the Schools card above.
Census & demographics
- Census place
- Mira Monte, CA
- County
- Ventura County · 829,955 people
- Metro
- Oxnard-Thousand Oaks-Ventura, CA
- Population (ZIP)
- 21,036
- Household income
- $80,927
- Rent vs Own
- Severe rent burden
- 723.0
Population outlook (Ventura County) Hauer SSP2
- Today (2025)
- 895,754 people
- By 2030
- 912,134 · +1.8%
- By 2040
- 931,454 · +4.0%
- By 2050
- 934,609 · +4.3%
- By 2075
- 924,899 · +3.3%
- By 2100
- 864,712 · -3.5%
Race, ethnicity, and origin ACS 2023
- Neighborhood character
- Predominantly White (71%)
- Race & ethnicity
- White 71% Hispanic / Latino 20% Two or more races 10% Asian 3%
- Hispanic origin (detail)
- Mexican 17%
- Common ancestry
- Slovak 4% Portuguese 3% Italian 2%
- Foreign-born
- 15% · Canada, South Korea
- Languages at home
- 80% English-only · Spanish 15% German/W. Germanic 2% Other Indo-European 1%
Political lean MEDSL · Ventura
- 2024 margin
- D (+15.1) · D 56.1% · R 41.0% · Other 2.9%
- 2008→2024 swing
- +2.8pp toward D · 2008: 12.3pp · 2024: 15.1pp
- All cycles
- 2024: D+15.1 2020: D+21.1 2016: D+16.8 2012: D+5.3 2008: D+12.3
Not yet ingested
- Civics
- —
Market trends
- HPI YoY
- ▼ -942.31%
- Current HPI
- 331.6103
- Rent YoY
- —
- Metro
- Oxnard-Thousand Oaks-Ventura, CA
- State GDP YoY
- ▲ 3.21%
- F500 in state
- 116
Industry mix (Fortune 500 HQ in CA)
| Industry | F500 HQs | Revenue |
|---|---|---|
| Technology | 27 | $1,492B |
|
||
| Financial Services | 3 | $174B |
|
||
| Retail | 3 | $44B |
|
||
| Insurance | 3 | $26B |
|
||
| Media / Entertainment | 2 | $115B |
|
||
| Pharmaceuticals / Biotech | 2 | $62B |
|
||
Price history
+185.9% since first listed19 events — show timeline
- 2026-03-13 Listed $399,990 CRMLS
- 2026-02-04 Listing Removed — CRMLS
- 2026-01-20 Price Changed $429,000 CRMLS
- 2025-11-14 Price Changed $434,000 CRMLS
- 2025-10-15 Listed $459,000 CRMLS
- 2016-09-01 Sold (MLS) $139,000 OVMLS
- 2016-09-01 Sold (MLS) $139,000 CRMLS
- 2016-08-25 Pending — CRMLS
- 2016-08-04 Relisted — CRMLS
- 2016-08-02 Listed $139,900 OVMLS
- 2016-07-02 Pending — CRMLS
- 2016-06-24 Pending — CRMLS
- 2016-05-04 Relisted — CRMLS
- 2016-05-01 Listing Removed — CRMLS
- 2016-01-29 Listed $139,900 CRMLS
- 2016-01-28 Price Changed $139,900 CRMLS
- 2016-01-26 Listing Removed — CRMLS
- 2015-08-02 Listed $159,900 CRMLS
- 2015-08-01 Listed $139,900 OVMLS
Property tax history
+2.1%/yrLatest (2025): $832 · +3.7% YoY. Source: county tax records.
Cash-flow waterfall
monthlySold comps — $/sqft
last 12 mo · ≤1 miLoading sold comps…