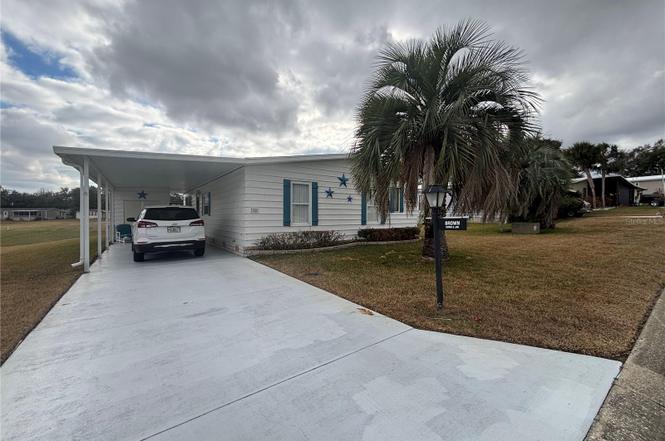
3746 Parway Rd #1349 · Zellwood, FL
Flood risk 7/10 · Major
- FEMA flood zone
- X (unshaded)
- Chance of flooding over 30 yrs
- 0.76%
- Est. flood insurance / yr
- $507 – $1,088
Fire risk 5/10 · Moderate
- Est. fire insurance / yr
- $947 – $1,759
Heat risk 8/10 · Major
- Hot days now (above 108°F)
- 7 days/yr
- Hot days in 30 yrs
- 22 days/yr
Wind risk 9/10 · Severe
- Chance of severe wind over 30 yrs
- 99.0%
Air-quality risk 1/10 · Minimal
- Unhealthy air days now
- 0 days/yr
- Unhealthy air days in 30 yrs
- 0 days/yr
Risk factors via First Street. Map © Google.
Why this score? — see what drove the B- grade
The composite is a weighted blend of 9 inputs, each scored 0–100. Each bar is that input's sub-score; the figure is the points it added to the 100-point composite (weight × sub-score).
- Cash flow +28.0/30.0
- DSCR +9.9/10.0
- 1% rule +9.4/10.0
- Appreciation +6.3/10.0
- Schools +4.1/10.0
- Livability +3.8/5.0
- Rent growth +2.5/5.0
- Condition / age +2.5/5.0
- ARV discount +0.0/15.0
$170,000
🖨 Deal sheet 📄 Offer letter ✓ Due diligence
Listing remarks
Welcome to Zellwood Station! This 2-bedroom, 2-bath home boasts beautiful backyard views of the golf course in the prestigious 55+ resident-owned Zellwood Station Golf Community. The spacious 18x27 living and dining area is perfect for entertaining, with windows across the front and access to a screened side porch overlooking the course. The dining area features a built-in china cabinet, while the roomy 19x16 kitchen offers a built-in island for extra seating, a convenient desk, and a 4x4 pantry. Enjoy the indoor laundry room with washer and dryer. The primary suite measures 13x15 and includes a walk-in closet and ensuite with walk-in shower, while the guest bedroom is 10x13. A covered carp
Key facts
- Screened side porch
- Built-in island
- Indoor laundry room
Tags
Property features AI
Finance
- Financial info: Lease restrictions apply; Total annual fees $4,980 (monthly $415)
- HOA & community: Has HOA (monthly fee $415); Association requires approval; Association includes 24-hour guard, cable TV, internet, electricity, pool, common area taxes, maintenance (grounds & structure), escrow reserves; Community amenities: clubhouse, fitness center, gated community, golf course, pickleball, tennis, shuffleboard, pool, trails, street lights; vehicle restrictions in place; Senior community; Pets not allowed
Exterior
- Parking: Tandem parking; Carport (1 space)
- Utilities: Public water; Public sewer; Cable connected; Electricity connected; Water connected
- Home design: Manufactured home (double wide); One story; Faces north
- Construction: Brick and vinyl siding construction; Shingle roof; Crawlspace foundation; Built as a double wide manufactured home
- Exterior features: Storage; Near golf course; Paved lot/drive
Interior
- Kitchen: Dishwasher; Range; Range hood; Refrigerator; Disposal; Electric water heater
- Bedrooms: 2 bedrooms
- Flooring: Carpet; Laminate
- Bathrooms: 2 full bathrooms
- Heating & cooling: Central heating (electric); Central air conditioning
- Interior features: Ceiling fans; High ceilings; Living room and dining room combo
- Laundry & utility: Washer; Dryer; Laundry inside
Neighborhood map
What this means for you Summary
Snapshot
- This is a 2-bed/2.0-bath manufactured listed at $170k.
Deal economics
- At list price, monthly cash flow is $463 ($6k/yr) — positive.
- The deal already cash-flows at list — no discount required.
- Meets the 1% rule at list price ($2k rent vs $170k).
- Recommended offer: $150k (12.0% below list) — sets the bar for market timing.
Location & tenants
- Location reads 75/100 on livability (#248 in FL, #3,918 nationally) — a middle-class / working-renter tenant base. Strengths: crime A+, cost of living A+, housing A+; Watch: schools D+, amenities F, commute D-.
- Orange (suburban): math 46% / reading 51% proficiency, ranked #43 of 73 in FL (top 59%) — families likely to look elsewhere, expect single-tenant / working-renter base with shorter leases.
- Market conditions: 103 active listings in the ZIP; 1 comparable units currently listed for rent nearby; 8,053 units permitted in Orange County in 2024 (3,133 in 5+ unit buildings).
Forward outlook
- In year one you build about $5k of equity ($1k loan paydown + $4k appreciation (2.5% local appreciation)).
- Orange County population projected at +52% by 2050 — long-run rental-demand tailwind backs the buy-and-hold thesis.
- At projected returns (2.5% appreciation + 3.0% rent growth), your $48k cash investment doubles in ~4 years — after that, you're playing with house money.
- By year 7, paydown + projected appreciation supports a ~$34k cash-out refi (75% LTV) — recoverable capital for the next deal without selling this one.
Negotiation context
- It's been on market 121 days — a 12% lower offer ($150k) is reasonable based on typical stale-listing flexibility.
Risks & watch-outs
- Watch-outs: flood insurance adds $66/mo.
- Climate carrying-cost: major flood risk; severe wind risk, 99% chance of damaging wind over 30y; moderate wildfire risk; extreme-heat days projected 7→22/yr by 2055 (HVAC capex compounding) — expect insurance premiums to compound above CPI over the hold.
Questions for the listing agent
- It's been on market 121 days. Have you received any prior offers? Is the seller open to a 12% concession, seller financing, or rate buy-down credit?
- What's the actual annual flood-insurance premium (NFIP or private), and is the property in a SFHA with mandatory coverage?
- What does the HOA fee cover, when was the last increase, and are there any pending special assessments or reserve-fund shortfalls?
- Why hasn't it sold? Are there any deal-killer items the seller is aware of (foundation, flood, title, zoning, code violations)?
- Is there a deadline driving the sale (1031 exchange, divorce, estate, relocation)? That informs how much negotiation room exists.
- Schools are D-rated, which usually means shorter tenancies and higher turnover. Who's the typical renter profile here, and what's been the actual vacancy rate?
- What's the average days-on-market for RENTAL listings here right now (not sales)? A rising rental-DOM trend means longer vacancies and softer asking-rent achievability than the comps imply.
- What's the recent tenant-quality profile in this submarket — average credit score on applications, eviction rate, late-payment / NSF rate, and stable-employment percentage? A property-management company in the area should have these aggregated.
- How much new for-sale + rental construction is in the pipeline within 1–3 miles? Heavy new supply typically softens prices + rents 12–24 months out; constrained supply supports both.
Investment metrics
- 1% rule
- 1.44% ✓
- Cap rate
- 10.03%
- Cash-on-cash
- 13.34%
- DSCR
- 1.59
- GRM
- 5.8
CMA / ARV
- ARV (on-the-fly)
- $144,342
- Comps found
- 5
Show comp detail 5 sales within ~0.75 mi
| Address | Dist | Beds/Ba | Sqft | Sold | Price | $/sf | Match |
|---|---|---|---|---|---|---|---|
| 3644 Parway Rd #1149 | 0.12mi | 2/2.0 | 1,538 (+6%) | 1mo | $235,000 | $153 | 85 |
| 3768 Diamond Oak Way #626 | 0.20mi | 2/2.0 | 1,312 (-10%) | 9mo | $145,200 | $111 | 66 |
| 3749 Cohen Dr #720 | 0.35mi | 2/2.0 | 1,602 (+10%) | 13mo | $147,000 | $92 | 56 |
| 3500 Blossom Cir #1497 | 0.58mi | 2/2.0 | 1,656 (+14%) | 1mo | $112,500 | $68 | 49 |
| 3366 Evergreen Rd #1701 | 0.59mi | 2/2.0 | 1,248 (-14%) | 3mo | $124,000 | $99 | 46 |
Match score weights: distance 35% · size 25% · config 20% · recency 20%. Top-matched comps best support the ARV.
Projected returns pro-forma
2.5% appreciation · 3.0% rent growth · sell at horizon
- IRR
- 17.3%
- Equity multiple
- 1.96×
- Total profit
- $45,724
- Equity at exit
- $71,724
- IRR
- 19.2%
- Equity multiple
- 3.68×
- Total profit
- $127,444
- Equity at exit
- $107,000
Cash invested: $47,600 (down + closing). Projections, not guarantees.
Landlord ↔ Tenant lean methodology
- Overall (STATE)
- 87 Strongly Landlord-Friendly
- State Florida
- 87 Strongly Landlord-Friendly · R+3
- County
- — inherits STATE
- City
- — inherits STATE
ZIP-level market 32798
- Home prices YoY
- 1.0%
- Active inventory
- 103
- Price-to-rent
- 5.8×
Monthly cashflow live
- Estimated rent
- $2,450 medium interval (Pro) →
- Mortgage (P&I)
- −$891
- Tax from tax record
- −$29 /mo · $350/yr
- Insurance
- −$71
- Flood insurance flood zone
- −$66 /mo · $798/yr
- HOA
- −$415
- Vacancy / Maint / Mgmt
- −$514
- Net cashflow
- $463
Break-even live
UW: 25.0% down · 7.5% · 30yr · 1.5% tax · 5.0% vac · 8.0% maint · 8.0% mgmt
Financing live
Cash to close
- Down payment
- $42,500
- Closing costs
- $5,100
- Reserves months
- —
- Total cash needed
- —
Loan-product check · same deal, 3 products live
Conventional
25% down · 7.5% · 30yr
- Down + closing
- —
- Monthly P&I
- —
- Monthly cashflow
- —
- DSCR
- —
- Eligible?
- —
Personal DTI + credit; lowest rate.
DSCR
20% down · 8.5% · 30yr
- Down + closing
- —
- Monthly P&I
- —
- Monthly cashflow
- —
- DSCR
- —
- Eligible?
- —
No personal income docs; deal must DSCR.
Hard money
10% down · 12.0% · 12mo
- Down + closing
- —
- Monthly P&I
- —
- Monthly cashflow
- —
- DSCR
- —
- Eligible?
- —
Short-term bridge; refi at stabilization.
Rent comps 1 comps
| Address | Beds | Baths | Sqft | Rent | $/sqft | DOM | Units | Dist |
|---|---|---|---|---|---|---|---|---|
| 3875 Denali Dr Apopka, FL | 3.0 | 2.5 | 1734 | $2,450 | $1.41 | 21d | 1 | 1.31mi |
HOA detail
- Monthly dues
- $415 · $4,980/yr
Listing history 16 events
-
2026-06-18days on market $170,000 Active 121 DOM
-
2026-06-17days on market $170,000 Active 120 DOM
-
2026-06-16days on market $170,000 Active 119 DOM
-
2026-06-15days on market $170,000 Active 118 DOM
-
2026-06-13days on market $170,000 Active 116 DOM
-
2026-06-13days on market $170,000 Active 115 DOM
-
2026-06-09days on market $170,000 Active 112 DOM
-
2026-06-08days on market $170,000 Active 111 DOM
-
2026-06-07days on market $170,000 Active 110 DOM
-
2026-06-04days on market $170,000 Active 107 DOM
-
2026-06-03days on market $170,000 Active 106 DOM
-
2026-06-02days on market $170,000 Active 105 DOM
-
2026-06-02days on market $170,000 Active 104 DOM
-
2026-05-31days on market $170,000 Active 103 DOM
-
2026-04-28price $170,000
-
2026-02-17$182,500 Active
ⓘ Source: listings_history table (triggers on properties + properties_extension) + one-shot
backfill from property_details.listing_events for pre-trigger history.
Tax reassessment forecast FL · Resets to sale price
- Current annual tax
- $350 · $29/mo
- Projected year-2 tax
- $1,411 · $118/mo
- Expected delta
- +$1,061/yr (+$88/mo · 302.7%)
ⓘ Screening estimate from a state-policy table — verify with the county assessor before closing.
Climate risk First Street
- Flood 7/10 Severe FEMA zone X (unshaded) · 76% chance over 30 yrs
- Wildfire 5/10 Major
- Heat 8/10 Severe 7 d/yr ≥108°F today · 22 d/yr by 30 yrs out
- Wind 9/10 Extreme 99% chance of damaging wind over 30 yrs
- Air quality 1/10 Low 0 unhealthy d/yr today · 0 by 30 yrs out
Nearby sold comps map
Loading sold comps map…
Walkable amenities ~0.75 mi
Loading nearby amenities…
Taxation est. · year 1
- Rental income
- $29,400
- − Mortgage interest
- −$9,523
- − Property taxes
- −$350
- − Insurance
- −$1,648
- − Repairs & maintenance
- −$2,352
- − Management
- −$2,352
- − HOA
- −$4,980
- − Depreciation
- −$4,945
- Taxable income
- $3,250
- Est. tax owed @ 24.0%
- −$780
- After-tax cash flow
- $4,770/yr
For passive investors: Depreciation is non-cash, so a rental often shows a tax loss while cash-flowing — sheltering income. Rental losses are passive: they offset passive income freely, and up to $25,000/yr can offset ordinary (W-2) income if you actively participate and your MAGI is under $100k (phasing out to $0 by $150k); unused losses carry forward. On sale, claimed depreciation is recaptured at up to 25%, and gains may owe capital-gains tax (a 1031 exchange can defer both). Figures are a year-1 estimate at your 24.0% rate — not tax advice; consult a CPA.
Schools (NCES district)
- District
- Orange
- NCES district ID
- 1201440
- Math proficiency
- 46% ▼ -9.00%
- Reading proficiency
- 51% ▼ -2.00%
- Median HH income
- $49,350
- Composite
- 41.47/100
- National rank
- #3461
- State rank
- #43 of 73 in FL
Livability — Zellwood
- Score
- 75/100
- State rank
- #248
- US rank
- #3918
Category grades
Schools grade is shown separately in the Schools card above.
Census & demographics
- Census place
- Zellwood, FL
- City population
- 2,159
- Population (ZIP)
- 2,159
Population outlook (Orange County) Hauer SSP2
- Today (2025)
- 1,618,226 people
- By 2030
- 1,787,404 · +10.5%
- By 2040
- 2,125,621 · +31.4%
- By 2050
- 2,454,016 · +51.6%
- By 2075
- 3,173,711 · +96.1%
- By 2100
- 3,607,781 · +122.9%
Race, ethnicity, and origin ACS 2023
- Neighborhood character
- Predominantly White (86%)
- Race & ethnicity
- White 86% Hispanic / Latino 10% Two or more races 8%
- Hispanic origin (detail)
- Puerto Rican 10%
- Common ancestry
- Iranian 5% Lithuanian 5% Romanian 2%
- Foreign-born
- 5%
- Languages at home
- 89% English-only · Spanish 9% German/W. Germanic 3%
Political lean MEDSL · Orange
- 2024 margin
- D (+13.6) · D 56.1% · R 42.5% · Other 1.3%
- 2008→2024 swing
- -5.0pp toward R · 2008: 18.6pp · 2024: 13.6pp
- All cycles
- 2024: D+13.6 2020: D+23.1 2016: D+24.6 2012: D+18.2 2008: D+18.6
Not yet ingested
- Civics
- —
Market trends
- HPI YoY
- ▲ 2.50%
- Current HPI
- 254.7681
- Rent YoY
- —
- Metro
- —
- State GDP YoY
- ▲ 3.28%
- F500 in state
- 36
Industry mix (Fortune 500 HQ in FL)
| Industry | F500 HQs | Revenue |
|---|---|---|
| Industrial Technology | 2 | $29B |
|
||
| Insurance | 2 | $17B |
|
||
| Retail | 1 | $60B |
|
||
| Technology Distribution | 1 | $58B |
|
||
| Homebuilding | 1 | $35B |
|
||
| Technology Manufacturing | 1 | $35B |
|
||
Price history
-6.8% since first listed2 events — show timeline
- 2026-04-28 Price Changed $170,000 Stellar MLS as Distributed by MLS Grid
- 2026-02-17 Listed $182,500 Stellar MLS as Distributed by MLS Grid
Property tax history
+0.3%/yrLatest (2025): $350 · +6.3% YoY. Source: county tax records.
Cash-flow waterfall
monthlySold comps — $/sqft
last 12 mo · ≤1 miLoading sold comps…