 🏷️ Likely Rental
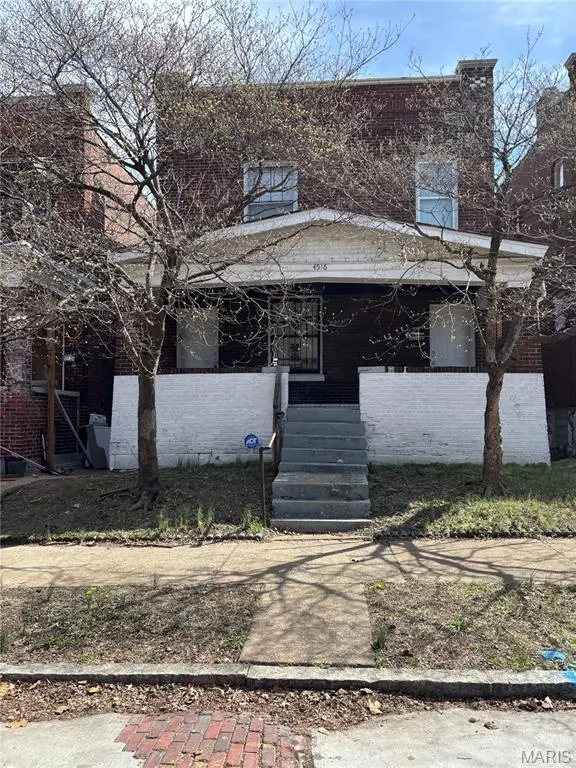
4516 Pennsylvania Ave · St. Louis, MO
Flood risk 1/10 · Minimal
- FEMA flood zone
- X (unshaded)
- Chance of flooding over 30 yrs
- 0.0%
- Est. flood insurance / yr
- $473 – $860
Fire risk 1/10 · Minimal
- Est. fire insurance / yr
- $1,054 – $1,958
Heat risk 5/10 · Moderate
- Hot days now (above 108°F)
- 7 days/yr
- Hot days in 30 yrs
- 21 days/yr
Wind risk 2/10 · Minimal
- Chance of severe wind over 30 yrs
- 1.0%
Air-quality risk 3/10 · Minor
- Unhealthy air days now
- 3 days/yr
- Unhealthy air days in 30 yrs
- 4 days/yr
Risk factors via First Street. Map © Google.
Why this score? — see what drove the B grade
The composite is a weighted blend of 9 inputs, each scored 0–100. Each bar is that input's sub-score; the figure is the points it added to the 100-point composite (weight × sub-score).
- Cash flow +30.0/30.0
- ARV discount +15.0/15.0
- 1% rule +10.0/10.0
- DSCR +10.0/10.0
- Rent growth +3.3/5.0
- Livability +2.5/5.0
- Condition / age +2.5/5.0
- Schools +1.2/10.0
- Appreciation +0.0/10.0
$75,000
🖨 Deal sheet 📄 Offer letter ✓ Due diligence
Multi-family units
County records classify this as Multi-Family (2-4 Unit). Listing-text estimate: 1 unit. estimate disagrees with records
Listing remarks MLS
This 2,000+ sq ft property offers two spacious units with strong rental potential after updates. The first-floor unit is a large 1-bedroom with separate living and dining areas, oversized closets, and eat-in kitchen. The second-floor unit provides an opportunity to reconfigure into a true 2-bedroom, featuring a living room, dining room, eat-in kitchen, bedroom, and large bonus room. Additional features include a full shared basement and newer rear deck (2023) and stairs. With light to moderate rehab, projected rents are: 1st floor: $500–$700 2nd floor: $600–$850 Ideal for investors looking to add value, increase rents, and build equity. Convenient access to Highway 55 enhances tenant appeal.
Key facts
- Two spacious units
- Newer rear deck
- Full shared basement
Tags
Neighborhood map
What this means for you Summary
Snapshot
- This is a 3-bed/2.0-bath multifamily listed at $75k.
Deal economics
- At list price, monthly cash flow is $973 ($12k/yr) — positive.
- The deal already cash-flows at list — no discount required.
- Meets the 1% rule at list price ($2k rent vs $75k).
- Recommended offer: $70k (6.0% below list) — sets the bar for market timing.
- Cap rate 21.9% vs local median 5.0% in St. Louis — top-decile yield for the area; either an underpriced asset or a hidden risk that comps aren't pricing in. Stress-test before assuming the spread holds.
Location & tenants
- Location reads: area grade B — affects rentability + tenant quality, not the cash-flow math above.
- St. Louis City (urban): math 10% / reading 18% proficiency, ranked #312 of 324 in MO (top 96%) — low school quality limits family demand, transient renter base, plan for 1-2y turnover; 80% free/reduced lunch — lower-income household profile, screen leases tightly.
- Market conditions: Rents rising (+3.3%/yr); 125 active listings in the ZIP; 19 comparable units currently listed for rent nearby; rentals at typical pace (median 20d on market — plan ~3-4 weeks tenant-placement turnaround); 294 units permitted in St. Louis city in 2024 (227 in 5+ unit buildings).
- At $1,870/mo this rent would consume 48% of the median local household income ($47k/yr) (locally 1364% of renters already pay >50% of income on rent) — very limited rent-growth headroom before tenants either downsize or default.
Forward outlook
- Local home prices are declining (-3.0%/yr); year-one equity from $519 of loan paydown is wiped out by about $2k of value loss. Plan a longer hold.
- St. Louis County population projected to shrink 6% by 2050 — rents likely to lag national; underwrite the cash flow, not the appreciation.
- At projected returns (-3.0% appreciation + 3.3% rent growth), your $21k cash investment doubles in ~3 years — after that, you're playing with house money.
Negotiation context
- It's been on market 86 days — a 6% lower offer ($70k) is reasonable based on typical stale-listing flexibility.
- 6 sale attempts since 6y ago; this cycle's ask has dropped $15k (17%) from the opening price — seller is motivated, your offer sets the floor, not the list.
Risks & watch-outs
- Watch-outs: built in 1923 — expect roof / HVAC / electrical / plumbing capex.
- Climate carrying-cost: extreme-heat days projected 7→21/yr by 2055 (HVAC capex compounding) — expect insurance premiums to compound above CPI over the hold.
Questions for the listing agent
- It's been on market 86 days. Have you received any prior offers? Is the seller open to a 6% concession, seller financing, or rate buy-down credit?
- Built in 1923 — when were the roof, HVAC, electrical panel, plumbing, and water heater last replaced?
- Why hasn't it sold? Are there any deal-killer items the seller is aware of (foundation, flood, title, zoning, code violations)?
- Is there a deadline driving the sale (1031 exchange, divorce, estate, relocation)? That informs how much negotiation room exists.
- What's the average days-on-market for RENTAL listings here right now (not sales)? A rising rental-DOM trend means longer vacancies and softer asking-rent achievability than the comps imply.
- What's the recent tenant-quality profile in this submarket — average credit score on applications, eviction rate, late-payment / NSF rate, and stable-employment percentage? A property-management company in the area should have these aggregated.
- How much new apartment / multifamily construction is in the pipeline within 1–3 miles? Heavy new supply (>2% of stock underway) typically softens rents 12–24 months out; light construction supports rent growth.
Investment metrics
- 1% rule
- 2.49% ✓
- Cap rate
- 21.86%
- Cash-on-cash
- 55.59%
- DSCR
- 3.47
- GRM
- 3.3
CMA / ARV
- ARV (median comp)
- $145,354
- List price
- $75,000
- Delta
- -48.40%
- Verdict
- UNDERPRICED
- Comps
- 20 within 1.0 mi
Show comp detail 12 sales within ~0.75 mi
| Address | Dist | Beds/Ba | Sqft | Sold | Price | $/sf | Match |
|---|---|---|---|---|---|---|---|
| 4443 Minnesota Ave | 0.12mi | 3/2.0 | 2,236 (+4%) | 12mo | $139,000 | $62 | 77 |
| 2921 Mount Pleasant St | 0.08mi | 2/2.0 (-1) | 2,014 (-6%) | 12mo | $130,000 | $65 | 72 |
| 4308 Nebraska Ave | 0.27mi | 2/2.0 (-1) | 2,024 (-5%) | 3mo | $139,999 | $69 | 71 |
| 4536 S Compton | 0.19mi | 4/2.0 (+1) | 2,304 (+8%) | 12mo | $184,900 | $80 | 63 |
| 4025 Nebraska Ave | 0.61mi | 2/2.0 (-1) | 2,146 (+0%) | 9mo | $45,000 | $21 | 58 |
| 329 Eichelberger St | 0.62mi | 4/— (+1) | 2,190 (+2%) | 8mo | $13,000 | $6 | 56 |
| 5042 Louisiana Ave | 0.68mi | 4/2.0 (+1) | 2,196 (+3%) | 8mo | $179,000 | $82 | 52 |
| 5044 Louisiana Ave | 0.68mi | 4/2.0 (+1) | 2,196 (+3%) | 8mo | $179,000 | $82 | 52 |
| 507 Eiler St | 0.70mi | 4/2.0 (+1) | 2,016 (-6%) | 4mo | $129,900 | $64 | 49 |
| 5222 Louisiana Ave | 0.75mi | 2/2.0 (-1) | 2,100 (-2%) | 13mo | $115,000 | $55 | 46 |
| 4676 S Grand Blvd | 0.62mi | 4/2.0 (+1) | 2,400 (+12%) | 12mo | $99,900 | $42 | 36 |
| 3652 Marceline Ter | 0.72mi | 4/2.0 (+1) | 2,422 (+13%) | 13mo | $150,000 | $62 | 28 |
Match score weights: distance 35% · size 25% · config 20% · recency 20%. Top-matched comps best support the ARV.
Projected returns pro-forma
-3.0% appreciation · 3.27% rent growth · sell at horizon
- IRR
- 54.2%
- Equity multiple
- 3.40×
- Total profit
- $50,332
- Equity at exit
- $11,183
- IRR
- 59.4%
- Equity multiple
- 6.99×
- Total profit
- $125,789
- Equity at exit
- $6,485
Cash invested: $21,000 (down + closing). Projections, not guarantees.
Landlord ↔ Tenant lean methodology
- Overall (STATE)
- 81 Strongly Landlord-Friendly
- State Missouri
- 81 Strongly Landlord-Friendly · R+10
- County
- — inherits STATE
- City
- — inherits STATE
ZIP-level market 63111
- Rents YoY
- 3.3%
- Active inventory
- 125
- Price-to-rent
- 6.9×
Monthly cashflow live
- Estimated rent
- $1,870 high interval (Pro) →
- Mortgage (P&I)
- −$393
- Tax from tax record
- −$80 /mo · $960/yr
- Insurance
- −$31
- HOA
- −$0
- Vacancy / Maint / Mgmt
- −$393
- Net cashflow
- $973
Break-even live
2-unit breakdown (identical units grouped — click to expand)
| Units | Beds | Baths | Est. rent |
|---|---|---|---|
| 1× unit | 1 | 1 | $902 |
| 1× unit | 2 | 1 | $968 |
| Total (2 units) | $1,870 | ||
UW: 25.0% down · 7.5% · 30yr · 1.5% tax · 5.0% vac · 8.0% maint · 8.0% mgmt
Financing live
Cash to close
- Down payment
- $18,750
- Closing costs
- $2,250
- Reserves months
- —
- Total cash needed
- —
Loan-product check · same deal, 3 products live
Conventional
25% down · 7.5% · 30yr
- Down + closing
- —
- Monthly P&I
- —
- Monthly cashflow
- —
- DSCR
- —
- Eligible?
- —
Personal DTI + credit; lowest rate.
DSCR
20% down · 8.5% · 30yr
- Down + closing
- —
- Monthly P&I
- —
- Monthly cashflow
- —
- DSCR
- —
- Eligible?
- —
No personal income docs; deal must DSCR.
Hard money
10% down · 12.0% · 12mo
- Down + closing
- —
- Monthly P&I
- —
- Monthly cashflow
- —
- DSCR
- —
- Eligible?
- —
Short-term bridge; refi at stabilization.
Rent comps 19 comps
| Address | Beds | Baths | Sqft | Rent | $/sqft | DOM | Units | Dist |
|---|---|---|---|---|---|---|---|---|
| 4450 Pennsylvania Ave Saint Louis, MO | 3.0 | 1.0 | 1500 | $1,100 | $0.73 | 4d | 1 | 0.06mi |
| 4312 Oregon Ave Saint Louis, MO | 4.0 | 2.0 | 2032 | $2,000 | $0.98 | 1d | 1 | 0.28mi |
| 4250 Michigan Ave Saint Louis, MO | 2.0 | 1.0 | 2184 | $1,200 | $0.55 | 43d | 1 | 0.34mi |
| 4657 Idaho Ave Unit 4659 St. Louis, MO | 2.0 | 2.0 | 1668 | $1,295 | $0.78 | 23d | 1 | 0.42mi |
| 4145 S Compton Ave Saint Louis, MO | 3.0 | 2.0 | 1656 | $1,520 | $0.92 | 43d | 1 | 0.51mi |
| 4135 S Compton Ave Saint Louis, MO | 3.0 | 2.0 | 2104 | $1,600 | $0.76 | 43d | 1 | 0.52mi |
| 3637 Meramec St Saint Louis, MO | 3.0 | 1.5 | 1632 | $1,925 | $1.18 | 17d | 1 | 0.70mi |
| 3146 Keokuk St Saint Louis, MO | 3.0 | 1.0 | 1528 | $1,500 | $0.98 | 23d | 1 | 0.79mi |
| 3131 Keokuk St #3131 Saint Louis, MO | 3.0 | 2.0 | 1500 | $1,475 | $0.98 | 14d | 1 | 0.82mi |
| 4222 S 38th St Unit 4222 St. Louis, MO | 3.0 | 2.0 | 1836 | $1,400 | $0.76 | 20d | 1 | 0.83mi |
| 755 Dover Pl Saint Louis, MO | 2.0 | 1.0 | 2750 | $1,000 | $0.36 | 43d | 1 | 1.02mi |
| 3540 Michigan Ave Saint Louis, MO | 4.0 | 2.0 | 1758 | $1,800 | $1.02 | 1d | 1 | 1.21mi |
| 3510 California Ave Saint Louis, MO | 3.0 | 2.0 | 1800 | $1,200 | $0.67 | 43d | 1 | 1.27mi |
| 4000 Schiller Pl Saint Louis, MO | 2.0 | 2.5 | 1448 | $1,618 | $1.12 | 7d | 1 | 1.37mi |
| 3429 Ohio Ave Saint Louis, MO | 3.0 | 3.0 | 1938 | $2,250 | $1.16 | 16d | 1 | 1.38mi |
| 3410 Virginia Ave Unit B St. Louis, MO | 2.0 | 2.0 | 1442 | $1,375 | $0.95 | 16d | 1 | 1.42mi |
| 3526 S Spring Ave Saint Louis, MO | 4.0 | 2.0 | 2244 | $2,877 | $1.28 | 43d | 1 | 1.45mi |
| 3411 Cherokee St St. Louis, MO | 4.0 | 2.0 | 1568 | $1,850 | $1.18 | 43d | 1 | 1.47mi |
| 3450 Wisconsin Ave Saint Louis, MO | 1.0–3.0 | 1.0–2.0 | 1219 | $2,300 | $1.89 | 1d | 15 | 1.49mi |
Listing history 38 events
-
2026-06-18days on market $75,000 Active 86 DOM
-
2026-06-17days on market $75,000 Active 85 DOM
-
2026-06-16days on market $75,000 Active 84 DOM
-
2026-06-15days on market $75,000 Active 83 DOM
-
2026-06-13pricedays on market $75,000 Active 81 DOM
-
2026-06-09days on market $86,500 Active 77 DOM
-
2026-06-08days on market $86,500 Active 76 DOM
-
2026-06-08days on market $86,500 Active 75 DOM
-
2026-06-05days on market $86,500 Active 72 DOM
-
2026-06-03days on market $86,500 Active 71 DOM
-
2026-06-02days on market $86,500 Active 70 DOM
-
2026-06-01days on market $86,500 Active 69 DOM
-
2026-05-31days on market $86,500 Active 68 DOM
-
2026-05-17price $86,500 716-char remark
Show marketing remark (716 chars)
This 2,000+ sq ft property offers two spacious units with strong rental potential after updates. The first-floor unit is a large 1-bedroom with separate living and dining areas, oversized closets, and eat-in kitchen. The second-floor unit provides an opportunity to reconfigure into a true 2-bedroom, featuring a living room, dining room, eat-in kitchen, bedroom, and large bonus room. Additional features include a full shared basement and newer rear deck (2023) and stairs. With light to moderate rehab, projected rents are: 1st floor: $500–$700 2nd floor: $600–$850 Ideal for investors looking to add value, increase rents, and build equity. Convenient access to Highway 55 enhances tenant appeal.
-
2026-03-24$90,000 Active 716-char remark
Show marketing remark (716 chars)
This 2,000+ sq ft property offers two spacious units with strong rental potential after updates. The first-floor unit is a large 1-bedroom with separate living and dining areas, oversized closets, and eat-in kitchen. The second-floor unit provides an opportunity to reconfigure into a true 2-bedroom, featuring a living room, dining room, eat-in kitchen, bedroom, and large bonus room. Additional features include a full shared basement and newer rear deck (2023) and stairs. With light to moderate rehab, projected rents are: 1st floor: $500–$700 2nd floor: $600–$850 Ideal for investors looking to add value, increase rents, and build equity. Convenient access to Highway 55 enhances tenant appeal.
-
2025-05-05soldstatus
-
2025-03-03$90,000 Active
-
2025-02-14historical
-
2025-01-29price $132,000
-
2024-12-10$140,000 Active
-
2023-10-23soldstatus
-
2023-07-25soldstatus Closed
-
2023-07-25soldstatus $127,000
-
2023-06-27status Pending
-
2023-06-01status Active
-
2023-05-05status Pending
-
2023-04-18$135,000 Active
-
2023-01-23price $118,000
-
2021-03-16soldstatus $87,500
-
2021-03-11soldstatus Closed
-
2021-01-26status Pending
-
2021-01-09price $90,000
-
2020-11-24$95,000 Active
-
2006-11-08soldstatus
-
2006-10-03soldstatus $73,000
-
2004-03-29soldstatus $95,000
-
2004-01-09soldstatus
-
1995-10-26soldstatus
ⓘ Source: listings_history table (triggers on properties + properties_extension) + one-shot
backfill from property_details.listing_events for pre-trigger history.
Tax reassessment forecast MO · Resets to sale price
- Current annual tax
- $960 · $80/mo
- Projected year-2 tax
- $960 · $80/mo
- Expected delta
- $0/yr ($0/mo · 0.0%)
ⓘ Screening estimate from a state-policy table — verify with the county assessor before closing.
Climate risk First Street
- Flood 1/10 Low FEMA zone X (unshaded) · 0% chance over 30 yrs
- Wildfire 1/10 Low
- Heat 5/10 Major 7 d/yr ≥108°F today · 21 d/yr by 30 yrs out
- Wind 2/10 Low 100% chance of damaging wind over 30 yrs
- Air quality 3/10 Moderate 3 unhealthy d/yr today · 4 by 30 yrs out
Nearby sold comps map
Loading sold comps map…
Walkable amenities ~0.75 mi
Loading nearby amenities…
Taxation est. · year 1
- Rental income
- $22,440
- − Mortgage interest
- −$4,201
- − Property taxes
- −$960
- − Insurance
- −$375
- − Repairs & maintenance
- −$1,795
- − Management
- −$1,795
- − Depreciation
- −$2,182
- Taxable income
- $11,132
- Est. tax owed @ 24.0%
- −$2,672
- After-tax cash flow
- $9,002/yr
For passive investors: Depreciation is non-cash, so a rental often shows a tax loss while cash-flowing — sheltering income. Rental losses are passive: they offset passive income freely, and up to $25,000/yr can offset ordinary (W-2) income if you actively participate and your MAGI is under $100k (phasing out to $0 by $150k); unused losses carry forward. On sale, claimed depreciation is recaptured at up to 25%, and gains may owe capital-gains tax (a 1031 exchange can defer both). Figures are a year-1 estimate at your 24.0% rate — not tax advice; consult a CPA.
Schools (NCES district)
- District
- St. Louis City
- NCES district ID
- 2929280
- Math proficiency
- 10% ▼ -6.00%
- Reading proficiency
- 18% ▼ -3.00%
- Median HH income
- $35,685
- Composite
- 11.54/100
- National rank
- #9699
- State rank
- #312 of 324 in MO
Livability — St. Louis
No livability data for this city. (Only ~50 U.S. cities are tracked.)
Census & demographics
- Census place
- St. Louis, MO
- County
- Saint Louis City · 254,015 people
- City population
- 283,259
- Metro
- St. Louis, MO-IL
- Population (ZIP)
- 18,851
- Household income
- $47,039
- Rent vs Own
- Severe rent burden
- 1364.0
Population outlook (St. Louis County) Hauer SSP2
- Today (2025)
- 315,737 people
- By 2030
- 313,865 · -0.6%
- By 2040
- 305,439 · -3.3%
- By 2050
- 296,529 · -6.1%
- By 2075
- 271,028 · -14.2%
- By 2100
- 255,359 · -19.1%
Race, ethnicity, and origin ACS 2023
- Neighborhood character
- Diverse neighborhood (Simpson 0.65)
- Race & ethnicity
- Black 42% White 41% Two or more races 11% Hispanic / Latino 9% Asian 1%
- Hispanic origin (detail)
- Mexican 6%
- Common ancestry
- Lithuanian 3% Slovak 1% Romanian 1%
- Foreign-born
- 7% · Canada, India
- Languages at home
- 90% English-only · Spanish 7% Other Indo-European 1%
Political lean MEDSL · St. Louis
- 2024 margin
- Solid D (+64.7) · D 81.4% · R 16.7% · Other 2.0%
- 2008→2024 swing
- -3.5pp toward R · 2008: 68.2pp · 2024: 64.7pp
- All cycles
- 2024: D+64.7 2020: D+66.2 2016: D+63.7 2012: D+66.6 2008: D+68.2
Not yet ingested
- Civics
- —
Market trends
- HPI YoY
- ▼ -92.80%
- Current HPI
- 169.4644
- Rent YoY
- ▲ 3.27%
- Metro
- St. Louis, MO-IL
- State GDP YoY
- ▲ 1.84%
- F500 in state
- 20
Industry mix (Fortune 500 HQ in MO)
| Industry | F500 HQs | Revenue |
|---|---|---|
| Healthcare | 1 | $163B |
|
||
| Insurance | 1 | $21B |
|
||
| Industrial Technology | 1 | $17B |
|
||
| Retail | 1 | $16B |
|
||
| Industrial Distribution | 1 | $10B |
|
||
| Utilities | 1 | $9B |
|
||
Price history
-8.9% since first listed25 events — show timeline
- 2026-05-17 Price Changed $86,500 MARIS as Distributed by MLS Grid
- 2026-03-24 Listed $90,000 MARIS as Distributed by MLS Grid
- 2025-05-05 Sold (Public Records) — Public Records
- 2025-03-03 Listed $90,000 MARIS as Distributed by MLS Grid
- 2025-02-14 Delisted — MARIS as Distributed by MLS Grid
- 2025-01-29 Price Changed $132,000 MARIS as Distributed by MLS Grid
- 2024-12-10 Listed $140,000 MARIS as Distributed by MLS Grid
- 2023-10-23 Sold (Public Records) — Public Records
- 2023-07-25 Sold (Public Records) $127,000 Public Records
- 2023-07-25 Sold (MLS) — MARIS as Distributed by MLS Grid
- 2023-06-27 Pending — MARIS as Distributed by MLS Grid
- 2023-06-01 Relisted — MARIS as Distributed by MLS Grid
- 2023-05-05 Pending — MARIS as Distributed by MLS Grid
- 2023-04-18 Listed $135,000 MARIS as Distributed by MLS Grid
- 2023-01-23 Price Changed $118,000 MARIS as Distributed by MLS Grid
- 2021-03-16 Sold (Public Records) $87,500 Public Records
- 2021-03-11 Sold (MLS) — MARIS as Distributed by MLS Grid
- 2021-01-26 Pending — MARIS as Distributed by MLS Grid
- 2021-01-09 Price Changed $90,000 MARIS as Distributed by MLS Grid
- 2020-11-24 Listed $95,000 MARIS as Distributed by MLS Grid
- 2006-11-08 Sold (Public Records) — Public Records
- 2006-10-03 Sold (Public Records) $73,000 Public Records
- 2004-03-29 Sold (Public Records) $95,000 Public Records
- 2004-01-09 Sold (Public Records) — Public Records
- 1995-10-26 Sold (Public Records) — Public Records
Property tax history
+6.2%/yrLatest (2024): $960 · +5.0% YoY. Source: county tax records.
Cash-flow waterfall
monthlySold comps — $/sqft
last 12 mo · ≤1 miLoading sold comps…