4208 S Shady Ln · Boynton Beach, FL
Flood risk 3/10 · Minor
- FEMA flood zone
- X (unshaded)
- Chance of flooding over 30 yrs
- 0.2%
- Est. flood insurance / yr
- $507 – $1,088
Fire risk 1/10 · Minimal
- Est. fire insurance / yr
- $947 – $1,759
Heat risk 9/10 · Severe
- Hot days now (above 106°F)
- 7 days/yr
- Hot days in 30 yrs
- 26 days/yr
Wind risk 10/10 · Severe
- Chance of severe wind over 30 yrs
- 99.0%
Air-quality risk 2/10 · Minimal
- Unhealthy air days now
- 1 days/yr
- Unhealthy air days in 30 yrs
- 2 days/yr
Risk factors via First Street. Map © Google.
Why this score? — see what drove the B grade
The composite is a weighted blend of 9 inputs, each scored 0–100. Each bar is that input's sub-score; the figure is the points it added to the 100-point composite (weight × sub-score).
- Cash flow +30.0/30.0
- 1% rule +10.0/10.0
- DSCR +10.0/10.0
- ARV discount +7.5/15.0
- Schools +4.3/10.0
- Livability +3.6/5.0
- Condition / age +2.5/5.0
- Rent growth +2.4/5.0
- Appreciation +0.0/10.0
$120,000
🖨 Deal sheet 📄 Offer letter ✓ Due diligence
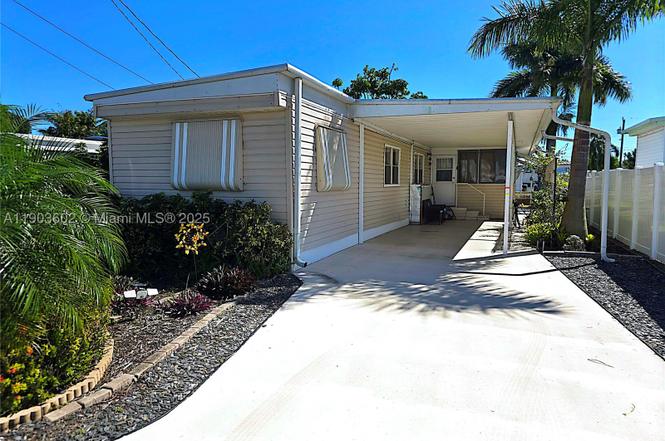
Listing remarks
Beautiful Mobile Home in the heart of Boynton Beach. 55 + community very quiet and nice "YOU OWN THE LAND", this way the HOA is only $88.00 monthly. This is a house with two Bedrooms and two baths, plus a extra florida room split plan home. a/c is 2023, hot water heather 2020, the property is free of mowing. Nice Backyard in artificial green turf. Nice patio in the back with canal view and 3 small storages. Washer and Dryer included. Furniture included ( optional)
Key facts
- Canal view
- Nice patio
- Extra florida room
Tags
Neighborhood map
What this means for you Summary
Snapshot
- This is a 2-bed/2.0-bath land listed at $120k.
Deal economics
- At list price, monthly cash flow is $691 ($8k/yr) — positive.
- The deal already cash-flows at list — no discount required.
- Meets the 1% rule at list price ($2k rent vs $120k).
- Recommended offer: $118k (1.5% below list) — sets the bar for market timing.
- Cap rate 13.2% vs local median 4.3% in Boynton Beach — top-decile yield for the area; either an underpriced asset or a hidden risk that comps aren't pricing in. Stress-test before assuming the spread holds.
Location & tenants
- Location reads 72/100 on livability (#351 in FL) — a middle-class / working-renter tenant base. Strengths: housing A+, health & safety B+, cost of living B; Watch: amenities D+, crime D-, commute F.
- Palm Beach (suburban): math 46% / reading 53% proficiency, ranked #34 of 73 in FL (top 47%) — families likely to look elsewhere, expect single-tenant / working-renter base with shorter leases.
- Market conditions: Rents soft (-0.6%/yr); 445 active listings in the ZIP; 2 comparable units currently listed for rent nearby; solid renter incomes; 3,974 units permitted in Palm Beach County in 2024 (1,012 in 5+ unit buildings).
- This rent runs 33% of the median local income ($76k/yr) — at the standard rent-burdened threshold; future hikes will face affordability resistance.
Forward outlook
- Local home prices are declining (-3.0%/yr); year-one equity from $830 of loan paydown is wiped out by about $4k of value loss. Plan a longer hold.
- Palm Beach County population projected at +30% by 2050 — long-run rental-demand tailwind backs the buy-and-hold thesis.
- At projected returns (-3.0% appreciation + 0.0% rent growth), your $34k cash investment doubles in ~6 years — after that, you're playing with house money.
Negotiation context
- It's been on market 18 days — a 2% lower offer ($118k) is reasonable based on typical stale-listing flexibility.
- 7 sale attempts since 8y ago with the ask held roughly flat each time — persistent listings suggest the price (not the market) is what's stuck; bring a comps-based counter.
Risks & watch-outs
- Climate carrying-cost: severe wind risk, 99% chance of damaging wind over 30y; extreme-heat days projected 7→26/yr by 2055 (HVAC capex compounding) — expect insurance premiums to compound above CPI over the hold.
Questions for the listing agent
- Built in 1972 — when were the roof, HVAC, electrical panel, plumbing, and water heater last replaced?
- What does the HOA fee cover, when was the last increase, and are there any pending special assessments or reserve-fund shortfalls?
- Is there a deadline driving the sale (1031 exchange, divorce, estate, relocation)? That informs how much negotiation room exists.
- Crime grade is D in this area — have there been break-ins, vandalism, or insurance claims at this property in the last 3 years? What carrier currently insures it and at what premium?
- What's the average days-on-market for RENTAL listings here right now (not sales)? A rising rental-DOM trend means longer vacancies and softer asking-rent achievability than the comps imply.
- What's the recent tenant-quality profile in this submarket — average credit score on applications, eviction rate, late-payment / NSF rate, and stable-employment percentage? A property-management company in the area should have these aggregated.
- How much new for-sale + rental construction is in the pipeline within 1–3 miles? Heavy new supply typically softens prices + rents 12–24 months out; constrained supply supports both.
Investment metrics
- 1% rule
- 1.73% ✓
- Cap rate
- 13.21%
- Cash-on-cash
- 24.70%
- DSCR
- 2.10
- GRM
- 4.8
CMA / ARV
No comps found within radius.
Projected returns pro-forma
-3.0% appreciation · 0.0% rent growth · sell at horizon
- IRR
- 14.4%
- Equity multiple
- 1.55×
- Total profit
- $18,629
- Equity at exit
- $17,892
- IRR
- 20.6%
- Equity multiple
- 2.48×
- Total profit
- $49,891
- Equity at exit
- $10,375
Cash invested: $33,600 (down + closing). Projections, not guarantees.
Landlord ↔ Tenant lean methodology
- Overall (STATE)
- 87 Strongly Landlord-Friendly
- State Florida
- 87 Strongly Landlord-Friendly · R+3
- County
- — inherits STATE
- City
- — inherits STATE
ZIP-level market 33436
- Home prices YoY
- -26.0%
- Rents YoY
- -0.6%
- Active inventory
- 445
- Price-to-rent
- 4.8×
Monthly cashflow live
- Estimated rent
- $2,071 medium interval (Pro) →
- Mortgage (P&I)
- −$629
- Tax from tax record
- −$177 /mo · $2,128/yr
- Insurance
- −$50
- HOA
- −$88
- Vacancy / Maint / Mgmt
- −$435
- Net cashflow
- $691
Break-even live
UW: 25.0% down · 7.5% · 30yr · 1.5% tax · 5.0% vac · 8.0% maint · 8.0% mgmt
Financing live
Cash to close
- Down payment
- $30,000
- Closing costs
- $3,600
- Reserves months
- —
- Total cash needed
- —
Loan-product check · same deal, 3 products live
Conventional
25% down · 7.5% · 30yr
- Down + closing
- —
- Monthly P&I
- —
- Monthly cashflow
- —
- DSCR
- —
- Eligible?
- —
Personal DTI + credit; lowest rate.
DSCR
20% down · 8.5% · 30yr
- Down + closing
- —
- Monthly P&I
- —
- Monthly cashflow
- —
- DSCR
- —
- Eligible?
- —
No personal income docs; deal must DSCR.
Hard money
10% down · 12.0% · 12mo
- Down + closing
- —
- Monthly P&I
- —
- Monthly cashflow
- —
- DSCR
- —
- Eligible?
- —
Short-term bridge; refi at stabilization.
Rent comps 2 comps
| Address | Beds | Baths | Sqft | Rent | $/sqft | DOM | Units | Dist |
|---|---|---|---|---|---|---|---|---|
| 2407 Renaissance Way Boynton Beach, FL | 1.0 | 1.0 | 744 | $1,950 | $2.62 | 8d | 1 | 1.27mi |
| 4 Renaissance Way #302 Boynton Beach, FL | 1.0 | 1.0 | 747 | $1,945 | $2.60 | 11d | 1 | 1.31mi |
HOA detail
- Monthly dues
- $88 · $1,056/yr
- Likely covers
- water
Listing history 26 events
-
2025-12-05soldstatus $113,000
-
2025-11-14status Pending
-
2025-11-14status Active
-
2025-11-14status Pending
-
2025-10-27$120,000 Active
-
2025-09-19historical
-
2025-08-25price $125,000
-
2025-04-23$138,000 Active
-
2025-04-03historical
-
2025-03-14price $142,500
-
2025-01-07price $145,500
-
2024-11-04$149,500 Active
-
2024-10-25historical
-
2024-07-03$155,000 Active
-
2023-09-14soldstatus $138,000
-
2023-09-08soldstatus $138,000 Closed
-
2023-08-04status Pending
-
2023-07-13price $144,900
-
2023-04-04price $149,900
-
2023-02-26$153,900 Active
-
2018-05-22soldstatus $37,000 Closed
-
2018-03-14status Pending
-
2018-02-27historical Contingent
-
2018-01-10$47,000 Active
-
1988-03-01soldstatus $15,500
-
1987-01-01soldstatus $25,000
ⓘ Source: listings_history table (triggers on properties + properties_extension) + one-shot
backfill from property_details.listing_events for pre-trigger history.
Tax reassessment forecast FL · Resets to sale price
- Current annual tax
- $2,128 · $177/mo
- Projected year-2 tax
- $2,128 · $177/mo
- Expected delta
- $0/yr ($0/mo · 0.0%)
ⓘ Screening estimate from a state-policy table — verify with the county assessor before closing.
Climate risk First Street
- Flood 3/10 Moderate FEMA zone X (unshaded) · 20% chance over 30 yrs
- Wildfire 1/10 Low
- Heat 9/10 Extreme 7 d/yr ≥106°F today · 26 d/yr by 30 yrs out
- Wind 10/10 Extreme 99% chance of damaging wind over 30 yrs
- Air quality 2/10 Low 1 unhealthy d/yr today · 2 by 30 yrs out
Nearby sold comps map
Loading sold comps map…
Walkable amenities ~0.75 mi
Loading nearby amenities…
Taxation est. · year 1
- Rental income
- $24,853
- − Mortgage interest
- −$6,722
- − Property taxes
- −$2,128
- − Insurance
- −$600
- − Repairs & maintenance
- −$1,988
- − Management
- −$1,988
- − HOA
- −$1,056
- − Depreciation
- −$3,491
- Taxable income
- $6,879
- Est. tax owed @ 24.0%
- −$1,651
- After-tax cash flow
- $6,647/yr
For passive investors: Depreciation is non-cash, so a rental often shows a tax loss while cash-flowing — sheltering income. Rental losses are passive: they offset passive income freely, and up to $25,000/yr can offset ordinary (W-2) income if you actively participate and your MAGI is under $100k (phasing out to $0 by $150k); unused losses carry forward. On sale, claimed depreciation is recaptured at up to 25%, and gains may owe capital-gains tax (a 1031 exchange can defer both). Figures are a year-1 estimate at your 24.0% rate — not tax advice; consult a CPA.
Schools (NCES district)
- District
- Palm Beach
- NCES district ID
- 1201500
- Math proficiency
- 46% ▼ -16.00%
- Reading proficiency
- 53% ▼ -4.00%
- Median HH income
- $53,943
- Composite
- 42.72/100
- National rank
- #3160
- State rank
- #34 of 73 in FL
Livability — Boynton Beach
- Score
- 72/100
- State rank
- #351
- US rank
- #6098
Category grades
Schools grade is shown separately in the Schools card above.
Census & demographics
- County
- Palm Beach County · 1,438,312 people
- City population
- 148,060
- Metro
- Miami-Fort Lauderdale-Pompano Beach, FL
- Population (ZIP)
- 48,743
- Household income
- $75,789
- Rent vs Own
- Severe rent burden
- 1813.0
Population outlook (Palm Beach County) Hauer SSP2
- Today (2025)
- 1,637,487 people
- By 2030
- 1,743,255 · +6.5%
- By 2040
- 1,948,712 · +19.0%
- By 2050
- 2,132,979 · +30.3%
- By 2075
- 2,530,027 · +54.5%
- By 2100
- 2,706,979 · +65.3%
Race, ethnicity, and origin ACS 2023
- Neighborhood character
- Diverse neighborhood (Simpson 0.64)
- Race & ethnicity
- White 52% Black 24% Hispanic / Latino 19% Two or more races 10% Asian 2%
- Hispanic origin (detail)
- Mexican 2% Puerto Rican 4% Cuban 3% Dominican 1%
- Common ancestry
- Hispanic 12% Romanian 3% Scotch-Irish 2%
- Foreign-born
- 27% · Canada, Jamaica, Vietnam
- Languages at home
- 64% English-only · Spanish 14% French/Haitian/Cajun 13% Other Indo-European 2%
Political lean MEDSL · Palm Beach
- 2024 margin
- Toss-up / Even · D 50.0% · R 49.2%
- 2008→2024 swing
- -22.1pp toward R · 2008: 22.9pp · 2024: 0.8pp
- All cycles
- 2024: D+0.8 2020: D+12.8 2016: D+15.3 2012: D+17.0 2008: D+22.9
Not yet ingested
- Civics
- —
Market trends
- HPI YoY
- ▼ -109.59%
- Current HPI
- 311.7742
- Rent YoY
- ▼ -0.57%
- Metro
- Miami-Fort Lauderdale-Pompano Beach, FL
- State GDP YoY
- ▲ 3.28%
- F500 in state
- 36
Industry mix (Fortune 500 HQ in FL)
| Industry | F500 HQs | Revenue |
|---|---|---|
| Industrial Technology | 2 | $29B |
|
||
| Insurance | 2 | $17B |
|
||
| Retail | 1 | $60B |
|
||
| Technology Distribution | 1 | $58B |
|
||
| Homebuilding | 1 | $35B |
|
||
| Technology Manufacturing | 1 | $35B |
|
||
Price history
+352.0% since first listed26 events — show timeline
- 2025-12-05 Sold (Public Records) $113,000 Public Records
- 2025-11-14 Pending — MARMLS
- 2025-11-14 Relisted — MARMLS
- 2025-11-14 Pending — MARMLS
- 2025-10-27 Listed $120,000 MARMLS
- 2025-09-19 Listing Removed — MARMLS
- 2025-08-25 Price Changed $125,000 MARMLS
- 2025-04-23 Listed $138,000 MARMLS
- 2025-04-03 Listing Removed — MARMLS
- 2025-03-14 Price Changed $142,500 MARMLS
- 2025-01-07 Price Changed $145,500 MARMLS
- 2024-11-04 Listed $149,500 MARMLS
- 2024-10-25 Listing Removed — MARMLS
- 2024-07-03 Listed $155,000 MARMLS
- 2023-09-14 Sold (Public Records) $138,000 Public Records
- 2023-09-08 Sold (MLS) $138,000 Beaches MLS
- 2023-08-04 Pending — Beaches MLS
- 2023-07-13 Price Changed $144,900 Beaches MLS
- 2023-04-04 Price Changed $149,900 Beaches MLS
- 2023-02-26 Listed $153,900 Beaches MLS
- 2018-05-22 Sold (MLS) $37,000 Beaches MLS
- 2018-03-14 Pending — Beaches MLS
- 2018-02-27 Contingent — Beaches MLS
- 2018-01-10 Listed $47,000 Beaches MLS
- 1988-03-01 Sold (Public Records) $15,500 Public Records
- 1987-01-01 Sold (Public Records) $25,000 Public Records
Property tax history
+13.9%/yrLatest (2025): $2,128 · +4.8% YoY. Source: county tax records.
Cash-flow waterfall
monthlySold comps — $/sqft
last 12 mo · ≤1 miLoading sold comps…