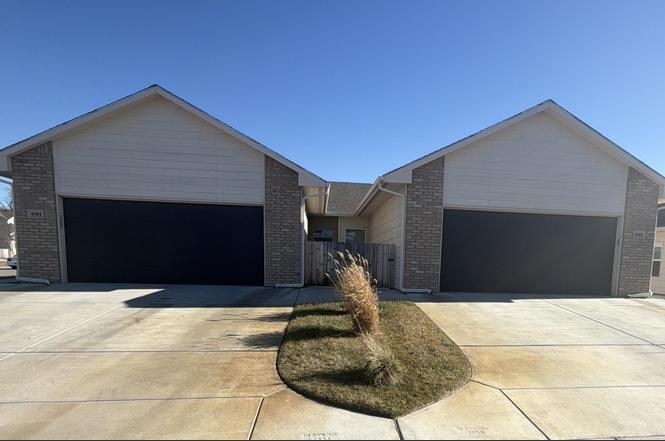
 Duplex
4501-4503 N Sandplum St · Wichita, KS
Flood risk 1/10 · Minimal
- FEMA flood zone
- X (shaded)
- Chance of flooding over 30 yrs
- 0.0%
- Est. flood insurance / yr
- $507 – $1,088
Fire risk 4/10 · Minor
- Est. fire insurance / yr
- $1,154 – $2,142
Heat risk 5/10 · Moderate
- Hot days now (above 105°F)
- 7 days/yr
- Hot days in 30 yrs
- 18 days/yr
Wind risk 2/10 · Minimal
- Chance of severe wind over 30 yrs
- 1.0%
Air-quality risk 2/10 · Minimal
- Unhealthy air days now
- 2 days/yr
- Unhealthy air days in 30 yrs
- 2 days/yr
Risk factors via First Street. Map © Google.
Why this score? — see what drove the D- grade
The composite is a weighted blend of 9 inputs, each scored 0–100. Each bar is that input's sub-score; the figure is the points it added to the 100-point composite (weight × sub-score).
- Cash flow +9.7/30.0
- ARV discount +7.5/15.0
- 1% rule +4.1/10.0
- Schools +3.8/10.0
- Rent growth +3.6/5.0
- Livability +3.6/5.0
- DSCR +2.7/10.0
- Condition / age +2.5/5.0
- Appreciation +0.0/10.0
$368,000
🖨 Deal sheet 📄 Offer letter ✓ Due diligence
Multi-family units
County records classify this as Multi-Family (2-4 Unit). Listing-text estimate: 2 units. confirmed
Key facts
- Modern finishes
- Walk in pantry
- Corner lot
Tags
Property features AI
Finance
- Financial info: Owner pays: None
- HOA & community: Has association; Association fee $1,800; HOA initiation fee $500
Exterior
- Parking: 6 parking spaces total; On-street parking; Attached parking; More than 2 spaces per unit
- Security: Fire alarm; Smoke detectors
- Utilities: Natural gas available; Sewer available; Public water
- Home design: Duplex
- Construction: Composition roof
- Exterior features: Fire alarm; Playground access; Smoke detectors
Interior
- Kitchen: Dishwasher; Disposal; Microwave; Range; Refrigerator
- Bedrooms: Duplex with 2 total units
- Flooring: Wood floors
- Heating & cooling: Electric cooling; Electric heating; Natural gas heating
- Interior features: Dishwasher; Disposal; Microwave; Range; Refrigerator
Neighborhood map
What this means for you Summary
Snapshot
- This is a 2 × 3-bed/1.5-bath units multifamily listed at $368k.
Deal economics
- At list price, monthly cash flow is $-242 ($-3k/yr) — negative. Per door: $-121/mo.
- To cash-flow at today's rent, offer at most $325k (11.6% below list).
- To meet the 1% rule (rent ≥ 1% of price), the offer needs to be $336k (8.7% below list).
- Recommended offer: $324k (12.0% below list) — sets the bar for market timing.
Location & tenants
- Location reads 72/100 on livability (#100 in KS) — a middle-class / working-renter tenant base. Strengths: amenities A+, cost of living A+, housing A+; Watch: employment D+, crime F, commute F.
- Maize (rural): math 36% / reading 45% proficiency, ranked #20 of 169 in KS (top 12%) — families likely to look elsewhere, expect single-tenant / working-renter base with shorter leases; only 14% free/reduced lunch — higher-income household profile.
- Zoned schools: Maize Middle School (math 25% / reading 37%, grade F, #62 of 219 statewide, top 28%, 734 students, 29% FRL); Maize Sr High (math 25% / reading 26%, grade F, #98 of 327 statewide, top 30%, 1,289 students, 26% FRL).
- Zoned-school proficiency averages 28% at this address vs 40% district-wide (-12 pts) — the specific schools serving this property underperform the Maize average; the district grade overstates school quality for this exact location.
- Market conditions: Rents rising fast (+4.4%/yr); 206 active listings in the ZIP; high-income renter base; 2,613 units permitted in Sedgwick County in 2024 (258 in 5+ unit buildings).
- This rent runs 33% of the median local income ($121k/yr) — at the standard rent-burdened threshold; future hikes will face affordability resistance.
Forward outlook
- Local home prices are declining (-3.0%/yr); year-one equity from $3k of loan paydown is wiped out by about $11k of value loss. Plan a longer hold.
- Sedgwick County population projected at +5% by 2050 — modest demand growth; plan on rents tracking national, not racing it.
Negotiation context
- It's been on market 169 days — a 12% lower offer ($324k) is reasonable based on typical stale-listing flexibility.
- 2 sale attempts with the ask held roughly flat each time — persistent listings suggest the price (not the market) is what's stuck; bring a comps-based counter.
Risks & watch-outs
- Climate carrying-cost: extreme-heat days projected 7→18/yr by 2055 (HVAC capex compounding) — expect insurance premiums to compound above CPI over the hold.
Questions for the listing agent
- What do current leases actually rent for vs. the listed asking? Can we see a recent rent roll and the last 12 months of T-12 income?
- It's been on market 169 days. Have you received any prior offers? Is the seller open to a 12% concession, seller financing, or rate buy-down credit?
- Can we see the unit-by-unit rent roll, current vacancy, and any below-market leases? What's the average tenancy length?
- What capital expenditures (roof, boiler, parking lot, exteriors) have been made in the last 5 years, and what's planned in the next 2?
- What does the HOA fee cover, when was the last increase, and are there any pending special assessments or reserve-fund shortfalls?
- Why hasn't it sold? Are there any deal-killer items the seller is aware of (foundation, flood, title, zoning, code violations)?
- Is there a deadline driving the sale (1031 exchange, divorce, estate, relocation)? That informs how much negotiation room exists.
- Schools are F-rated, which usually means shorter tenancies and higher turnover. Who's the typical renter profile here, and what's been the actual vacancy rate?
- Crime grade is F in this area — have there been break-ins, vandalism, or insurance claims at this property in the last 3 years? What carrier currently insures it and at what premium?
- The area grade is low — what's the realistic commute time and amenity access for the typical tenant pool here? Any planned neighborhood developments (good or bad) we should know about?
- What's the average days-on-market for RENTAL listings here right now (not sales)? A rising rental-DOM trend means longer vacancies and softer asking-rent achievability than the comps imply.
- What's the recent tenant-quality profile in this submarket — average credit score on applications, eviction rate, late-payment / NSF rate, and stable-employment percentage? A property-management company in the area should have these aggregated.
- How much new apartment / multifamily construction is in the pipeline within 1–3 miles? Heavy new supply (>2% of stock underway) typically softens rents 12–24 months out; light construction supports rent growth.
Investment metrics
- 1% rule
- 0.91% ✗
- Cap rate
- 5.50%
- Cash-on-cash
- -2.82%
- DSCR
- 0.87
- GRM
- 9.1
CMA / ARV
No comps found within radius.
Projected returns pro-forma
-3.0% appreciation · 4.36% rent growth · sell at horizon
- IRR
- -19.2%
- Equity multiple
- 0.32×
- Total profit
- $-70,129
- Equity at exit
- $54,870
- IRR
- -8.8%
- Equity multiple
- 0.42×
- Total profit
- $-60,181
- Equity at exit
- $31,818
Cash invested: $103,040 (down + closing). Projections, not guarantees.
Landlord ↔ Tenant lean methodology
- Overall (STATE)
- 83 Strongly Landlord-Friendly
- State Kansas
- 83 Strongly Landlord-Friendly · R+10
- County
- — inherits STATE
- City
- — inherits STATE
ZIP-level market 67205
- Home prices YoY
- -18.9%
- Rents YoY
- 4.4%
- Active inventory
- 206
- Price-to-rent
- 18.3×
Monthly cashflow live
- Estimated rent
- $3,360 medium interval (Pro) →
- Mortgage (P&I)
- −$1,930
- Tax from tax record
- −$663 /mo · $7,961/yr
- Insurance
- −$153
- HOA
- −$150
- Vacancy / Maint / Mgmt
- −$706
- Net cashflow
- $-242
Break-even live
2-unit breakdown (identical units grouped — click to expand)
| Units | Beds | Baths | Est. rent |
|---|---|---|---|
| 2× units | 3 | 1.5 | $3,360 |
| #1 | 3 | 1.5 | $1,680 |
| #2 | 3 | 1.5 | $1,680 |
| Total (2 units) | $3,360 | ||
UW: 25.0% down · 7.5% · 30yr · 1.5% tax · 5.0% vac · 8.0% maint · 8.0% mgmt
Financing live
Cash to close
- Down payment
- $92,000
- Closing costs
- $11,040
- Reserves months
- —
- Total cash needed
- —
Loan-product check · same deal, 3 products live
Conventional
25% down · 7.5% · 30yr
- Down + closing
- —
- Monthly P&I
- —
- Monthly cashflow
- —
- DSCR
- —
- Eligible?
- —
Personal DTI + credit; lowest rate.
DSCR
20% down · 8.5% · 30yr
- Down + closing
- —
- Monthly P&I
- —
- Monthly cashflow
- —
- DSCR
- —
- Eligible?
- —
No personal income docs; deal must DSCR.
Hard money
10% down · 12.0% · 12mo
- Down + closing
- —
- Monthly P&I
- —
- Monthly cashflow
- —
- DSCR
- —
- Eligible?
- —
Short-term bridge; refi at stabilization.
HOA detail
- Monthly dues
- $150 · $1,800/yr
Listing history 24 events
-
2026-06-18days on market $368,000 Active 169 DOM
-
2026-06-17days on market $368,000 Active 168 DOM
-
2026-06-16days on market $368,000 Active 167 DOM
-
2026-06-15days on market $368,000 Active 166 DOM
-
2026-06-14days on market $368,000 Active 164 DOM
-
2026-06-13days on market $368,000 Active 163 DOM
-
2026-06-10days on market $368,000 Active 161 DOM
-
2026-06-09days on market $368,000 Active 160 DOM
-
2026-06-08days on market $368,000 Active 159 DOM
-
2026-06-07days on market $368,000 Active 158 DOM
-
2026-06-05days on market $368,000 Active 155 DOM
-
2026-06-03days on market $368,000 Active 154 DOM
-
2026-06-02days on market $368,000 Active 153 DOM
-
2026-06-01days on market $368,000 Active 152 DOM
-
2026-05-31days on market $368,000 Active 151 DOM
-
2026-05-30days on market $368,000 Active 150 DOM
-
2026-04-29price $368,000
-
2026-04-18price $371,000
-
2026-04-10price $372,000
-
2026-04-04price $373,000
-
2026-02-27price $374,000
-
2025-12-31$375,000 Active
-
2025-12-11historical $1,495
-
2025-11-18$1,495
ⓘ Source: listings_history table (triggers on properties + properties_extension) + one-shot
backfill from property_details.listing_events for pre-trigger history.
Tax reassessment forecast KS · Resets to sale price
- Current annual tax
- $7,961 · $663/mo
- Projected year-2 tax
- $7,961 · $663/mo
- Expected delta
- $0/yr ($0/mo · 0.0%)
ⓘ Screening estimate from a state-policy table — verify with the county assessor before closing.
Climate risk First Street
- Flood 1/10 Low FEMA zone X (shaded) · 0% chance over 30 yrs
- Wildfire 4/10 Moderate
- Heat 5/10 Major 7 d/yr ≥105°F today · 18 d/yr by 30 yrs out
- Wind 2/10 Low 100% chance of damaging wind over 30 yrs
- Air quality 2/10 Low 2 unhealthy d/yr today · 2 by 30 yrs out
Nearby sold comps map
Loading sold comps map…
Walkable amenities ~0.75 mi
Loading nearby amenities…
Taxation est. · year 1
- Rental income
- $40,320
- − Mortgage interest
- −$20,614
- − Property taxes
- −$7,961
- − Insurance
- −$1,840
- − Repairs & maintenance
- −$3,226
- − Management
- −$3,226
- − HOA
- −$1,800
- − Depreciation
- −$10,705
- Taxable loss
- −$9,051
- Est. tax savings @ 24.0%
- +$2,172
- After-tax cash flow
- $-734/yr
For passive investors: Depreciation is non-cash, so a rental often shows a tax loss while cash-flowing — sheltering income. Rental losses are passive: they offset passive income freely, and up to $25,000/yr can offset ordinary (W-2) income if you actively participate and your MAGI is under $100k (phasing out to $0 by $150k); unused losses carry forward. On sale, claimed depreciation is recaptured at up to 25%, and gains may owe capital-gains tax (a 1031 exchange can defer both). Figures are a year-1 estimate at your 24.0% rate — not tax advice; consult a CPA.
Schools (NCES district)
- District
- Maize
- NCES district ID
- 2009140
- Math proficiency
- 36% ▼ -6.00%
- Reading proficiency
- 45% ▼ -4.00%
- Median HH income
- $87,686
- Composite
- 38.48/100
- National rank
- #4184
- State rank
- #20 of 169 in KS
Livability — Wichita
- Score
- 72/100
- State rank
- #100
- US rank
- #5730
Category grades
Schools grade is shown separately in the Schools card above.
Census & demographics
- Census place
- Wichita, KS
- County
- Sedgwick County · 432,957 people
- City population
- 365,168
- Metro
- Wichita, KS
- Population (ZIP)
- 20,098
- Household income
- $121,245
- Rent vs Own
- Severe rent burden
- 385.0
Population outlook (Sedgwick County) Hauer SSP2
- Today (2025)
- 537,014 people
- By 2030
- 546,984 · +1.9%
- By 2040
- 559,141 · +4.1%
- By 2050
- 562,027 · +4.7%
- By 2075
- 557,255 · +3.8%
- By 2100
- 513,383 · -4.4%
Race, ethnicity, and origin ACS 2023
- Neighborhood character
- Predominantly White (83%)
- Race & ethnicity
- White 83% Two or more races 8% Hispanic / Latino 7% Asian 3%
- Hispanic origin (detail)
- Mexican 4% Salvadoran 1%
- Common ancestry
- Lithuanian 4% Italian 3% Iranian 2%
- Foreign-born
- 4% · Canada, Vietnam, Dominican Republic
- Languages at home
- 94% English-only · Spanish 3% Vietnamese 1% Chinese 0%
Political lean MEDSL · Sedgwick
- 2024 margin
- R (+13.8) · D 42.3% · R 56.1% · Other 1.6%
- 2008→2024 swing
- -1.1pp toward R · 2008: -12.7pp · 2024: -13.8pp
- All cycles
- 2024: R+13.8 2020: R+12.6 2016: R+19.1 2012: R+19.7 2008: R+12.7
Not yet ingested
- Civics
- —
Market trends
- HPI YoY
- ▼ -48.67%
- Current HPI
- 209.3886
- Rent YoY
- ▲ 4.36%
- Metro
- Wichita, KS
- State GDP YoY
- —
- F500 in state
- 0
Price history
+24515.4% since first listed8 events — show timeline
- 2026-04-29 Price Changed $368,000 SCKMLS as Distributed by MLS Grid
- 2026-04-18 Price Changed $371,000 SCKMLS as Distributed by MLS Grid
- 2026-04-10 Price Changed $372,000 SCKMLS as Distributed by MLS Grid
- 2026-04-04 Price Changed $373,000 SCKMLS as Distributed by MLS Grid
- 2026-02-27 Price Changed $374,000 SCKMLS as Distributed by MLS Grid
- 2025-12-31 Listed $375,000 SCKMLS as Distributed by MLS Grid
- 2025-12-11 Rental Removed $1,495 APPFOLIO
- 2025-11-18 Listed for Rent $1,495 APPFOLIO
Property tax history
+168.8%/yrLatest (2025): $7,961 · +66.6% YoY. Source: county tax records.
Cash-flow waterfall
monthlySold comps — $/sqft
last 12 mo · ≤1 miLoading sold comps…