8 Bass Ln · Orofino, ID
Flood risk 10/10 · Severe
- FEMA flood zone
- X (shaded)
- Chance of flooding over 30 yrs
- 0.99%
- Est. flood insurance / yr
- $507 – $1,088
Fire risk 6/10 · Moderate
- Est. fire insurance / yr
- $584 – $1,086
Heat risk 5/10 · Moderate
- Hot days now (above 95°F)
- 10 days/yr
- Hot days in 30 yrs
- 23 days/yr
Wind risk 1/10 · Minimal
- Chance of severe wind over 30 yrs
- —
Air-quality risk 9/10 · Severe
- Unhealthy air days now
- 16 days/yr
- Unhealthy air days in 30 yrs
- 18 days/yr
Risk factors via First Street. Map © Google.
Why this score? — see what drove the B- grade
The composite is a weighted blend of 9 inputs, each scored 0–100. Each bar is that input's sub-score; the figure is the points it added to the 100-point composite (weight × sub-score).
- Cash flow +30.0/30.0
- 1% rule +10.0/10.0
- DSCR +10.0/10.0
- ARV discount +7.5/15.0
- Schools +3.9/10.0
- Livability +3.8/5.0
- Rent growth +2.5/5.0
- Condition / age +2.2/5.0
- Appreciation +0.0/10.0
$25,000
🖨 Deal sheet 📄 Offer letter ✓ Due diligence
Listing remarks
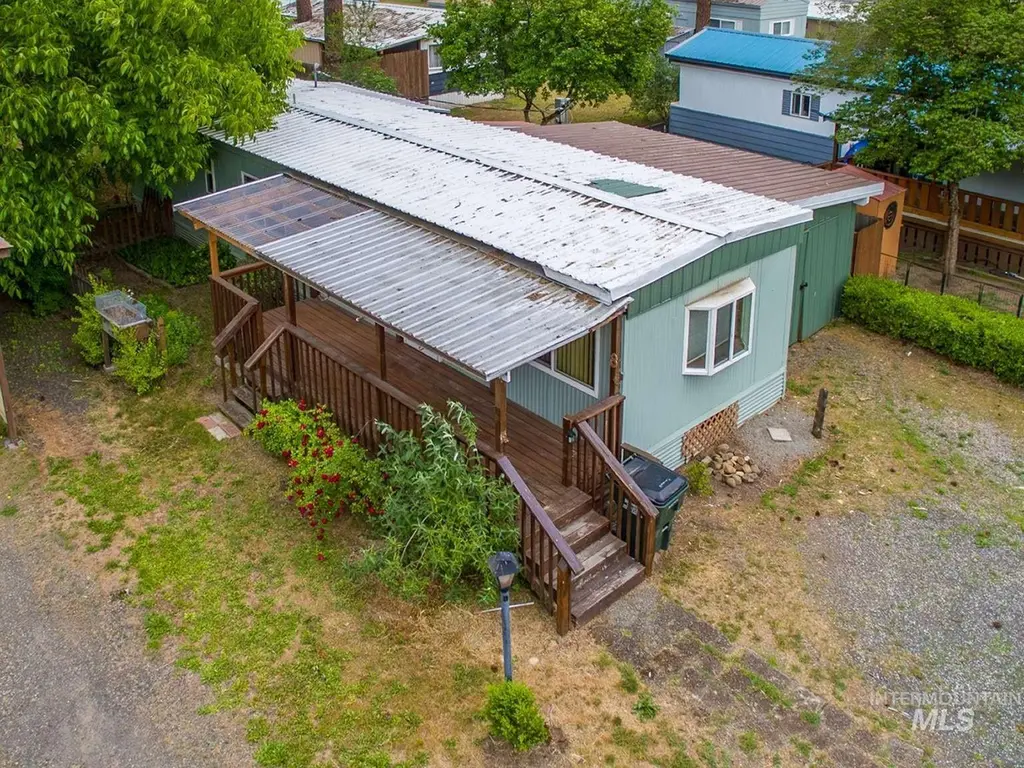
Welcome to this beautifully rehabbed 2-bedroom, 2-bath manufactured home located in Hidden Village Mobile Home Park in Orofino, Idaho. Nestled in a peaceful community with the river running alongside the park, this home offers a unique blend of comfort, affordability, and natural beauty. Inside, you'll find updated living spaces designed for everyday comfort and functionality. The kitchen includes a range and refrigerator, providing everything you need to settle right in. Central air conditioning helps keep the home comfortable throughout the warmer months, while the thoughtful layout offers ample living space for relaxing or entertaining. One of the standout features of this property is th
Key facts
- Garden area
- Built 1976
- Listed 6 days
Tags
Property features AI
Finance
- Financial info: Annual taxes approximately $98; Parcel number MHP0HDNV000310
Exterior
- Home design: Mobile/manufactured home on a rented lot
- Construction: Built in 1976
- Exterior features: Small lot (~5,999 sq ft)
Interior
- Bedrooms: 2 bedrooms (both on the main level)
- Bathrooms: 2 bathrooms
- Heating & cooling: No heating; No cooling
- Interior features: Main-level master bedroom; Second bedroom on main level
Neighborhood map
What this means for you Summary
Snapshot
- This is a 2-bed/2.0-bath manufactured listed at $25k. Condition is rated fair.
Deal economics
- At list price, monthly cash flow is $441 ($5k/yr) — positive.
- The deal already cash-flows at list — no discount required.
- Meets the 1% rule at list price ($861 rent vs $25k).
- Cap rate 30.6% vs local median 2.4% in Orofino — top-decile yield for the area; either an underpriced asset or a hidden risk that comps aren't pricing in. Stress-test before assuming the spread holds.
Location & tenants
- Location reads 76/100 on livability (#27 in ID, #3,806 nationally) — a middle-class / working-renter tenant base. Strengths: crime A+, cost of living A+, housing A+; Watch: amenities F, commute F, employment D-.
- Orofino Joint District (town): math 37% / reading 56% proficiency, ranked #45 of 92 in ID (top 49%) — families likely to look elsewhere, expect single-tenant / working-renter base with shorter leases.
- Zoned schools: Orofino Elementary School (math 42% / reading 52%, grade D-, #176 of 357 statewide, top 53%, 376 students, 41% FRL); Orofino High School (math 32% / reading 67%, grade D, #45 of 169 statewide, top 29%, 372 students, 25% FRL).
- Market conditions: 81 active listings in the ZIP; 51 units permitted in Clearwater County in 2024 (0 in 5+ unit buildings).
Forward outlook
- Local home prices are declining (-3.0%/yr); year-one equity from $173 of loan paydown is wiped out by about $750 of value loss. Plan a longer hold.
- Clearwater County population projected to shrink 6% by 2050 — rents likely to lag national; underwrite the cash flow, not the appreciation.
- At projected returns (-3.0% appreciation + 3.0% rent growth), your $7k cash investment doubles in ~2 years — after that, you're playing with house money.
Negotiation context
- Only 6 days on market — expect competitive offers; lowballing is unlikely to land.
Risks & watch-outs
- Watch-outs: flood insurance adds $66/mo.
- Climate carrying-cost: severe flood risk; major wildfire risk; extreme-heat days projected 10→23/yr by 2055 (HVAC capex compounding) — expect insurance premiums to compound above CPI over the hold.
Questions for the listing agent
- Have any recent inspections been done? Can we get a copy of the seller's disclosures and any deferred-maintenance estimates?
- Built in 1976 — when were the roof, HVAC, electrical panel, plumbing, and water heater last replaced?
- What's the actual annual flood-insurance premium (NFIP or private), and is the property in a SFHA with mandatory coverage?
- Is there a deadline driving the sale (1031 exchange, divorce, estate, relocation)? That informs how much negotiation room exists.
- Schools are D-rated, which usually means shorter tenancies and higher turnover. Who's the typical renter profile here, and what's been the actual vacancy rate?
- What's the average days-on-market for RENTAL listings here right now (not sales)? A rising rental-DOM trend means longer vacancies and softer asking-rent achievability than the comps imply.
- What's the recent tenant-quality profile in this submarket — average credit score on applications, eviction rate, late-payment / NSF rate, and stable-employment percentage? A property-management company in the area should have these aggregated.
- How much new for-sale + rental construction is in the pipeline within 1–3 miles? Heavy new supply typically softens prices + rents 12–24 months out; constrained supply supports both.
Investment metrics
- 1% rule
- 3.44% ✓
- Cap rate
- 30.63%
- Cash-on-cash
- 86.92%
- DSCR
- 4.87
- GRM
- 2.4
CMA / ARV
No comps found within radius.
Projected returns pro-forma
-3.0% appreciation · 3.0% rent growth · sell at horizon
- IRR
- 75.5%
- Equity multiple
- 4.44×
- Total profit
- $24,063
- Equity at exit
- $3,728
- IRR
- 79.2%
- Equity multiple
- 9.19×
- Total profit
- $57,305
- Equity at exit
- $2,162
Cash invested: $7,000 (down + closing). Projections, not guarantees.
Landlord ↔ Tenant lean methodology
- Overall (STATE)
- 91 Strongly Landlord-Friendly
- State Idaho
- 91 Strongly Landlord-Friendly · R+18
- County
- — inherits STATE
- City
- — inherits STATE
ZIP-level market 83544
- Home prices YoY
- -18.4%
- Active inventory
- 81
- Price-to-rent
- 2.4×
Monthly cashflow live
- Estimated rent
- $861 medium interval (Pro) →
- Mortgage (P&I)
- −$131
- Tax est. 1.5%
- −$31 /mo · $375/yr
- Insurance
- −$10
- Flood insurance flood zone
- −$66 /mo · $798/yr
- HOA
- −$0
- Vacancy / Maint / Mgmt
- −$181
- Net cashflow
- $441
Break-even live
UW: 25.0% down · 7.5% · 30yr · 1.5% tax · 5.0% vac · 8.0% maint · 8.0% mgmt
Financing live
Cash to close
- Down payment
- $6,250
- Closing costs
- $750
- Reserves months
- —
- Total cash needed
- —
Loan-product check · same deal, 3 products live
Conventional
25% down · 7.5% · 30yr
- Down + closing
- —
- Monthly P&I
- —
- Monthly cashflow
- —
- DSCR
- —
- Eligible?
- —
Personal DTI + credit; lowest rate.
DSCR
20% down · 8.5% · 30yr
- Down + closing
- —
- Monthly P&I
- —
- Monthly cashflow
- —
- DSCR
- —
- Eligible?
- —
No personal income docs; deal must DSCR.
Hard money
10% down · 12.0% · 12mo
- Down + closing
- —
- Monthly P&I
- —
- Monthly cashflow
- —
- DSCR
- —
- Eligible?
- —
Short-term bridge; refi at stabilization.
Listing history 6 events
-
2026-06-17status $25,000 Pending 6 DOM
-
2026-06-16days on market $25,000 Active 6 DOM
-
2026-06-15days on market $25,000 Active 5 DOM
-
2026-06-13days on market $25,000 Active 3 DOM
-
2026-06-12remarks 699-char remark
-
2026-06-12$25,000 Active 2 DOM
ⓘ Source: listings_history table (triggers on properties + properties_extension) + one-shot
backfill from property_details.listing_events for pre-trigger history.
Climate risk First Street
- Flood 10/10 Extreme FEMA zone X (shaded) · 99% chance over 30 yrs
- Wildfire 6/10 Major
- Heat 5/10 Major 10 d/yr ≥95°F today · 23 d/yr by 30 yrs out
- Wind 1/10 Low
- Air quality 9/10 Extreme 16 unhealthy d/yr today · 18 by 30 yrs out
Nearby sold comps map
Loading sold comps map…
Walkable amenities ~0.75 mi
Loading nearby amenities…
Taxation est. · year 1
- Rental income
- $10,326
- − Mortgage interest
- −$1,400
- − Property taxes
- −$375
- − Insurance
- −$922
- − Repairs & maintenance
- −$826
- − Management
- −$826
- − Depreciation
- −$727
- Taxable income
- $5,249
- Est. tax owed @ 24.0%
- −$1,260
- After-tax cash flow
- $4,027/yr
For passive investors: Depreciation is non-cash, so a rental often shows a tax loss while cash-flowing — sheltering income. Rental losses are passive: they offset passive income freely, and up to $25,000/yr can offset ordinary (W-2) income if you actively participate and your MAGI is under $100k (phasing out to $0 by $150k); unused losses carry forward. On sale, claimed depreciation is recaptured at up to 25%, and gains may owe capital-gains tax (a 1031 exchange can defer both). Figures are a year-1 estimate at your 24.0% rate — not tax advice; consult a CPA.
Condition & rehab AI · 13 photos
This manufactured home is in fair condition with cosmetic updates needed. It has potential for significant value increase with updates to the kitchen, bathrooms, roof, exterior siding, flooring, and interior walls.
Repairs flagged
- Major roof — corrugated metal roof, visible wear
- Moderate exterior siding — wood siding, some discoloration
- Moderate flooring — carpeted floors, some wear
- Moderate interior walls — wood paneling, some discoloration
Value-add opportunities
- Both update kitchen cabinets and countertops — modernizing kitchen would appeal to both buyers and renters
- Both update bathrooms with new fixtures and vanity — modernizing bathrooms would appeal to both buyers and renters
- Both repair and paint roof — repairing and painting roof would improve curb appeal and functionality
- Both repair and paint exterior siding — repairing and painting exterior siding would improve curb appeal and functionality
- Both replace carpeted flooring with hardwood or tile — replacing carpeted flooring with hardwood or tile would improve functionality and curb appeal
- Both paint interior walls — painting interior walls would improve functionality and curb appeal
Renovation cost estimate screening
| Repair item | Severity | Est. cost |
|---|---|---|
| roof · corrugated metal roof, visible wear | Major | $15,000–50,000 |
| exterior siding · wood siding, some discoloration | Moderate | $3,000–15,000 |
| flooring · carpeted floors, some wear | Moderate | $3,000–15,000 |
| interior walls · wood paneling, some discoloration | Moderate | $3,000–15,000 |
| Total estimated repair cost · 4 items | $24,000–95,000 |
Value-add ROI direction
- Both update kitchen cabinets and countertops — modernizing kitchen would appeal to both buyers and renters ↑
- Both update bathrooms with new fixtures and vanity — modernizing bathrooms would appeal to both buyers and renters ↑
- Both repair and paint roof — repairing and painting roof would improve curb appeal and functionality ↑
- Both repair and paint exterior siding — repairing and painting exterior siding would improve curb appeal and functionality ↑
- Both replace carpeted flooring with hardwood or tile — replacing carpeted flooring with hardwood or tile would improve functionality and curb appeal ↑
- Both paint interior walls — painting interior walls would improve functionality and curb appeal ↑
ⓘ Cost ranges are severity-bucket heuristics (US national rule-of-thumb). Get contractor quotes + a written scope before underwriting a rehab budget.
Schools (NCES district)
- District
- Orofino Joint District
- NCES district ID
- 1602520
- Math proficiency
- 37% ▼ -4.00%
- Reading proficiency
- 56% ▲ 3.00%
- Median HH income
- $41,114
- Composite
- 38.96/100
- National rank
- #4079
- State rank
- #45 of 92 in ID
Livability — Orofino
- Score
- 76/100
- State rank
- #27
- US rank
- #3806
Category grades
Schools grade is shown separately in the Schools card above.
Census & demographics
- Population (ZIP)
- 6,476
Population outlook (Clearwater County) Hauer SSP2
- Today (2025)
- 8,244 people
- By 2030
- 8,093 · -1.8%
- By 2040
- 7,821 · -5.1%
- By 2050
- 7,740 · -6.1%
- By 2075
- 7,777 · -5.7%
- By 2100
- 6,982 · -15.3%
Race, ethnicity, and origin ACS 2023
- Neighborhood character
- Predominantly White (87%)
- Race & ethnicity
- White 87% Two or more races 7% Hispanic / Latino 5% Asian 1% Native American 1%
- Hispanic origin (detail)
- Mexican 4%
- Common ancestry
- Slovak 4% Lithuanian 3% Portuguese 2%
- Foreign-born
- 3% · Canada
- Languages at home
- 97% English-only · Spanish 2% Tagalog/Filipino 1%
Political lean MEDSL · Clearwater
- 2024 margin
- Solid R (+62.8) · D 17.5% · R 80.3% · Other 2.1%
- 2008→2024 swing
- -28.1pp toward R · 2008: -34.8pp · 2024: -62.8pp
- All cycles
- 2024: R+62.8 2020: R+58.3 2016: R+56.5 2012: R+40.8 2008: R+34.8
Not yet ingested
- Civics
- —
Market trends
- HPI YoY
- ▼ -68.58%
- Current HPI
- 304.5259
- Rent YoY
- —
- Metro
- —
- State GDP YoY
- ▲ 4.51%
- F500 in state
- 6
Industry mix (Fortune 500 HQ in ID)
| Industry | F500 HQs | Revenue |
|---|---|---|
| Retail | 1 | $79B |
|
||
| Technology | 1 | $25B |
|
||
| Food / Agriculture | 1 | $6B |
|
||
Price history
1 event — show timeline
- 2026-06-10 Listed $25,000 IMLS
Cash-flow waterfall
monthlySold comps — $/sqft
last 12 mo · ≤1 miLoading sold comps…