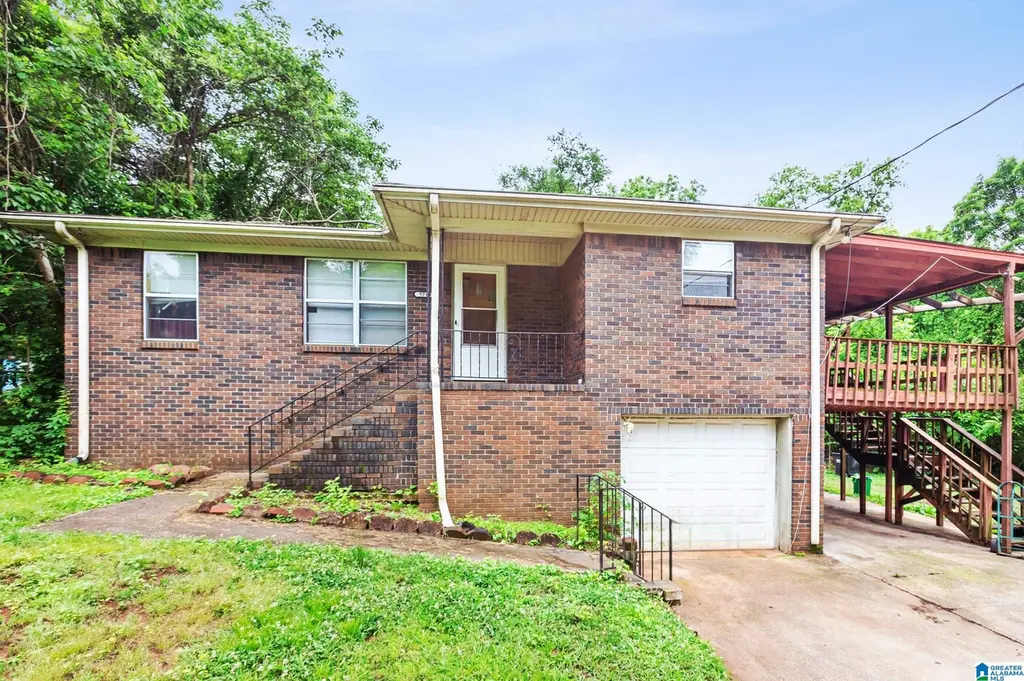
5713 14th St S · Lipscomb, AL
Flood risk 1/10 · Minimal
- FEMA flood zone
- X (unshaded)
- Chance of flooding over 30 yrs
- 0.0%
- Est. flood insurance / yr
- $473 – $860
Fire risk 3/10 · Minor
- Est. fire insurance / yr
- $916 – $1,700
Heat risk 6/10 · Moderate
- Hot days now (above 107°F)
- 7 days/yr
- Hot days in 30 yrs
- 19 days/yr
Wind risk 6/10 · Moderate
- Chance of severe wind over 30 yrs
- 27.0%
Air-quality risk 3/10 · Minor
- Unhealthy air days now
- 2 days/yr
- Unhealthy air days in 30 yrs
- 5 days/yr
Risk factors via First Street. Map © Google.
Why this score? — see what drove the B grade
The composite is a weighted blend of 9 inputs, each scored 0–100. Each bar is that input's sub-score; the figure is the points it added to the 100-point composite (weight × sub-score).
- Cash flow +30.0/30.0
- ARV discount +15.0/15.0
- 1% rule +10.0/10.0
- DSCR +10.0/10.0
- Livability +3.4/5.0
- Condition / age +2.5/5.0
- Schools +1.8/10.0
- Rent growth +1.7/5.0
- Appreciation +0.0/10.0
$80,000
🖨 Deal sheet (PDF) 📄 Offer letter ✓ Due diligence
Listing remarks
INVESTOR'S DREAM or PERFECT STARTER HOME! This cozy 3-bedroom, 2-bath brick home features a full basement and sits on a spacious property that includes two additional lots — offering endless potential for expansion, rental income, or resale. The home’s solid brick construction provides lasting durability, while the layout offers comfort and charm. With a little TLC, this property will shine as a wonderful family home or profitable investment. Don’t miss this rare opportunity to own a home with extra land and room to grow!
Key facts
- Two additional lots
- Extra land
- Full basement
Tags
Property features AI
Finance
- Financial info: Monthly garbage fee ($20)
- HOA & community: No association fee
Exterior
- Parking: Front garage entry; Basement parking with 1 garage space; Detached or additional carport space (1); Circular driveway and on-street parking
- Utilities: Public water; Septic system; Gas water heater
- Home design: 4-sided brick construction; Basement foundation; Existing (previously built) property
- Construction: 4-sided brick exterior; Basement foundation (poured concrete walls); Finished basement
- Exterior features: Covered and open decks; Covered patio; Porch; Lighting system; Street lights; Interior lot with some trees; vacant lot characteristics
Interior
- Kitchen: Laminate countertops; Gas cooktop; Built-in dishwasher; Gas oven
- Bedrooms: Master bedroom on main level; Additional bedrooms on main level
- Flooring: Carpet; Hardwood; Vinyl
- Bathrooms: Two full bathrooms; One half bathroom; Tubs with shower combo and linen closet
- Heating & cooling: Central heating (gas); Central air (electric)
- Interior features: 9+ ft. smooth ceilings; One fireplace with gas starter located in the den; Finished full basement with poured concrete walls; Attic with pull-down access; No additional built-in interior features listed
- Laundry & utility: Laundry in basement; Utility sink; Washer hookup; Electric dryer hookup
Neighborhood map
What this means for you Summary
Snapshot
- This is a 3-bed/1.5-bath single-family listed at $80k.
Deal economics
- At list price, monthly cash flow is $505 ($6k/yr) — positive.
- The deal already cash-flows at list — no discount required.
- Meets the 1% rule at list price ($1k rent vs $80k).
- Recommended offer: $78k (3.0% below list) — sets the bar for market timing.
Location & tenants
- Location reads 67/100 on livability (#76 in AL) — a middle-class / working-renter tenant base. Strengths: crime A+, commute A+, cost of living A+; Watch: amenities F, employment F, health & safety F.
- Jefferson County (suburban): math 9% / reading 32% proficiency, ranked #104 of 129 in AL (top 81%) — low school quality limits family demand, transient renter base, plan for 1-2y turnover.
- Zoned schools: Lipscomb Elementary School (math 8% / reading 27%, grade F, #486 of 627 statewide, top 79%, 259 students, 96% FRL); Mcadory Middle School (math 2% / reading 33%, grade F, #199 of 257 statewide, top 77%, 854 students, 74% FRL); Mcadory High School (math 8% / reading 17%, grade F, #237 of 305 statewide, top 78%, 1,162 students, 72% FRL) — zoned schools average 81% FRL vs 49% district-wide (32 pts higher); higher-poverty schools than district average — tighter screening recommended.
- Market conditions: Rents falling (-3.1%/yr); 117 active listings in the ZIP; 14 comparable units currently listed for rent nearby; rentals lingering (median 46d on market — plan ~5-8 weeks vacancy on turnover, expect pricing pressure); 64% of comp listings sitting > 30 days — soft ceiling on asking rent; lower-income renter base — watch delinquency; 2,114 units permitted in Jefferson County in 2024 (556 in 5+ unit buildings).
- This rent runs 43% of the median local income ($35k/yr) — at the standard rent-burdened threshold; future hikes will face affordability resistance.
Forward outlook
- Local home prices are declining (-3.0%/yr); year-one equity from $553 of loan paydown is wiped out by about $2k of value loss. Plan a longer hold.
- Jefferson County population projected to shrink 4% by 2050 — rents likely to lag national; underwrite the cash flow, not the appreciation.
- At projected returns (-3.0% appreciation + 0.0% rent growth), your $22k cash investment doubles in ~6 years — after that, you're playing with house money.
Negotiation context
- It's been on market 37 days — a 3% lower offer ($78k) is reasonable based on typical stale-listing flexibility.
Risks & watch-outs
- Climate carrying-cost: major wind risk, 27% chance of damaging wind over 30y; extreme-heat days projected 7→19/yr by 2055 (HVAC capex compounding) — expect insurance premiums to compound above CPI over the hold.
Questions for the listing agent
- It's been on market 37 days. Have you received any prior offers? Is the seller open to a 3% concession, seller financing, or rate buy-down credit?
- Built in 1967 — when were the roof, HVAC, electrical panel, plumbing, and water heater last replaced?
- Is there a deadline driving the sale (1031 exchange, divorce, estate, relocation)? That informs how much negotiation room exists.
- Schools are F-rated, which usually means shorter tenancies and higher turnover. Who's the typical renter profile here, and what's been the actual vacancy rate?
- What's the average days-on-market for RENTAL listings here right now (not sales)? A rising rental-DOM trend means longer vacancies and softer asking-rent achievability than the comps imply.
- What's the recent tenant-quality profile in this submarket — average credit score on applications, eviction rate, late-payment / NSF rate, and stable-employment percentage? A property-management company in the area should have these aggregated.
- How much new for-sale + rental construction is in the pipeline within 1–3 miles? Heavy new supply typically softens prices + rents 12–24 months out; constrained supply supports both.
Investment metrics
- 1% rule
- 1.59% ✓
- Cap rate
- 13.87%
- Cash-on-cash
- 27.06%
- DSCR
- 2.20
- GRM
- 5.2
CMA / ARV
- ARV (median comp)
- $128,562
- List price
- $80,000
- Delta
- -37.77%
- Verdict
- UNDERPRICED
- Comps
- 7 within 2.0 mi
Show comp detail 6 sales within ~0.75 mi
| Address | Dist | Beds/Ba | Sqft | Sold | Price | $/sf | Match |
|---|---|---|---|---|---|---|---|
| 5803 Avenue G | 0.36mi | 4/2.0 (+1) | 1,487 (-1%) | 1mo | $125,000 | $84 | 73 |
| 6600 Ave K | 0.22mi | 3/2.0 | 1,662 (+10%) | 18mo | $82,000 | $49 | 56 |
| 5710 Avenue J | 0.44mi | 3/1.0 | 1,352 (-10%) | 13mo | $59,000 | $44 | 49 |
| 5701 Avenue O | 0.58mi | 3/1.0 | 1,364 (-9%) | 8mo | $38,000 | $28 | 48 |
| 5604 5th St S | 0.66mi | 2/1.0 (-1) | 1,391 (-8%) | 2mo | $99,900 | $72 | 48 |
| 2002 Dawson Ave | 0.61mi | 3/2.0 | 1,352 (-10%) | 22mo | $49,100 | $36 | 34 |
Match score weights: distance 35% · size 25% · config 20% · recency 20%. Top-matched comps best support the ARV.
Projected returns pro-forma
-3.0% appreciation · 0.0% rent growth · sell at horizon
- IRR
- 17.7%
- Equity multiple
- 1.69×
- Total profit
- $15,472
- Equity at exit
- $11,928
- IRR
- 24.1%
- Equity multiple
- 2.81×
- Total profit
- $40,443
- Equity at exit
- $6,917
Cash invested: $22,400 (down + closing). Projections, not guarantees.
Landlord ↔ Tenant lean methodology
- Overall (STATE)
- 90 Strongly Landlord-Friendly
- State Alabama
- 90 Strongly Landlord-Friendly · R+15
- County
- — inherits STATE
- City
- — inherits STATE
ZIP-level market 35020
- Home prices YoY
- -24.2%
- Rents YoY
- -3.1%
- Active inventory
- 117
- Price-to-rent
- 5.2×
Monthly cashflow live
- Estimated rent
- $1,272 high interval (Pro) →
- Mortgage (P&I)
- −$420
- Tax from tax record
- −$47 /mo · $563/yr
- Insurance
- −$33
- HOA
- −$0
- Lot rent
- −$0
- Vacancy / Maint / Mgmt
- −$267
- Net cashflow
- $505
Break-even live
Sensitivity live
| Price | -10% $550 | -5% $528 | +0% $505 | +5% $483 | +10% $460 |
|---|---|---|---|---|---|
| Rent | -10% $405 | -5% $455 | +0% $505 | +5% $555 | +10% $606 |
| Rate | -1.0pp $545 | -0.5pp $526 | base $505 | +0.5pp $484 | +1.0pp $463 |
UW: 25.0% down · 7.5% · 30yr · 1.5% tax · 5.0% vac · 8.0% maint · 8.0% mgmt
Financing live
Cash to close
- Down payment
- $20,000
- Closing costs
- $2,400
- Reserves months
- —
- Total cash needed
- —
Loan-product check · same deal, 3 products live
Conventional
25% down · 7.5% · 30yr
- Down + closing
- —
- Monthly P&I
- —
- Monthly cashflow
- —
- DSCR
- —
- Eligible?
- —
Personal DTI + credit; lowest rate.
DSCR
20% down · 8.5% · 30yr
- Down + closing
- —
- Monthly P&I
- —
- Monthly cashflow
- —
- DSCR
- —
- Eligible?
- —
No personal income docs; deal must DSCR.
Hard money
10% down · 12.0% · 12mo
- Down + closing
- —
- Monthly P&I
- —
- Monthly cashflow
- —
- DSCR
- —
- Eligible?
- —
Short-term bridge; refi at stabilization.
Rent comps 14 comps
| Address | Beds | Baths | Sqft | Rent | $/sqft | DOM | Units | Dist |
|---|---|---|---|---|---|---|---|---|
| 5709 13th St S Bessemer, AL | 3.0 | 1.0 | 1120 | $1,200 | $1.07 | 46d | 1 | 0.03mi |
| 5606 Avenue K Bessemer, AL | 4.0 | 2.0 | 1940 | $1,300 | $0.67 | 5d | 1 | 0.50mi |
| 6029 Ivy St Birmingham, AL | 4.0 | 2.0 | 1234 | $1,200 | $0.97 | 46d | 1 | 0.58mi |
| 6025 Ivy St Birmingham, AL | 4.0 | 2.0 | 1232 | $1,300 | $1.06 | 46d | 1 | 0.59mi |
| 5912 Owen St Bessemer, AL | 3.0 | 1.5 | 1192 | $1,300 | $1.09 | 46d | 1 | 0.63mi |
| 5624 Cairo Ave Birmingham, AL | 4.0 | 2.0 | 1386 | $1,200 | $0.87 | 46d | 1 | 1.10mi |
| 63 Wilkes Cir Birmingham, AL | 4.0 | 1.0 | 1164 | $1,200 | $1.03 | 46d | 1 | 1.35mi |
| 63 Wilkes Cir Unit 1 Birmingham, AL | 4.0 | 1.0 | 1164 | $1,250 | $1.07 | 46d | 1 | 1.35mi |
| 80 Wilkes Cir Birmingham, AL | 4.0 | 2.0 | 1078 | $1,200 | $1.11 | 17d | 1 | 1.38mi |
| 3216 Avenue B Unit B Bessemer, AL | 3.0 | 2.0 | 1220 | $1,100 | $0.90 | 46d | 1 | 1.42mi |
| 101 Leaf Lake Blvd Unit 1104 Birmingham, AL | 2.0 | 2.0 | 1295 | $1,440 | $1.11 | 5d | 1 | 1.45mi |
| 101 Leaf Lake Blvd Apt 803 Birmingham, AL | 2.0 | 2.0 | 1295 | $1,500 | $1.16 | 12d | 1 | 1.45mi |
| 101 Leaf Lake Blvd Apt 411 Birmingham, AL | 2.0 | 2.0 | 1198 | $1,400 | $1.17 | 5d | 1 | 1.45mi |
| 3230 Arlington Ave Bessemer, AL | 2.0 | 2.0 | 1236 | $795 | $0.64 | 46d | 1 | 1.45mi |
Listing history 15 events
-
2026-06-22statusdays on market $80,000 Pending 37 DOM
-
2026-06-18days on market $80,000 Active 36 DOM
-
2026-06-17days on market $80,000 Active 35 DOM
-
2026-06-16days on market $80,000 Active 34 DOM
-
2026-06-15days on market $80,000 Active 33 DOM
-
2026-06-13days on market $80,000 Active 31 DOM
-
2026-06-10days on market $80,000 Active 28 DOM
-
2026-06-09days on market $80,000 Active 27 DOM
-
2026-06-08days on market $80,000 Active 26 DOM
-
2026-06-07days on market $80,000 Active 25 DOM
-
2026-06-03days on market $80,000 Active 21 DOM
-
2026-06-02days on market $80,000 Active 20 DOM
-
2026-06-01days on market $80,000 Active 19 DOM
-
2026-05-31days on market $80,000 Active 18 DOM
-
2026-05-12$119,900 Active 545-char remark
ⓘ Source: listings_history table (triggers on properties + properties_extension) + one-shot
backfill from property_details.listing_events for pre-trigger history.
Tax reassessment forecast AL · Resets to sale price
- Current annual tax
- $563 · $47/mo
- Projected year-2 tax
- $563 · $47/mo
- Expected delta
- $0/yr ($0/mo · 0.0%)
ⓘ Screening estimate from a state-policy table — verify with the county assessor before closing.
Climate risk First Street
- Flood 1/10 Low FEMA zone X (unshaded) · 0% chance over 30 yrs
- Wildfire 3/10 Moderate
- Heat 6/10 Major 7 d/yr ≥107°F today · 19 d/yr by 30 yrs out
- Wind 6/10 Major 27% chance of damaging wind over 30 yrs
- Air quality 3/10 Moderate 2 unhealthy d/yr today · 5 by 30 yrs out
Nearby sold comps map
Loading sold comps map…
Walkable amenities ~0.75 mi
Loading nearby amenities…
Taxation est. · year 1
- Rental income
- $15,265
- − Mortgage interest
- −$4,481
- − Property taxes
- −$563
- − Insurance
- −$400
- − Repairs & maintenance
- −$1,221
- − Management
- −$1,221
- − Depreciation
- −$2,327
- Taxable income
- $5,051
- Est. tax owed @ 24.0%
- −$1,212
- After-tax cash flow
- $4,850/yr
For passive investors: Depreciation is non-cash, so a rental often shows a tax loss while cash-flowing — sheltering income. Rental losses are passive: they offset passive income freely, and up to $25,000/yr can offset ordinary (W-2) income if you actively participate and your MAGI is under $100k (phasing out to $0 by $150k); unused losses carry forward. On sale, claimed depreciation is recaptured at up to 25%, and gains may owe capital-gains tax (a 1031 exchange can defer both). Figures are a year-1 estimate at your 24.0% rate — not tax advice; consult a CPA.
Schools (NCES district)
- District
- Jefferson County
- NCES district ID
- 0101920
- Math proficiency
- 9% ▼ -24.00%
- Reading proficiency
- 32% ▼ -5.00%
- Median HH income
- $51,712
- Composite
- 18.4/100
- National rank
- #8937
- State rank
- #104 of 129 in AL
Livability — Lipscomb
- Score
- 67/100
- State rank
- #76
- US rank
- #10121
Category grades
Schools grade is shown separately in the Schools card above.
Census & demographics
- Census place
- Lipscomb, AL
- County
- Jefferson County · 527,445 people
- Metro
- Birmingham-Hoover, AL
- Population (ZIP)
- 24,892
- Household income
- $35,362
- Rent vs Own
- Severe rent burden
- 1001.0
Population outlook (Jefferson County) Hauer SSP2
- Today (2025)
- 669,185 people
- By 2030
- 669,694 · +0.1%
- By 2040
- 661,388 · -1.2%
- By 2050
- 643,086 · -3.9%
- By 2075
- 577,267 · -13.7%
- By 2100
- 474,758 · -29.1%
Race, ethnicity, and origin ACS 2023
- Neighborhood character
- Predominantly Black (74%)
- Race & ethnicity
- Black 74% Hispanic / Latino 13% White 11% Two or more races 6%
- Hispanic origin (detail)
- Mexican 10%
- Foreign-born
- 5% · Canada
- Languages at home
- 89% English-only · Spanish 11%
Political lean MEDSL · Jefferson
- 2024 margin
- D (+10.4) · D 54.6% · R 44.2% · Other 1.2%
- 2008→2024 swing
- +5.4pp toward D · 2008: 5.1pp · 2024: 10.4pp
- All cycles
- 2024: D+10.4 2020: D+13.2 2016: D+7.2 2012: D+6.0 2008: D+5.1
Not yet ingested
- Civics
- —
Market trends
- HPI YoY
- ▼ -57.54%
- Current HPI
- 179.7702
- Rent YoY
- ▼ -3.12%
- Metro
- Birmingham-Hoover, AL
- State GDP YoY
- ▲ 2.94%
- F500 in state
- 4
Industry mix (Fortune 500 HQ in AL)
| Industry | F500 HQs | Revenue |
|---|---|---|
| Financial Services | 1 | $8B |
|
||
| Healthcare | 1 | $5B |
|
||
Price history
-33.3% since first listed2 events — show timeline
- 2026-05-27 Price Changed $80,000 Greater Alabama MLS
- 2026-05-12 Listed $119,900 Greater Alabama MLS
Property tax history
+1.5%/yrLatest (2025): $563 · +0.0% YoY. Source: county tax records.
Cash-flow waterfall
monthlySold comps — $/sqft
last 12 mo · ≤1 miLoading sold comps…