 36-Plex
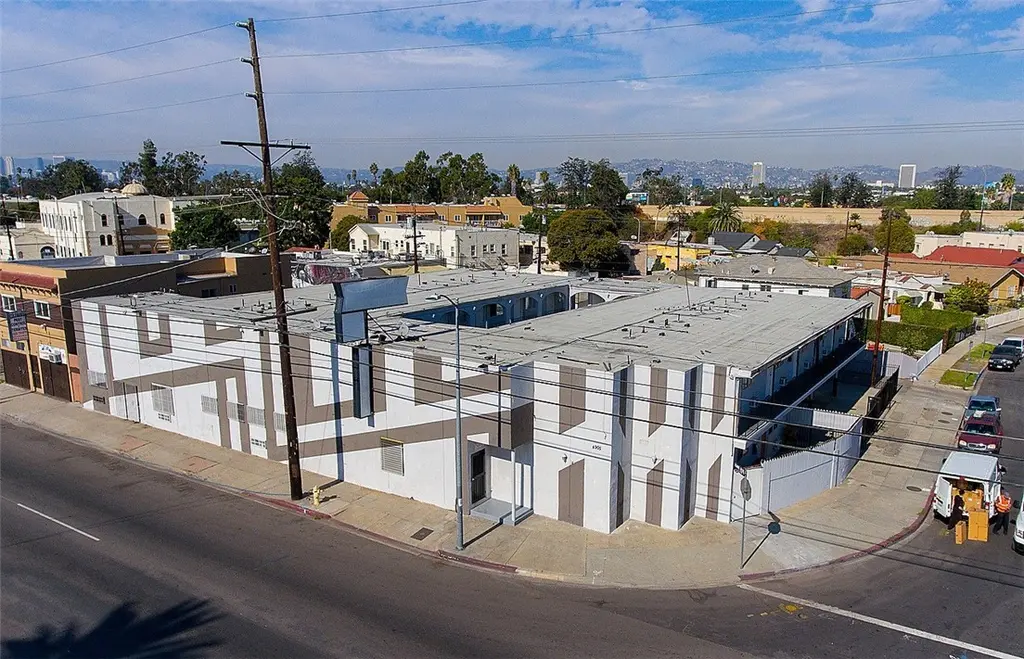
4905 W Adams Blvd · Los Angeles, CA
Flood risk No data
- FEMA flood zone
- —
- Chance of flooding over 30 yrs
- —
- Est. flood insurance / yr
- —
Fire risk No data
- Est. fire insurance / yr
- —
Heat risk No data
- Hot days now (above threshold)
- —
- Hot days in 30 yrs
- —
Wind risk No data
- Chance of severe wind over 30 yrs
- —
Air-quality risk No data
- Unhealthy air days now
- —
- Unhealthy air days in 30 yrs
- —
Risk factors via First Street. Map © Google.
Why this score? — see what drove the B grade
The composite is a weighted blend of 9 inputs, each scored 0–100. Each bar is that input's sub-score; the figure is the points it added to the 100-point composite (weight × sub-score).
- Cash flow +30.0/30.0
- 1% rule +10.0/10.0
- DSCR +10.0/10.0
- ARV discount +7.5/15.0
- Condition / age +4.2/5.0
- Schools +3.6/10.0
- Livability +3.4/5.0
- Rent growth +2.8/5.0
- Appreciation +0.0/10.0
$4,950,000
🖨 Deal sheet 📄 Offer letter ✓ Due diligence
Multi-family units
County records classify this as Multi-Family (5+ Unit). Listing-text estimate: 36 units. confirmed
5+ unit building — per-unit beds/baths from public records are typically unavailable; the breakdown below (if shown) is an estimate from the listing text.
Listing remarks MLS
Discover a prime investment opportunity at West Adams Studios! Located at 4905 W Adams Blvd, Los Angeles, CA 90016, this 36-unit property in the thriving West Adams market presents an attractive option for savvy investors. Renovated in 2018 with over $500,000 in upgrades, including new plumbing, electrical systems, and modern finishes, this turn-key asset promises a hassle-free ownership experience. Boasting a high-efficiency micro-unit model, with studios comprising 91% of the unit mix, West Adams Studios offers a lucrative rental yield per square foot. With a current cap rate of 8.03%, this property demonstrates strong stabilized income generation potential. Don't miss out on this opportunity to invest in a well-maintained property in a desirable location with excellent income prospects. Take the next step towards maximizing your real estate portfolio with West Adams Studios! Turn-Key Renovated Asset with Significant Capital Improvements: This 36-unit apartment building underwent a comprehensive renovation in 2018, with over $500,000 in completed upgrades. The renovation included new plumbing, electrical systems, drywall, paint, flooring, and cabinetry, offering a modernized, turn-key investment for savvy investors. Proven "Micro Unit" Model Maximizing High PSF Rental Yield: Comprised primarily of studio units (91% of the unit mix), the property utilizes a high-efficiency micro-unit model that is easier to rent in the Los Angeles market. This design yields an impressive actual rent of $5.40 per square foot—with some units reaching as high as $6.67 PSF—justifying the asset’s valuation through proven rental performance. Substantial Built-in Value Add via ADU Potential: The property offers an unparalleled opportunity to capitalize on the city's Accessory Dwelling Unit (ADU) ordinance. Investors can potentially add 9+ units in the existing parking areas, significantly increasing the total unit count and exponentially growing the property’s longterm asset value. Exceptional Current Yield and Financial Stability: Offered at $4,950,000, the asset delivers a strong current CAP rate of 8.03% and a 9.99% Cash-on-Cash return. Maintaining a robust 95% occupancy rate, the property acts as a "cash flow machine, " providing immediate and reliable Net Operating Income of $397,612.
Key facts
- Renovated in 2018
- New plumbing
- 0.31 acre lot
Tags
Neighborhood map
What this means for you Summary
Snapshot
- This is a 36 × 1-bed/1-bath units multifamily listed at $4.95M. Condition is rated good.
Deal economics
- At list price, monthly cash flow is $32k ($380k/yr) — positive. Per door: $880/mo.
- The deal already cash-flows at list — no discount required.
- Meets the 1% rule at list price ($83k rent vs $4.95M).
- Recommended offer: $4.50M (9.0% below list) — sets the bar for market timing.
- Cap rate 14.0% vs local median 2.1% in Los Angeles — top-decile yield for the area; either an underpriced asset or a hidden risk that comps aren't pricing in. Stress-test before assuming the spread holds.
Location & tenants
- Location reads 68/100 on livability (#273 in CA) — a middle-class / working-renter tenant base. Strengths: amenities A+, commute A+, employment B; Watch: health & safety C-, schools D+, crime F.
- Los Angeles Unified (urban): math 29% / reading 54% proficiency, ranked #223 of 517 in CA (top 43%) — families likely to look elsewhere, expect single-tenant / working-renter base with shorter leases; 67% free/reduced lunch — lower-income household profile, screen leases tightly.
- Market conditions: Rents rising (+1.1%/yr); 149 active listings in the ZIP; 19,697 units permitted in Los Angeles County in 2024 (9,426 in 5+ unit buildings).
- At $83,385/mo this rent would consume 1361% of the median local household income ($74k/yr) (locally 3450% of renters already pay >50% of income on rent) — very limited rent-growth headroom before tenants either downsize or default.
Forward outlook
- Local home prices are declining (-3.0%/yr); year-one equity from $34k of loan paydown is wiped out by about $148k of value loss. Plan a longer hold.
- Los Angeles County population projected at +9% by 2050 — modest demand growth; plan on rents tracking national, not racing it.
- At projected returns (-3.0% appreciation + 1.1% rent growth), your $1.39M cash investment doubles in ~5 years — after that, you're playing with house money.
Negotiation context
- It's been on market 111 days — a 9% lower offer ($4.50M) is reasonable based on typical stale-listing flexibility.
- 8 sale attempts since 3y ago with the ask held roughly flat each time — persistent listings suggest the price (not the market) is what's stuck; bring a comps-based counter.
Questions for the listing agent
- It's been on market 111 days. Have you received any prior offers? Is the seller open to a 9% concession, seller financing, or rate buy-down credit?
- Can we see the unit-by-unit rent roll, current vacancy, and any below-market leases? What's the average tenancy length?
- What capital expenditures (roof, boiler, parking lot, exteriors) have been made in the last 5 years, and what's planned in the next 2?
- Built in 1964 — when were the roof, HVAC, electrical panel, plumbing, and water heater last replaced?
- Why hasn't it sold? Are there any deal-killer items the seller is aware of (foundation, flood, title, zoning, code violations)?
- Is there a deadline driving the sale (1031 exchange, divorce, estate, relocation)? That informs how much negotiation room exists.
- Schools are D-rated, which usually means shorter tenancies and higher turnover. Who's the typical renter profile here, and what's been the actual vacancy rate?
- Crime grade is F in this area — have there been break-ins, vandalism, or insurance claims at this property in the last 3 years? What carrier currently insures it and at what premium?
- What's the average days-on-market for RENTAL listings here right now (not sales)? A rising rental-DOM trend means longer vacancies and softer asking-rent achievability than the comps imply.
- What's the recent tenant-quality profile in this submarket — average credit score on applications, eviction rate, late-payment / NSF rate, and stable-employment percentage? A property-management company in the area should have these aggregated.
- How much new apartment / multifamily construction is in the pipeline within 1–3 miles? Heavy new supply (>2% of stock underway) typically softens rents 12–24 months out; light construction supports rent growth.
Investment metrics
- 1% rule
- 1.68% ✓
- Cap rate
- 13.97%
- Cash-on-cash
- 27.42%
- DSCR
- 2.22
- GRM
- 4.9
CMA / ARV
- ARV (median comp)
- $3,112,477
- List price
- $4,950,000
- Delta
- 59.04%
- Verdict
- OVERPRICED
- Comps
- 20 within 1.0 mi
Projected returns pro-forma
-3.0% appreciation · 1.12% rent growth · sell at horizon
- IRR
- 19.3%
- Equity multiple
- 1.77×
- Total profit
- $1,061,121
- Equity at exit
- $738,061
- IRR
- 26.3%
- Equity multiple
- 3.10×
- Total profit
- $2,914,275
- Equity at exit
- $427,986
Cash invested: $1,386,000 (down + closing). Projections, not guarantees.
Landlord ↔ Tenant lean methodology
- Overall (CITY)
- 0 Strongly Tenant-Friendly
- State California
- 18 Strongly Tenant-Friendly · D+13
- County
- — inherits STATE
- City Los Angeles
- 0 Strongly Tenant-Friendly · D+22
ZIP-level market 90016
- Rents YoY
- 1.1%
- Active inventory
- 149
- Price-to-rent
- 178.1×
Monthly cashflow live
- Estimated rent
- $83,385 high interval (Pro) →
- Mortgage (P&I)
- −$25,958
- Tax est. 1.5%
- −$6,188 /mo · $74,250/yr
- Insurance
- −$2,062
- HOA
- −$0
- Vacancy / Maint / Mgmt
- −$17,511
- Net cashflow
- $31,666
Break-even live
36-unit breakdown (identical units grouped — click to expand)
| Units | Beds | Baths | Est. rent |
|---|---|---|---|
| 36× units | 1 | 1 | $83,376 |
| #1 | 1 | 1 | $2,316 |
| #2 | 1 | 1 | $2,316 |
| #3 | 1 | 1 | $2,316 |
| #4 | 1 | 1 | $2,316 |
| #5 | 1 | 1 | $2,316 |
| #6 | 1 | 1 | $2,316 |
| #7 | 1 | 1 | $2,316 |
| #8 | 1 | 1 | $2,316 |
| #9 | 1 | 1 | $2,316 |
| #10 | 1 | 1 | $2,316 |
| #11 | 1 | 1 | $2,316 |
| #12 | 1 | 1 | $2,316 |
| #13 | 1 | 1 | $2,316 |
| #14 | 1 | 1 | $2,316 |
| #15 | 1 | 1 | $2,316 |
| #16 | 1 | 1 | $2,316 |
| #17 | 1 | 1 | $2,316 |
| #18 | 1 | 1 | $2,316 |
| #19 | 1 | 1 | $2,316 |
| #20 | 1 | 1 | $2,316 |
| #21 | 1 | 1 | $2,316 |
| #22 | 1 | 1 | $2,316 |
| #23 | 1 | 1 | $2,316 |
| #24 | 1 | 1 | $2,316 |
| #25 | 1 | 1 | $2,316 |
| #26 | 1 | 1 | $2,316 |
| #27 | 1 | 1 | $2,316 |
| #28 | 1 | 1 | $2,316 |
| #29 | 1 | 1 | $2,316 |
| #30 | 1 | 1 | $2,316 |
| #31 | 1 | 1 | $2,316 |
| #32 | 1 | 1 | $2,316 |
| #33 | 1 | 1 | $2,316 |
| #34 | 1 | 1 | $2,316 |
| #35 | 1 | 1 | $2,316 |
| #36 | 1 | 1 | $2,316 |
| Total (36 units) | $83,385 | ||
UW: 25.0% down · 7.5% · 30yr · 1.5% tax · 5.0% vac · 8.0% maint · 8.0% mgmt
Financing live
Cash to close
- Down payment
- $1,237,500
- Closing costs
- $148,500
- Reserves months
- —
- Total cash needed
- —
Loan-product check · same deal, 3 products live
Conventional
25% down · 7.5% · 30yr
- Down + closing
- —
- Monthly P&I
- —
- Monthly cashflow
- —
- DSCR
- —
- Eligible?
- —
Personal DTI + credit; lowest rate.
DSCR
20% down · 8.5% · 30yr
- Down + closing
- —
- Monthly P&I
- —
- Monthly cashflow
- —
- DSCR
- —
- Eligible?
- —
No personal income docs; deal must DSCR.
Hard money
10% down · 12.0% · 12mo
- Down + closing
- —
- Monthly P&I
- —
- Monthly cashflow
- —
- DSCR
- —
- Eligible?
- —
Short-term bridge; refi at stabilization.
Listing history 28 events
-
2026-06-18days on market $4,950,000 Active 111 DOM
-
2026-06-17days on market $4,950,000 Active 110 DOM
-
2026-06-16days on market $4,950,000 Active 109 DOM
-
2026-06-15days on market $4,950,000 Active 108 DOM
-
2026-06-13days on market $4,950,000 Active 106 DOM
-
2026-06-09days on market $4,950,000 Active 102 DOM
-
2026-06-08days on market $4,950,000 Active 101 DOM
-
2026-06-07days on market $4,950,000 Active 100 DOM
-
2026-06-04days on market $4,950,000 Active 97 DOM
-
2026-06-03days on market $4,950,000 Active 96 DOM
-
2026-06-02days on market $4,950,000 Active 95 DOM
-
2026-06-01days on market $4,950,000 Active 94 DOM
-
2026-05-31days on market $4,950,000 Active 93 DOM
-
2026-02-27$4,950,000 Active 2354-char remark
Show marketing remark (2354 chars)
Discover a prime investment opportunity at West Adams Studios! Located at 4905 W Adams Blvd, Los Angeles, CA 90016, this 36-unit property in the thriving West Adams market presents an attractive option for savvy investors. Renovated in 2018 with over $500,000 in upgrades, including new plumbing, electrical systems, and modern finishes, this turn-key asset promises a hassle-free ownership experience. Boasting a high-efficiency micro-unit model, with studios comprising 91% of the unit mix, West Adams Studios offers a lucrative rental yield per square foot. With a current cap rate of 8.03%, this property demonstrates strong stabilized income generation potential. Don't miss out on this opportunity to invest in a well-maintained property in a desirable location with excellent income prospects. Take the next step towards maximizing your real estate portfolio with West Adams Studios! Turn-Key Renovated Asset with Significant Capital Improvements: This 36-unit apartment building underwent a comprehensive renovation in 2018, with over $500,000 in completed upgrades. The renovation included new plumbing, electrical systems, drywall, paint, flooring, and cabinetry, offering a modernized, turn-key investment for savvy investors. Proven "Micro Unit" Model Maximizing High PSF Rental Yield: Comprised primarily of studio units (91% of the unit mix), the property utilizes a high-efficiency micro-unit model that is easier to rent in the Los Angeles market. This design yields an impressive actual rent of $5.40 per square foot—with some units reaching as high as $6.67 PSF—justifying the asset’s valuation through proven rental performance. Substantial Built-in Value Add via ADU Potential: The property offers an unparalleled opportunity to capitalize on the city's Accessory Dwelling Unit (ADU) ordinance. Investors can potentially add 9+ units in the existing parking areas, significantly increasing the total unit count and exponentially growing the property’s longterm asset value. Exceptional Current Yield and Financial Stability: Offered at $4,950,000, the asset delivers a strong current CAP rate of 8.03% and a 9.99% Cash-on-Cash return. Maintaining a robust 95% occupancy rate, the property acts as a "cash flow machine, " providing immediate and reliable Net Operating Income of $397,612.
-
2025-07-17Active
-
2024-05-10historical $1,695
-
2024-05-04$1,695
-
2024-04-12historical $1,595
-
2024-04-10$1,595
-
2024-04-10historical $1,495
-
2024-04-05$1,495
-
2024-04-05historical $1,595
-
2024-03-31$1,595
-
2024-03-31historical $1,595
-
2024-03-13price $1,595
-
2024-01-24historical $1,462
-
2024-01-24$1,462
-
2023-12-20$1,495
ⓘ Source: listings_history table (triggers on properties + properties_extension) + one-shot
backfill from property_details.listing_events for pre-trigger history.
Nearby sold comps map
Loading sold comps map…
Walkable amenities ~0.75 mi
Loading nearby amenities…
Taxation est. · year 1
- Rental income
- $1,000,620
- − Mortgage interest
- −$277,277
- − Property taxes
- −$74,250
- − Insurance
- −$24,750
- − Repairs & maintenance
- −$80,050
- − Management
- −$80,050
- − Depreciation
- −$144,000
- Taxable income
- $320,244
- Est. tax owed @ 24.0%
- −$76,859
- After-tax cash flow
- $303,131/yr
For passive investors: Depreciation is non-cash, so a rental often shows a tax loss while cash-flowing — sheltering income. Rental losses are passive: they offset passive income freely, and up to $25,000/yr can offset ordinary (W-2) income if you actively participate and your MAGI is under $100k (phasing out to $0 by $150k); unused losses carry forward. On sale, claimed depreciation is recaptured at up to 25%, and gains may owe capital-gains tax (a 1031 exchange can defer both). Figures are a year-1 estimate at your 24.0% rate — not tax advice; consult a CPA.
Condition & rehab AI · 12 photos
This 36-unit multi-family property in West Adams, Los Angeles, is in good condition with recent renovations. It offers a prime investment opportunity with strong rental potential.
Value-add opportunities
- Both Paint exterior and interior walls — Fresh paint enhances curb appeal and interior aesthetics
- Both Clean and maintain landscaping — Well-maintained landscaping improves curb appeal and adds value
- Both Install energy-efficient windows — Energy-efficient windows reduce energy costs and improve property value
- Both Upgrade HVAC systems — Upgraded HVAC systems improve comfort and energy efficiency
- Both Install smart home technology — Smart home technology enhances convenience and adds value
Renovation cost estimate screening
Value-add ROI direction
- Both Paint exterior and interior walls — Fresh paint enhances curb appeal and interior aesthetics ↑
- Both Clean and maintain landscaping — Well-maintained landscaping improves curb appeal and adds value ↑
- Both Install energy-efficient windows — Energy-efficient windows reduce energy costs and improve property value ↑
- Both Upgrade HVAC systems — Upgraded HVAC systems improve comfort and energy efficiency ↑
- Both Install smart home technology — Smart home technology enhances convenience and adds value ↑
ⓘ Cost ranges are severity-bucket heuristics (US national rule-of-thumb). Get contractor quotes + a written scope before underwriting a rehab budget.
Schools (NCES district)
- District
- Los Angeles Unified
- NCES district ID
- 0622710
- Math proficiency
- 29% ▼ -4.00%
- Reading proficiency
- 54% ▲ 10.00%
- Median HH income
- $50,403
- Composite
- 35.67/100
- National rank
- #4875
- State rank
- #223 of 517 in CA
Livability — Los Angeles
- Score
- 68/100
- State rank
- #273
- US rank
- #9237
Category grades
Schools grade is shown separately in the Schools card above.
Census & demographics
- Census place
- Los Angeles, CA
- County
- Los Angeles County · 9,444,647 people
- City population
- 3,838,149
- Metro
- Los Angeles-Long Beach-Anaheim, CA
- Population (ZIP)
- 46,457
- Household income
- $73,516
- Rent vs Own
- Severe rent burden
- 3450.0
Population outlook (Los Angeles County) Hauer SSP2
- Today (2025)
- 10,940,515 people
- By 2030
- 11,256,481 · +2.9%
- By 2040
- 11,729,929 · +7.2%
- By 2050
- 11,948,407 · +9.2%
- By 2075
- 11,818,114 · +8.0%
- By 2100
- 10,842,928 · -0.9%
Race, ethnicity, and origin ACS 2023
- Neighborhood character
- Diverse neighborhood (Simpson 0.64)
- Race & ethnicity
- Hispanic / Latino 52% Black 27% Two or more races 18% White 12% Asian 4%
- Hispanic origin (detail)
- Mexican 34%
- Common ancestry
- British 1% Scotch-Irish 1% Romanian 1%
- Foreign-born
- 30% · Canada, South Korea, China
- Languages at home
- 47% English-only · Spanish 47% French/Haitian/Cajun 1% Chinese 1%
Political lean MEDSL · Los Angeles
- 2024 margin
- Solid D (+32.9) · D 64.8% · R 31.9% · Other 3.3%
- 2008→2024 swing
- -7.4pp toward R · 2008: 40.4pp · 2024: 32.9pp
- All cycles
- 2024: D+32.9 2020: D+44.2 2016: D+48.0 2012: D+40.0 2008: D+40.4
Not yet ingested
- Civics
- —
Market trends
- HPI YoY
- ▼ -991.94%
- Current HPI
- 584.0673
- Rent YoY
- ▲ 1.12%
- Metro
- Los Angeles-Long Beach-Anaheim, CA
- State GDP YoY
- ▲ 3.21%
- F500 in state
- 116
Industry mix (Fortune 500 HQ in CA)
| Industry | F500 HQs | Revenue |
|---|---|---|
| Technology | 27 | $1,492B |
|
||
| Financial Services | 3 | $174B |
|
||
| Retail | 3 | $44B |
|
||
| Insurance | 3 | $26B |
|
||
| Media / Entertainment | 2 | $115B |
|
||
| Pharmaceuticals / Biotech | 2 | $62B |
|
||
Price history
+331003.7% since first listed15 events — show timeline
- 2026-02-27 Listed $4,950,000 CRMLS
- 2025-07-17 Listed — TheMLS
- 2024-05-10 Rental Removed $1,695 APPFOLIO
- 2024-05-04 Listed for Rent $1,695 APPFOLIO
- 2024-04-12 Rental Removed $1,595 APPFOLIO
- 2024-04-10 Listed for Rent $1,595 APPFOLIO
- 2024-04-10 Rental Removed $1,495 APPFOLIO
- 2024-04-05 Listed for Rent $1,495 APPFOLIO
- 2024-04-05 Rental Removed $1,595 APPFOLIO
- 2024-03-31 Listed for Rent $1,595 APPFOLIO
- 2024-03-31 Rental Removed $1,595 APPFOLIO
- 2024-03-13 Price Changed $1,595 APPFOLIO
- 2024-01-24 Rental Removed $1,462 APPFOLIO
- 2024-01-24 Listed for Rent $1,462 APPFOLIO
- 2023-12-20 Listed for Rent $1,495 APPFOLIO
Cash-flow waterfall
monthlySold comps — $/sqft
last 12 mo · ≤1 miLoading sold comps…