 Multi-family
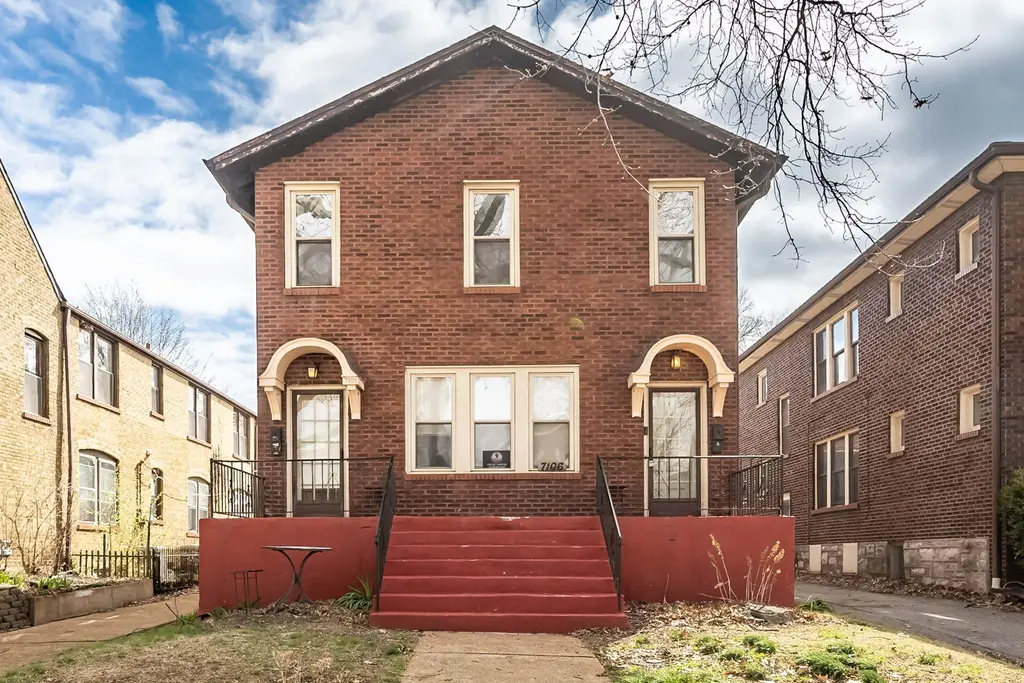
7106 Amherst Ave · University City, MO
Flood risk 1/10 · Minimal
- FEMA flood zone
- X (unshaded)
- Chance of flooding over 30 yrs
- 0.0%
- Est. flood insurance / yr
- $473 – $860
Fire risk 1/10 · Minimal
- Est. fire insurance / yr
- $1,054 – $1,958
Heat risk 5/10 · Moderate
- Hot days now (above 107°F)
- 7 days/yr
- Hot days in 30 yrs
- 21 days/yr
Wind risk 2/10 · Minimal
- Chance of severe wind over 30 yrs
- 1.0%
Air-quality risk 4/10 · Minor
- Unhealthy air days now
- 4 days/yr
- Unhealthy air days in 30 yrs
- 5 days/yr
Risk factors via First Street. Map © Google.
Why this score? — see what drove the B- grade
The composite is a weighted blend of 9 inputs, each scored 0–100. Each bar is that input's sub-score; the figure is the points it added to the 100-point composite (weight × sub-score).
- Cash flow +30.0/30.0
- 1% rule +10.0/10.0
- DSCR +10.0/10.0
- ARV discount +7.5/15.0
- Livability +3.7/5.0
- Rent growth +3.4/5.0
- Condition / age +2.5/5.0
- Schools +1.9/10.0
- Appreciation +0.0/10.0
$309,900
🖨 Deal sheet 📄 Offer letter ✓ Due diligence
Multi-family units
County records classify this as Multi-Family (5+ Unit). Listing-text estimate: 1 unit. estimate disagrees with records
5+ unit building — per-unit beds/baths from public records are typically unavailable; the breakdown below (if shown) is an estimate from the listing text.
Listing remarks
Discover massive scale and untapped potential in the heart of University Park. This all-brick duplex boasts over 2,100 sq. ft. of living space, with each "Executive 1-Bedroom" unit offering a sprawling 1,050+ sq. ft. floor plan—significantly larger than the area average. Perfectly suited for the modern professional, each unit features a formal living with a decorative fireplace & large dining room which would be ideal for a dedicated home office or library. While the building currently operates as a high-yield rental, the expansive footprint presents a premier opportunity for a single-family conversion into a 4-bedroom masterpiece on one of U-City's most desirable bloc
Key facts
- Large dining room
- Decorative fireplace
- Full basement
Tags
Neighborhood map
What this means for you Summary
Snapshot
- This is a 2-bed/2.0-bath multifamily listed at $310k.
Deal economics
- At list price, monthly cash flow is $2k ($24k/yr) — positive.
- The deal already cash-flows at list — no discount required.
- Meets the 1% rule at list price ($5k rent vs $310k).
- Recommended offer: $301k (3.0% below list) — sets the bar for market timing.
- Cap rate 13.9% vs local median 4.9% in University City — top-decile yield for the area; either an underpriced asset or a hidden risk that comps aren't pricing in. Stress-test before assuming the spread holds.
Location & tenants
- Location reads 73/100 on livability (#84 in MO) — a middle-class / working-renter tenant base. Strengths: employment A+, housing A+, cost of living B; Watch: amenities D-, commute D-, health & safety F.
- University City (suburban): math 15% / reading 26% proficiency, ranked #297 of 324 in MO (top 92%) — low school quality limits family demand, transient renter base, plan for 1-2y turnover; 67% free/reduced lunch — lower-income household profile, screen leases tightly.
- Zoned schools: Flynn Park Elem. (math 32% / reading 47%, grade F, #537 of 1,115 statewide, top 53%, 324 students, 100% FRL); University City Sr. High (math 5% / reading 52%, grade F, #409 of 521 statewide, top 79%, 726 students, 100% FRL) — zoned schools average 100% FRL vs 67% district-wide (32 pts higher); higher-poverty schools than district average — tighter screening recommended.
- Zoned-school proficiency averages 34% at this address vs 20% district-wide (+14 pts) — the actual schools serving this property are materially stronger than the University City average implies; a family-tenant draw the district grade alone would hide.
- Market conditions: Rents rising (+3.6%/yr); 162 active listings in the ZIP; 23 comparable units currently listed for rent nearby; rentals at typical pace (median 17d on market — plan ~3-4 weeks tenant-placement turnaround); solid renter incomes; 920 units permitted in St. Louis County in 2024 (250 in 5+ unit buildings).
- At $5,019/mo this rent would consume 70% of the median local household income ($86k/yr) (locally 893% of renters already pay >50% of income on rent) — very limited rent-growth headroom before tenants either downsize or default.
Forward outlook
- Local home prices are declining (-3.0%/yr); year-one equity from $2k of loan paydown is wiped out by about $9k of value loss. Plan a longer hold.
- At projected returns (-3.0% appreciation + 3.6% rent growth), your $87k cash investment doubles in ~5 years — after that, you're playing with house money.
Negotiation context
- It's been on market 40 days — a 3% lower offer ($301k) is reasonable based on typical stale-listing flexibility.
Risks & watch-outs
- Watch-outs: built in 1935 — expect roof / HVAC / electrical / plumbing capex.
- Climate carrying-cost: extreme-heat days projected 7→21/yr by 2055 (HVAC capex compounding) — expect insurance premiums to compound above CPI over the hold.
Questions for the listing agent
- It's been on market 40 days. Have you received any prior offers? Is the seller open to a 3% concession, seller financing, or rate buy-down credit?
- Built in 1935 — when were the roof, HVAC, electrical panel, plumbing, and water heater last replaced?
- What does the HOA fee cover, when was the last increase, and are there any pending special assessments or reserve-fund shortfalls?
- Is there a deadline driving the sale (1031 exchange, divorce, estate, relocation)? That informs how much negotiation room exists.
- Schools are B-rated — typically a magnet for longer-tenancy family renters. What's the average tenant stay here, and is there a school-zone premium baked into asking?
- What's the average days-on-market for RENTAL listings here right now (not sales)? A rising rental-DOM trend means longer vacancies and softer asking-rent achievability than the comps imply.
- What's the recent tenant-quality profile in this submarket — average credit score on applications, eviction rate, late-payment / NSF rate, and stable-employment percentage? A property-management company in the area should have these aggregated.
- How much new apartment / multifamily construction is in the pipeline within 1–3 miles? Heavy new supply (>2% of stock underway) typically softens rents 12–24 months out; light construction supports rent growth.
Investment metrics
- 1% rule
- 1.62% ✓
- Cap rate
- 13.91%
- Cash-on-cash
- 27.22%
- DSCR
- 2.21
- GRM
- 5.1
CMA / ARV
No comps found within radius.
Projected returns pro-forma
-3.0% appreciation · 3.61% rent growth · sell at horizon
- IRR
- 21.9%
- Equity multiple
- 1.90×
- Total profit
- $78,232
- Equity at exit
- $46,207
- IRR
- 30.3%
- Equity multiple
- 3.79×
- Total profit
- $242,370
- Equity at exit
- $26,794
Cash invested: $86,772 (down + closing). Projections, not guarantees.
Landlord ↔ Tenant lean methodology
- Overall (STATE)
- 81 Strongly Landlord-Friendly
- State Missouri
- 81 Strongly Landlord-Friendly · R+10
- County
- — inherits STATE
- City
- — inherits STATE
ZIP-level market 63130
- Rents YoY
- 3.6%
- Active inventory
- 162
- Price-to-rent
- 20.6×
Monthly cashflow live
- Estimated rent
- $5,019 high interval (Pro) →
- Mortgage (P&I)
- −$1,625
- Tax from tax record
- −$223 /mo · $2,681/yr
- Insurance
- −$129
- HOA
- −$19
- Vacancy / Maint / Mgmt
- −$1,054
- Net cashflow
- $1,968
Break-even live
4-unit breakdown (identical units grouped — click to expand)
| Units | Beds | Baths | Est. rent |
|---|---|---|---|
| 4× units | 1 | 1 | $5,020 |
| #1 | 1 | 1 | $1,255 |
| #2 | 1 | 1 | $1,255 |
| #3 | 1 | 1 | $1,255 |
| #4 | 1 | 1 | $1,255 |
| Total (4 units) | $5,019 | ||
UW: 25.0% down · 7.5% · 30yr · 1.5% tax · 5.0% vac · 8.0% maint · 8.0% mgmt
Financing live
Cash to close
- Down payment
- $77,475
- Closing costs
- $9,297
- Reserves months
- —
- Total cash needed
- —
Loan-product check · same deal, 3 products live
Conventional
25% down · 7.5% · 30yr
- Down + closing
- —
- Monthly P&I
- —
- Monthly cashflow
- —
- DSCR
- —
- Eligible?
- —
Personal DTI + credit; lowest rate.
DSCR
20% down · 8.5% · 30yr
- Down + closing
- —
- Monthly P&I
- —
- Monthly cashflow
- —
- DSCR
- —
- Eligible?
- —
No personal income docs; deal must DSCR.
Hard money
10% down · 12.0% · 12mo
- Down + closing
- —
- Monthly P&I
- —
- Monthly cashflow
- —
- DSCR
- —
- Eligible?
- —
Short-term bridge; refi at stabilization.
Rent comps 23 comps
| Address | Beds | Baths | Sqft | Rent | $/sqft | DOM | Units | Dist |
|---|---|---|---|---|---|---|---|---|
| 7104 Tulane Ave Saint Louis, MO | 2.0 | 1.0 | 1400 | $1,745 | $1.25 | 43d | 1 | 0.04mi |
| 7141 Dartmouth Ave University City, MO | 2.0 | 1.0 | 2520 | $1,395 | $0.55 | 43d | 1 | 0.14mi |
| 7002 Tulane Ave Unit 2FL Saint Louis, MO | 2.0 | 2.0 | 1700 | $1,995 | $1.17 | 20d | 1 | 0.15mi |
| 7260 Dartmouth Ave Unit 1-West University City, MO | 3.0 | 2.0 | 1650 | $1,795 | $1.09 | 43d | 1 | 0.30mi |
| 7227 Balson Ave Saint Louis, MO | 3.0 | 2.0 | 1682 | $1,650 | $0.98 | 7d | 1 | 0.31mi |
| 7261 Delmar Blvd University City, MO | 3.0 | 1.0 | 1416 | $1,950 | $1.38 | 1d | 1 | 0.32mi |
| 7205 Dorset Ave Saint Louis, MO | 3.0 | 3.0 | 2337 | $2,650 | $1.13 | 43d | 1 | 0.33mi |
| 7333 Amherst Ave Unit 1W University City, MO | 3.0 | 1.0 | 1600 | $2,350 | $1.47 | 43d | 1 | 0.38mi |
| 7330 Ahern Ave Saint Louis, MO | 3.0 | 1.5 | 1872 | $2,450 | $1.31 | 43d | 1 | 0.60mi |
| 7045 Plymouth Ave Saint Louis, MO | 3.0 | 2.0 | 1532 | $1,745 | $1.14 | 11d | 1 | 0.63mi |
| 7250 Pershing Ave Unit 1 University City, MO | 3.0 | 2.5 | 2016 | $3,700 | $1.84 | 23d | 1 | 0.64mi |
| 7256 Pershing Ave Unit A University City, MO | 3.0 | 2.0 | 2178 | $3,795 | $1.74 | 17d | 1 | 0.64mi |
| 7379 Pershing Ave Unit 1E Saint Louis, MO | 3.0 | 2.0 | 1700 | $2,295 | $1.35 | 1d | 1 | 0.69mi |
| 716 Westgate Ave Unit 3 University City, MO | 3.0 | 2.0 | 1500 | $2,995 | $2.00 | 43d | 1 | 0.84mi |
| 7309 Forsyth Blvd Saint Louis, MO | 2.0 | 1.0 | 1400 | $2,000 | $1.43 | 1d | 1 | 0.92mi |
| 7331 Forsyth Blvd Clayton, MO | 3.0 | 2.0 | 1496 | $2,995 | $2.00 | 1d | 1 | 0.94mi |
| 1108 N Hanley Rd St. Louis, MO | 3.0 | 2.0 | 1800 | $1,795 | $1.00 | 12d | 1 | 0.94mi |
| 6274 Cates Ave Saint Louis, MO | 3.0 | 2.0 | 1400 | $2,295 | $1.64 | 43d | 1 | 0.97mi |
| 543 N Central Ave Saint Louis, MO | 2.0 | 1.5 | 1568 | $3,295 | $2.10 | 10d | 1 | 0.97mi |
| 1019 N Skinker Pkwy St. Louis, MO | 1.0–3.0 | 1.0–3.0 | 1137 | $2,045 | $1.80 | 1d | 9 | 1.28mi |
| 8025 Maryland Ave Saint Louis, MO | 2.0 | 2.0 | 1518 | $4,795 | $3.16 | 1d | 1 | 1.31mi |
| 6124 Waterman Blvd Unit 6124 St. Louis, MO | 2.0 | 2.0 | 1500 | $2,250 | $1.50 | 14d | 1 | 1.36mi |
| 6017 Kingsbury Ave Unit 1F St. Louis, MO | 3.0 | 1.0 | 1600 | $2,700 | $1.69 | 17d | 1 | 1.44mi |
HOA detail
- Monthly dues
- $19 · $228/yr
Listing history 2 events
-
2026-06-05remarks 679-char remark
-
2026-06-05$309,900 Pending 40 DOM
ⓘ Source: listings_history table (triggers on properties + properties_extension) + one-shot
backfill from property_details.listing_events for pre-trigger history.
Tax reassessment forecast MO · Resets to sale price
- Current annual tax
- $2,681 · $223/mo
- Projected year-2 tax
- $3,006 · $251/mo
- Expected delta
- +$325/yr (+$27/mo · 12.1%)
ⓘ Screening estimate from a state-policy table — verify with the county assessor before closing.
Climate risk First Street
- Flood 1/10 Low FEMA zone X (unshaded) · 0% chance over 30 yrs
- Wildfire 1/10 Low
- Heat 5/10 Major 7 d/yr ≥107°F today · 21 d/yr by 30 yrs out
- Wind 2/10 Low 100% chance of damaging wind over 30 yrs
- Air quality 4/10 Moderate 4 unhealthy d/yr today · 5 by 30 yrs out
Nearby sold comps map
Loading sold comps map…
Walkable amenities ~0.75 mi
Loading nearby amenities…
Taxation est. · year 1
- Rental income
- $60,228
- − Mortgage interest
- −$17,359
- − Property taxes
- −$2,681
- − Insurance
- −$1,550
- − Repairs & maintenance
- −$4,818
- − Management
- −$4,818
- − HOA
- −$228
- − Depreciation
- −$9,015
- Taxable income
- $19,759
- Est. tax owed @ 24.0%
- −$4,742
- After-tax cash flow
- $18,878/yr
For passive investors: Depreciation is non-cash, so a rental often shows a tax loss while cash-flowing — sheltering income. Rental losses are passive: they offset passive income freely, and up to $25,000/yr can offset ordinary (W-2) income if you actively participate and your MAGI is under $100k (phasing out to $0 by $150k); unused losses carry forward. On sale, claimed depreciation is recaptured at up to 25%, and gains may owe capital-gains tax (a 1031 exchange can defer both). Figures are a year-1 estimate at your 24.0% rate — not tax advice; consult a CPA.
Schools (NCES district)
- District
- University City
- NCES district ID
- 2930660
- Math proficiency
- 15% ▼ -10.00%
- Reading proficiency
- 26% ▼ -7.00%
- Median HH income
- $52,927
- Composite
- 18.57/100
- National rank
- #8910
- State rank
- #297 of 324 in MO
Livability — University City
- Score
- 73/100
- State rank
- #84
- US rank
- #5618
Category grades
Schools grade is shown separately in the Schools card above.
Census & demographics
- Census place
- University City, MO
- County
- Saint Louis County · 888,823 people
- City population
- 28,910
- Metro
- St. Louis, MO-IL
- Population (ZIP)
- 28,910
- Household income
- $85,823
- Rent vs Own
- Severe rent burden
- 893.0
Population outlook (St. Louis County) Hauer SSP2
- Today (2025)
- 1,025,227 people
- By 2030
- 1,028,023 · +0.3%
- By 2040
- 1,020,940 · -0.4%
- By 2050
- 1,007,280 · -1.8%
- By 2075
- 987,277 · -3.7%
- By 2100
- 921,984 · -10.1%
Race, ethnicity, and origin ACS 2023
- Neighborhood character
- Diverse neighborhood (Simpson 0.61)
- Race & ethnicity
- White 54% Black 31% Asian 6% Two or more races 6% Hispanic / Latino 4%
- Common ancestry
- Italian 3% Romanian 3% Lithuanian 2%
- Foreign-born
- 11% · China, Canada, Vietnam
- Languages at home
- 89% English-only · Chinese 4% Spanish 2% French/Haitian/Cajun 1%
Political lean MEDSL · St. Louis
- 2024 margin
- Strong D (+23.4) · D 60.8% · R 37.4% · Other 1.7%
- 2008→2024 swing
- +3.5pp toward D · 2008: 19.9pp · 2024: 23.4pp
- All cycles
- 2024: D+23.4 2020: D+24.0 2016: D+16.2 2012: D+13.7 2008: D+19.9
Not yet ingested
- Civics
- —
Market trends
- HPI YoY
- ▼ -436.88%
- Current HPI
- 185.599
- Rent YoY
- ▲ 3.61%
- Metro
- St. Louis, MO-IL
- State GDP YoY
- ▲ 1.84%
- F500 in state
- 20
Industry mix (Fortune 500 HQ in MO)
| Industry | F500 HQs | Revenue |
|---|---|---|
| Healthcare | 1 | $163B |
|
||
| Insurance | 1 | $21B |
|
||
| Industrial Technology | 1 | $17B |
|
||
| Retail | 1 | $16B |
|
||
| Industrial Distribution | 1 | $10B |
|
||
| Utilities | 1 | $9B |
|
||
Price history
+38.3% since first listed4 events — show timeline
- 2026-06-03 Pending — MARIS as Distributed by MLS Grid
- 2026-03-19 Listed $309,900 MARIS as Distributed by MLS Grid
- 2019-07-28 Price Changed $224,000 Fizber.com
- 1985-01-01 Sold (Public Records) — Public Records
Property tax history
+0.6%/yrLatest (2022): $2,681 · +1.0% YoY. Source: county tax records.
Cash-flow waterfall
monthlySold comps — $/sqft
last 12 mo · ≤1 miLoading sold comps…