1205 Cypress St #108 · San Dimas, CA
Flood risk 1/10 · Minimal
- FEMA flood zone
- X (unshaded)
- Chance of flooding over 30 yrs
- 0.0%
- Est. flood insurance / yr
- $507 – $1,088
Fire risk 7/10 · Major
- Est. fire insurance / yr
- $659 – $1,223
Heat risk 7/10 · Major
- Hot days now (above 99°F)
- 7 days/yr
- Hot days in 30 yrs
- 20 days/yr
Wind risk 1/10 · Minimal
- Chance of severe wind over 30 yrs
- —
Air-quality risk 8/10 · Major
- Unhealthy air days now
- 17 days/yr
- Unhealthy air days in 30 yrs
- 21 days/yr
Risk factors via First Street. Map © Google.
Why this score? — see what drove the B+ grade
The composite is a weighted blend of 9 inputs, each scored 0–100. Each bar is that input's sub-score; the figure is the points it added to the 100-point composite (weight × sub-score).
- Cash flow +30.0/30.0
- ARV discount +15.0/15.0
- 1% rule +10.0/10.0
- DSCR +10.0/10.0
- Schools +5.9/10.0
- Livability +3.6/5.0
- Condition / age +2.8/5.0
- Rent growth +2.3/5.0
- Appreciation +0.0/10.0
$206,000
🖨 Deal sheet (PDF) 📄 Offer letter ✓ Due diligence
Listing remarks MLS
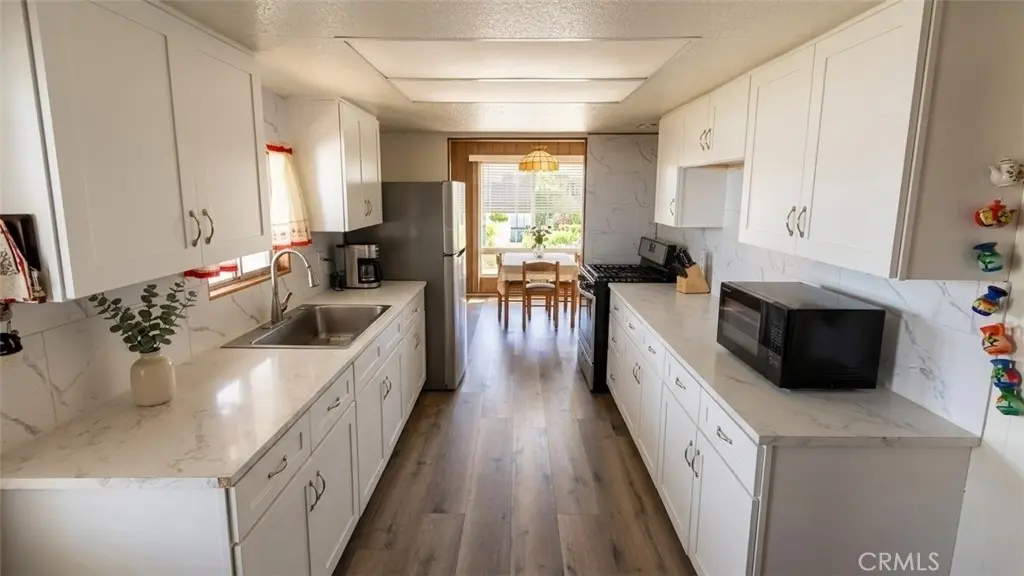
Welcome to this 3 bedrooms, 1 3/4 bath home. Property located in the highly desirable Lone Hill Manor Estates in San Dimas with walking distance to Lone Hill Middle School and San Dimas High School, and easy access to 57 and 210 freeways. This home offers a great floor plan of approximately 1392 sq. ft. , laminate flooring throughout, interior laundry room with access to the carport that accommodates 2 cars, and central a/c among other amenities. This community offers amenities such as club house, swimming pool & spa, and basketball courts. * Buyers must qualify for space lease. See attached Supplement.
Key facts
- Relaxing spa
- Inviting clubhouse
- 3 parking spots
Tags
Property features AI
Finance
- Other: Park name: Lone Hill Manor Mobile Estates
- Financial info: Current monthly land lease approximately $1,371
- HOA & community: Land lease community (manager approval required); Street lighting in community; Land lease includes electric, trash, water, and sewer
Exterior
- Parking: 3 covered carport spaces
- Utilities: Public sewer; District/public water
- Home design: Single-story mobile home; Entry level 1; Front-facing entry; Mobile home remains on site; Mobile dimensions approximately 24' x 56'
- Construction: Year built per public records
- Exterior features: Shingle roof; Back yard; 1 shed
Interior
- Kitchen: Remodeled kitchen
- Bathrooms: 2 full bathrooms
- Heating & cooling: Central heating (central furnace); Central cooling
- Interior features: Front entry; Community spa; Community pool; Remodeled kitchen; Shower in tub
- Laundry & utility: Laundry inside (in closet)
Neighborhood map
What this means for you Summary
Snapshot
- This is a 3-bed/2.0-bath manufactured listed at $206k. Condition is rated average.
Deal economics
- At list price, monthly cash flow is $1k ($14k/yr) — positive.
- The deal already cash-flows at list — no discount required.
- Meets the 1% rule at list price ($3k rent vs $206k).
- Cap rate 13.1% vs local median 2.6% in San Dimas — top-decile yield for the area; either an underpriced asset or a hidden risk that comps aren't pricing in. Stress-test before assuming the spread holds.
Location & tenants
- Location reads 72/100 on livability (#192 in CA) — a middle-class / working-renter tenant base. Strengths: employment A+, commute A; Watch: cost of living F, health & safety F.
- Bonita Unified (suburban): math 59% / reading 70% proficiency, ranked #151 of 1,400 in CA (top 11%) — acceptable for families but not a draw, mixed tenant base, ~2y average lease.
- Zoned schools: Lone Hill Middle (912 students, 40% FRL); San Dimas High (math 70% / reading 90%, grade A, #41 of 1,170 statewide, top 4%, 1,251 students, 34% FRL).
- Zoned-school proficiency averages 80% at this address vs 64% district-wide (+15 pts) — the actual schools serving this property are materially stronger than the Bonita Unified average implies; a family-tenant draw the district grade alone would hide.
- Market conditions: Rents soft (-1.0%/yr); 85 active listings in the ZIP; 25 comparable units currently listed for rent nearby; rentals at typical pace (median 25d on market — plan ~3-4 weeks tenant-placement turnaround); 44% of comp listings sitting > 30 days — soft ceiling on asking rent; solid renter incomes; 19,697 units permitted in Los Angeles County in 2024 (9,426 in 5+ unit buildings).
- This rent runs 37% of the median local income ($105k/yr) — at the standard rent-burdened threshold; future hikes will face affordability resistance.
Forward outlook
- Local home prices are declining (-3.0%/yr); year-one equity from $1k of loan paydown is wiped out by about $6k of value loss. Plan a longer hold.
- Los Angeles County population projected at +9% by 2050 — modest demand growth; plan on rents tracking national, not racing it.
- At projected returns (-3.0% appreciation + 0.0% rent growth), your $58k cash investment doubles in ~6 years — after that, you're playing with house money.
Negotiation context
- Only 12 days on market — expect competitive offers; lowballing is unlikely to land.
- 3 sale attempts since 2y ago with the ask held roughly flat each time — persistent listings suggest the price (not the market) is what's stuck; bring a comps-based counter.
- Current owner paid $130k; list at $206k implies a 58% gain — meaningful room to come down on a strong offer.
Risks & watch-outs
- Climate carrying-cost: major wildfire risk; extreme-heat days projected 7→20/yr by 2055 (HVAC capex compounding) — expect insurance premiums to compound above CPI over the hold.
Questions for the listing agent
- Built in 1970 — when were the roof, HVAC, electrical panel, plumbing, and water heater last replaced?
- Is there a deadline driving the sale (1031 exchange, divorce, estate, relocation)? That informs how much negotiation room exists.
- Schools are B-rated — typically a magnet for longer-tenancy family renters. What's the average tenant stay here, and is there a school-zone premium baked into asking?
- What's the average days-on-market for RENTAL listings here right now (not sales)? A rising rental-DOM trend means longer vacancies and softer asking-rent achievability than the comps imply.
- What's the recent tenant-quality profile in this submarket — average credit score on applications, eviction rate, late-payment / NSF rate, and stable-employment percentage? A property-management company in the area should have these aggregated.
- How much new for-sale + rental construction is in the pipeline within 1–3 miles? Heavy new supply typically softens prices + rents 12–24 months out; constrained supply supports both.
Investment metrics
- 1% rule
- 1.59% ✓
- Cap rate
- 13.10%
- Cash-on-cash
- 24.33%
- DSCR
- 2.08
- GRM
- 5.2
CMA / ARV
- ARV (on-the-fly)
- $249,168
- Comps found
- 12
Show comp detail 12 sales within ~0.75 mi
| Address | Dist | Beds/Ba | Sqft | Sold | Price | $/sf | Match |
|---|---|---|---|---|---|---|---|
| 1205 Cypress St #115 | 0.00mi | 2/2.0 (-1) | 1,344 (-3%) | 1mo | $215,000 | $160 | 89 |
| 1205 Cypress St #199 | 0.00mi | 3/2.0 | 1,344 (-3%) | 11mo | $290,000 | $216 | 85 |
| 1205 Cypress #67 | 0.09mi | 4/2.0 (+1) | 1,568 (+13%) | 3mo | $335,000 | $214 | 67 |
| 1245 W Cienega Ave #88 | 0.53mi | 3/2.0 | 1,375 (-1%) | 10mo | $350,000 | $255 | 65 |
| 1630 W Covina Blvd #65 | 0.63mi | 2/2.0 (-1) | 1,392 (0%) | 2mo | $215,000 | $154 | 64 |
| 1245 W Cienega Ave #44 | 0.48mi | 2/2.0 (-1) | 1,368 (-2%) | 10mo | $132,200 | $97 | 61 |
| 1245 W Cienega Ave #46 | 0.53mi | 3/2.0 | 1,512 (+9%) | 2mo | $270,000 | $179 | 60 |
| 1245 W Cienega Ave #123 | 0.53mi | 2/2.0 (-1) | 1,348 (-3%) | 9mo | $275,000 | $204 | 58 |
| 1635 W Covina #104 | 0.67mi | 4/2.0 (+1) | 1,404 (+1%) | 7mo | $250,000 | $178 | 56 |
| 1635 W Covina #53 | 0.67mi | 3/2.0 | 1,484 (+7%) | 3mo | $285,000 | $192 | 55 |
| 1630 W Covina Blvd #11 | 0.63mi | 3/2.0 | 1,248 (-10%) | 9mo | $180,000 | $144 | 46 |
| 1245 W Cienega Ave #183 | 0.53mi | 2/1.0 (-1) | 1,536 (+10%) | 4mo | $125,000 | $81 | 45 |
Match score weights: distance 35% · size 25% · config 20% · recency 20%. Top-matched comps best support the ARV.
Projected returns pro-forma
-3.0% appreciation · 0.0% rent growth · sell at horizon
- IRR
- 14.2%
- Equity multiple
- 1.55×
- Total profit
- $31,526
- Equity at exit
- $30,715
- IRR
- 20.6%
- Equity multiple
- 2.50×
- Total profit
- $86,381
- Equity at exit
- $17,811
Cash invested: $57,680 (down + closing). Projections, not guarantees.
Landlord ↔ Tenant lean methodology
- Overall (STATE)
- 18 Strongly Tenant-Friendly
- State California
- 18 Strongly Tenant-Friendly · D+13
- County
- — inherits STATE
- City
- — inherits STATE
ZIP-level market 91773
- Rents YoY
- -1.0%
- Active inventory
- 85
- Price-to-rent
- 5.2×
Monthly cashflow live
- Estimated rent
- $3,282 high interval (Pro) →
- Mortgage (P&I)
- −$1,080
- Tax est. 1.5%
- −$258 /mo · $3,090/yr
- Insurance
- −$86
- HOA
- −$0
- Vacancy / Maint / Mgmt
- −$689
- Net cashflow
- $1,169
Break-even live
Sensitivity live
| Price | -10% $1,312 | -5% $1,241 | +0% $1,169 | +5% $1,098 | +10% $1,027 |
|---|---|---|---|---|---|
| Rent | -10% $910 | -5% $1,040 | +0% $1,169 | +5% $1,299 | +10% $1,429 |
| Rate | -1.0pp $1,273 | -0.5pp $1,222 | base $1,169 | +0.5pp $1,116 | +1.0pp $1,062 |
UW: 25.0% down · 7.5% · 30yr · 1.5% tax · 5.0% vac · 8.0% maint · 8.0% mgmt
Financing live
Cash to close
- Down payment
- $51,500
- Closing costs
- $6,180
- Reserves months
- —
- Total cash needed
- —
Loan-product check · same deal, 3 products live
Conventional
25% down · 7.5% · 30yr
- Down + closing
- —
- Monthly P&I
- —
- Monthly cashflow
- —
- DSCR
- —
- Eligible?
- —
Personal DTI + credit; lowest rate.
DSCR
20% down · 8.5% · 30yr
- Down + closing
- —
- Monthly P&I
- —
- Monthly cashflow
- —
- DSCR
- —
- Eligible?
- —
No personal income docs; deal must DSCR.
Hard money
10% down · 12.0% · 12mo
- Down + closing
- —
- Monthly P&I
- —
- Monthly cashflow
- —
- DSCR
- —
- Eligible?
- —
Short-term bridge; refi at stabilization.
Rent comps 25 comps
| Address | Beds | Baths | Sqft | Rent | $/sqft | DOM | Units | Dist |
|---|---|---|---|---|---|---|---|---|
| 1471 Cypress St San Dimas, CA | 2.0 | 2.0 | 1127 | $900 | $0.80 | 8d | 1 | 0.37mi |
| 1430 W Badillo St San Dimas, CA | 3.0 | 1.5 | 1200 | $3,000 | $2.50 | 2d | 1 | 0.37mi |
| 1108 Eaton Rd San Dimas, CA | 4.0 | 2.0 | 1689 | $3,800 | $2.25 | 45d | 1 | 0.57mi |
| 220 S Valley Center Ave San Dimas, CA | 2.0 | 1.0 | 1000 | $2,495 | $2.50 | 44d | 1 | 0.68mi |
| 807 Avenida Loma Vis San Dimas, CA | 3.0 | 2.0 | 1740 | $4,500 | $2.59 | 11d | 1 | 0.80mi |
| 1189 Strawberry Ln Glendora, CA | 2.0 | 2.5 | 1292 | $2,900 | $2.24 | 44d | 1 | 0.92mi |
| 20983 E Covina Blvd Covina, CA | 2.0 | 2.0 | 962 | $2,500 | $2.60 | 25d | 1 | 0.98mi |
| 21042 E Arrow Hwy Covina, CA | 1.0–2.0 | 1.0–2.0 | 803 | $2,875 | $3.58 | 2d | 11 | 1.04mi |
| 1039 N Barston Ave Covina, CA | 4.0 | 2.0 | 1870 | $3,598 | $1.92 | 25d | 1 | 1.06mi |
| 530 W 3rd St Unit A San Dimas, CA | 2.0 | 2.5 | 1000 | $3,000 | $3.00 | 44d | 1 | 1.13mi |
| 1447 S Valley Center Ave Glendora, CA | 3.0 | 2.0 | 1345 | $3,500 | $2.60 | 2d | 1 | 1.16mi |
| 1746 S Sunflower Ave Unit 7 Glendora, CA | 2.0 | 2.0 | 1100 | $2,400 | $2.18 | 25d | 1 | 1.16mi |
| 1746 S Sunflower Ave Unit 10 Glendora, CA | 2.0 | 1.5 | 1100 | $2,400 | $2.18 | 44d | 1 | 1.16mi |
| 522 W 4th St San Dimas, CA | 3.0 | 1.0 | 1113 | $3,550 | $3.19 | 44d | 1 | 1.18mi |
| 644 Pearlanna Dr San Dimas, CA | 3.0 | 1.5 | 1350 | $3,500 | $2.59 | 2d | 1 | 1.23mi |
| 204 San Luis Rey Dr San Dimas, CA | 2.0 | 3.0 | 1287 | $3,165 | $2.46 | 5d | 1 | 1.24mi |
| 301 W 1st St San Dimas, CA | 2.0 | 1.0 | 880 | $2,150 | $2.44 | 25d | 1 | 1.30mi |
| 301 W 1st St Unit A San Dimas, CA | 3.0 | 2.0 | 1000 | $3,250 | $3.25 | 44d | 1 | 1.30mi |
| 801 Claraday St Glendora, CA | 1.0–2.0 | 1.0–2.0 | 900 | $2,325 | $2.58 | 22d | 6 | 1.31mi |
| 220 W 1st St San Dimas, CA | 3.0 | 1.0 | 1200 | $845 | $0.70 | 18d | 1 | 1.34mi |
| 432 W Caldwell Ct San Dimas, CA | 2.0 | 3.0 | 1502 | $3,100 | $2.06 | 44d | 1 | 1.34mi |
| 937 N Greenpark Ave Covina, CA | 4.0 | 2.0 | 1562 | $4,000 | $2.56 | 44d | 1 | 1.42mi |
| 235 W 4th St San Dimas, CA | 3.0 | 2.0 | 1200 | $3,499 | $2.92 | 2d | 1 | 1.46mi |
| 307 Beechwood Ln San Dimas, CA | 4.0 | 3.0 | 1760 | $3,950 | $2.24 | 44d | 1 | 1.47mi |
| 608 Claraday St Glendora, CA | 3.0 | 2.5 | 1600 | $3,500 | $2.19 | 44d | 1 | 1.50mi |
Listing history 10 events
-
2026-06-18days on market $206,000 Active 12 DOM
-
2026-06-17days on market $206,000 Active 11 DOM
-
2026-06-16days on market $206,000 Active 10 DOM
-
2026-06-15days on market $206,000 Active 9 DOM
-
2026-06-13days on market $206,000 Active 7 DOM
-
2026-06-13days on market $206,000 Active 6 DOM
-
2026-06-09days on market $206,000 Active 3 DOM
-
2026-06-08days on market $206,000 Active 2 DOM
-
2026-06-07remarks 699-char remark
-
2026-06-07$206,000 Active 1 DOM
ⓘ Source: listings_history table (triggers on properties + properties_extension) + one-shot
backfill from property_details.listing_events for pre-trigger history.
Climate risk First Street
- Flood 1/10 Low FEMA zone X (unshaded) · 0% chance over 30 yrs
- Wildfire 7/10 Severe
- Heat 7/10 Severe 7 d/yr ≥99°F today · 20 d/yr by 30 yrs out
- Wind 1/10 Low
- Air quality 8/10 Severe 17 unhealthy d/yr today · 21 by 30 yrs out
Nearby sold comps map
Loading sold comps map…
Walkable amenities ~0.75 mi
Loading nearby amenities…
Taxation est. · year 1
- Rental income
- $39,387
- − Mortgage interest
- −$11,539
- − Property taxes
- −$3,090
- − Insurance
- −$1,030
- − Repairs & maintenance
- −$3,151
- − Management
- −$3,151
- − Depreciation
- −$5,993
- Taxable income
- $11,433
- Est. tax owed @ 24.0%
- −$2,744
- After-tax cash flow
- $11,288/yr
For passive investors: Depreciation is non-cash, so a rental often shows a tax loss while cash-flowing — sheltering income. Rental losses are passive: they offset passive income freely, and up to $25,000/yr can offset ordinary (W-2) income if you actively participate and your MAGI is under $100k (phasing out to $0 by $150k); unused losses carry forward. On sale, claimed depreciation is recaptured at up to 25%, and gains may owe capital-gains tax (a 1031 exchange can defer both). Figures are a year-1 estimate at your 24.0% rate — not tax advice; consult a CPA.
Condition & rehab AI · 12 photos
This manufactured home requires moderate renovations to improve its condition and increase its resale and rental value.
Repairs flagged
- Minor kitchen backsplash — slight wear
- Minor bathroom fixtures — dated design
- Minor interior walls — dated wallpaper
- Minor exterior siding — slight discoloration
Value-add opportunities
- Resale paint interior walls — enhances curb appeal and interior aesthetics
- Rental replace dated fixtures in bathrooms — improves functionality and appeal for renters
Renovation cost estimate screening
| Repair item | Severity | Est. cost |
|---|---|---|
| kitchen backsplash · slight wear | Minor | $500–3,000 |
| bathroom fixtures · dated design | Minor | $500–3,000 |
| interior walls · dated wallpaper | Minor | $500–3,000 |
| exterior siding · slight discoloration | Minor | $500–3,000 |
| Total estimated repair cost · 4 items | $2,000–12,000 |
Value-add ROI direction
- Resale paint interior walls — enhances curb appeal and interior aesthetics ↑
- Rental replace dated fixtures in bathrooms — improves functionality and appeal for renters ↑
ⓘ Cost ranges are severity-bucket heuristics (US national rule-of-thumb). Get contractor quotes + a written scope before underwriting a rehab budget.
Schools (NCES district)
- District
- Bonita Unified
- NCES district ID
- 0605610
- Math proficiency
- 59% ▲ 3.00%
- Reading proficiency
- 70% ▬ 0.00%
- Median HH income
- $76,196
- Composite
- 58.71/100
- National rank
- #2001
- State rank
- #151 of 1400 in CA
Livability — San Dimas
- Score
- 72/100
- State rank
- #192
- US rank
- #6164
Category grades
Schools grade is shown separately in the Schools card above.
Census & demographics
- Census place
- San Dimas, CA
- County
- Los Angeles County · 9,444,647 people
- City population
- 33,598
- Metro
- Los Angeles-Long Beach-Anaheim, CA
- Population (ZIP)
- 33,598
- Household income
- $105,338
- Rent vs Own
- Severe rent burden
- 1238.0
Population outlook (Los Angeles County) Hauer SSP2
- Today (2025)
- 10,940,515 people
- By 2030
- 11,256,481 · +2.9%
- By 2040
- 11,729,929 · +7.2%
- By 2050
- 11,948,407 · +9.2%
- By 2075
- 11,818,114 · +8.0%
- By 2100
- 10,842,928 · -0.9%
Race, ethnicity, and origin ACS 2023
- Neighborhood character
- Diverse neighborhood (Simpson 0.69)
- Race & ethnicity
- White 38% Hispanic / Latino 37% Two or more races 19% Asian 18% Black 3% Native American 1%
- Hispanic origin (detail)
- Mexican 27% Puerto Rican 1%
- Common ancestry
- Romanian 2% Lithuanian 2% Slovak 2%
- Foreign-born
- 22% · Canada, China, Vietnam
- Languages at home
- 64% English-only · Spanish 18% Chinese 8% Tagalog/Filipino 2%
Political lean MEDSL · Los Angeles
- 2024 margin
- Solid D (+32.9) · D 64.8% · R 31.9% · Other 3.3%
- 2008→2024 swing
- -7.4pp toward R · 2008: 40.4pp · 2024: 32.9pp
- All cycles
- 2024: D+32.9 2020: D+44.2 2016: D+48.0 2012: D+40.0 2008: D+40.4
Not yet ingested
- Civics
- —
Market trends
- HPI YoY
- ▼ -778.24%
- Current HPI
- 379.5269
- Rent YoY
- ▼ -0.97%
- Metro
- Los Angeles-Long Beach-Anaheim, CA
- State GDP YoY
- ▲ 3.21%
- F500 in state
- 116
Industry mix (Fortune 500 HQ in CA)
| Industry | F500 HQs | Revenue |
|---|---|---|
| Technology | 27 | $1,492B |
|
||
| Financial Services | 3 | $174B |
|
||
| Retail | 3 | $44B |
|
||
| Insurance | 3 | $26B |
|
||
| Media / Entertainment | 2 | $115B |
|
||
| Pharmaceuticals / Biotech | 2 | $62B |
|
||
Price history
+28.7% since first listed6 events — show timeline
- 2026-06-06 Listed $206,000 CRMLS
- 2024-04-05 Sold (MLS) $130,000 CRMLS
- 2024-03-06 Contingent — CRMLS
- 2024-02-16 Relisted — CRMLS
- 2024-01-30 Contingent — CRMLS
- 2024-01-08 Listed $160,000 CRMLS
Property tax history
+8.1%/yrLatest (2025): $344 · +8.1% YoY. Source: county tax records.
Cash-flow waterfall
monthlySold comps — $/sqft
last 12 mo · ≤1 miLoading sold comps…