1770 Easy St · Helena, MT
Flood risk 1/10 · Minimal
- FEMA flood zone
- X (unshaded)
- Chance of flooding over 30 yrs
- 0.0%
- Est. flood insurance / yr
- $507 – $1,088
Fire risk 3/10 · Minor
- Est. fire insurance / yr
- $918 – $1,706
Heat risk 3/10 · Minor
- Hot days now (above 90°F)
- 7 days/yr
- Hot days in 30 yrs
- 16 days/yr
Wind risk 1/10 · Minimal
- Chance of severe wind over 30 yrs
- —
Air-quality risk 7/10 · Major
- Unhealthy air days now
- 9 days/yr
- Unhealthy air days in 30 yrs
- 20 days/yr
Risk factors via First Street. Map © Google.
Why this score? — see what drove the B grade
The composite is a weighted blend of 9 inputs, each scored 0–100. Each bar is that input's sub-score; the figure is the points it added to the 100-point composite (weight × sub-score).
- Cash flow +30.0/30.0
- 1% rule +10.0/10.0
- DSCR +10.0/10.0
- ARV discount +7.5/15.0
- Livability +4.0/5.0
- Schools +3.8/10.0
- Condition / age +3.8/5.0
- Rent growth +2.9/5.0
- Appreciation +0.0/10.0
$105,000
🖨 Deal sheet 📄 Offer letter ✓ Due diligence
Key facts
- Built 1979
- Listed 84 days
Property features AI
Finance
- Financial info: Annual tax approximately $304.10
- HOA & community: Land is leased
Exterior
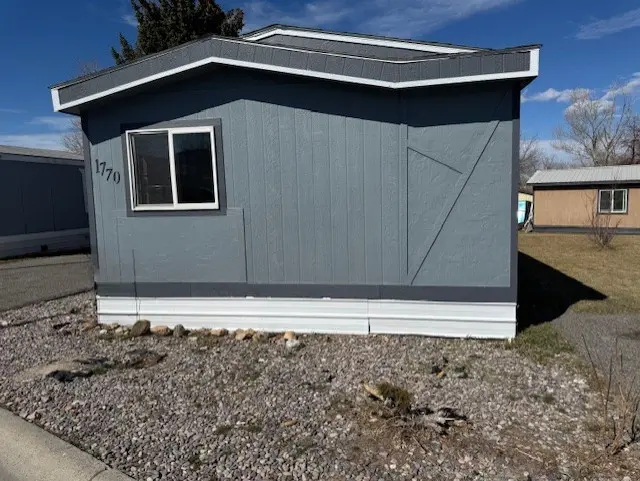
- Home design: Manufactured home (single wide); Residential property
- Construction: Other foundation
Interior
- Kitchen: Dishwasher; Range; Refrigerator
- Bathrooms: 1 full bathroom; 1 three-quarter bathroom
- Interior features: Dishwasher; Range; Refrigerator
Neighborhood map
What this means for you Summary
Snapshot
- This is a 3-bed/2.0-bath single-family listed at $105k. Condition is rated good.
Deal economics
- At list price, monthly cash flow is $703 ($8k/yr) — positive.
- The deal already cash-flows at list — no discount required.
- Meets the 1% rule at list price ($2k rent vs $105k).
- Recommended offer: $99k (6.0% below list) — sets the bar for market timing.
- Cap rate 14.3% vs local median 2.6% in Helena — top-decile yield for the area; either an underpriced asset or a hidden risk that comps aren't pricing in. Stress-test before assuming the spread holds.
Location & tenants
- Location reads 81/100 on livability (#6 in MT, #1,389 nationally) — a professional / high-income tenant draw. Strengths: amenities A+, commute A+, housing A+; Watch: crime F.
- Helena H S (town): math 34% / reading 54% proficiency, ranked #42 of 116 in MT (top 36%) — families likely to look elsewhere, expect single-tenant / working-renter base with shorter leases.
- Market conditions: Rents rising (+1.5%/yr); 166 active listings in the ZIP; 1 comparable units currently listed for rent nearby; 456 units permitted in Lewis and Clark County in 2024 (207 in 5+ unit buildings).
- This rent runs 30% of the median local income ($72k/yr) — at the standard rent-burdened threshold; future hikes will face affordability resistance.
Forward outlook
- Local home prices are declining (-3.0%/yr); year-one equity from $726 of loan paydown is wiped out by about $3k of value loss. Plan a longer hold.
- Lewis and Clark County population projected at +14% by 2050 — modest demand growth; plan on rents tracking national, not racing it.
- At projected returns (-3.0% appreciation + 1.5% rent growth), your $29k cash investment doubles in ~5 years — after that, you're playing with house money.
Negotiation context
- It's been on market 85 days — a 6% lower offer ($99k) is reasonable based on typical stale-listing flexibility.
Questions for the listing agent
- It's been on market 85 days. Have you received any prior offers? Is the seller open to a 6% concession, seller financing, or rate buy-down credit?
- Built in 1979 — when were the roof, HVAC, electrical panel, plumbing, and water heater last replaced?
- Why hasn't it sold? Are there any deal-killer items the seller is aware of (foundation, flood, title, zoning, code violations)?
- Is there a deadline driving the sale (1031 exchange, divorce, estate, relocation)? That informs how much negotiation room exists.
- Schools are B-rated — typically a magnet for longer-tenancy family renters. What's the average tenant stay here, and is there a school-zone premium baked into asking?
- Crime grade is F in this area — have there been break-ins, vandalism, or insurance claims at this property in the last 3 years? What carrier currently insures it and at what premium?
- What's the average days-on-market for RENTAL listings here right now (not sales)? A rising rental-DOM trend means longer vacancies and softer asking-rent achievability than the comps imply.
- What's the recent tenant-quality profile in this submarket — average credit score on applications, eviction rate, late-payment / NSF rate, and stable-employment percentage? A property-management company in the area should have these aggregated.
- How much new for-sale + rental construction is in the pipeline within 1–3 miles? Heavy new supply typically softens prices + rents 12–24 months out; constrained supply supports both.
Investment metrics
- 1% rule
- 1.72% ✓
- Cap rate
- 14.33%
- Cash-on-cash
- 28.71%
- DSCR
- 2.28
- GRM
- 4.8
CMA / ARV
- ARV (on-the-fly)
- $328,032
- Comps found
- 9
Show comp detail 9 sales within ~0.75 mi
| Address | Dist | Beds/Ba | Sqft | Sold | Price | $/sf | Match |
|---|---|---|---|---|---|---|---|
| 1646 Walnut St | 0.11mi | 3/1.0 | 1,288 (+7%) | 6mo | $350,000 | $272 | 75 |
| 1630 Phoenix Ave | 0.13mi | 2/1.0 (-1) | 1,218 (+1%) | 15mo | $284,500 | $234 | 70 |
| 1631 E Lyndale Ave | 0.35mi | 2/1.0 (-1) | 1,216 (+1%) | 4mo | $325,000 | $267 | 70 |
| 1534 Lewis St | 0.35mi | 2/1.5 (-1) | 1,232 (+2%) | 4mo | $365,000 | $296 | 70 |
| 1655 Chestnut St | 0.10mi | 2/2.0 (-1) | 1,132 (-6%) | 22mo | $349,000 | $308 | 62 |
| 1919 Boulder Ave | 0.41mi | 2/1.0 (-1) | 1,233 (+2%) | 15mo | $299,999 | $243 | 56 |
| 1803 Townsend Ave | 0.53mi | 3/1.0 | 1,080 (-10%) | 2mo | $389,900 | $361 | 52 |
| 1601 Livingston Ave | 0.50mi | 2/1.0 (-1) | 1,252 (+4%) | 13mo | $385,000 | $308 | 50 |
| 1409 E Lyndale Ave | 0.48mi | 4/1.5 (+1) | 1,375 (+14%) | 20mo | $365,000 | $265 | 31 |
Match score weights: distance 35% · size 25% · config 20% · recency 20%. Top-matched comps best support the ARV.
Projected returns pro-forma
-3.0% appreciation · 1.54% rent growth · sell at horizon
- IRR
- 21.4%
- Equity multiple
- 1.86×
- Total profit
- $25,196
- Equity at exit
- $15,656
- IRR
- 28.5%
- Equity multiple
- 3.36×
- Total profit
- $69,305
- Equity at exit
- $9,078
Cash invested: $29,400 (down + closing). Projections, not guarantees.
Landlord ↔ Tenant lean methodology
- Overall (STATE)
- 82 Strongly Landlord-Friendly
- State Montana
- 82 Strongly Landlord-Friendly · R+11
- County
- — inherits STATE
- City
- — inherits STATE
ZIP-level market 59601
- Rents YoY
- 1.5%
- Active inventory
- 166
- Price-to-rent
- 4.8×
Monthly cashflow live
- Estimated rent
- $1,809 medium interval (Pro) →
- Mortgage (P&I)
- −$551
- Tax est. 1.5%
- −$131 /mo · $1,575/yr
- Insurance
- −$44
- HOA
- −$0
- Vacancy / Maint / Mgmt
- −$380
- Net cashflow
- $703
Break-even live
UW: 25.0% down · 7.5% · 30yr · 1.5% tax · 5.0% vac · 8.0% maint · 8.0% mgmt
Financing live
Cash to close
- Down payment
- $26,250
- Closing costs
- $3,150
- Reserves months
- —
- Total cash needed
- —
Loan-product check · same deal, 3 products live
Conventional
25% down · 7.5% · 30yr
- Down + closing
- —
- Monthly P&I
- —
- Monthly cashflow
- —
- DSCR
- —
- Eligible?
- —
Personal DTI + credit; lowest rate.
DSCR
20% down · 8.5% · 30yr
- Down + closing
- —
- Monthly P&I
- —
- Monthly cashflow
- —
- DSCR
- —
- Eligible?
- —
No personal income docs; deal must DSCR.
Hard money
10% down · 12.0% · 12mo
- Down + closing
- —
- Monthly P&I
- —
- Monthly cashflow
- —
- DSCR
- —
- Eligible?
- —
Short-term bridge; refi at stabilization.
Rent comps 1 comps
| Address | Beds | Baths | Sqft | Rent | $/sqft | DOM | Units | Dist |
|---|---|---|---|---|---|---|---|---|
| 2115 Missoula Ave Helena, MT | 1.0–3.0 | 1.0 | 801 | $1,400 | $1.75 | 43d | 11 | 0.76mi |
Listing history 18 events
-
2026-06-19days on market $105,000 Active 85 DOM
-
2026-06-18days on market $105,000 Active 84 DOM
-
2026-06-17days on market $105,000 Active 83 DOM
-
2026-06-16days on market $105,000 Active 82 DOM
-
2026-06-15days on market $105,000 Active 81 DOM
-
2026-06-14days on market $105,000 Active 79 DOM
-
2026-06-13days on market $105,000 Active 78 DOM
-
2026-06-10days on market $105,000 Active 76 DOM
-
2026-06-09days on market $105,000 Active 75 DOM
-
2026-06-08days on market $105,000 Active 74 DOM
-
2026-06-07days on market $105,000 Active 73 DOM
-
2026-06-05days on market $105,000 Active 70 DOM
-
2026-06-03days on market $105,000 Active 69 DOM
-
2026-06-02days on market $105,000 Active 68 DOM
-
2026-06-01days on market $105,000 Active 67 DOM
-
2026-05-31days on market $105,000 Active 66 DOM
-
2026-05-30days on market $105,000 Active 65 DOM
-
2026-03-26$105,000 Active
ⓘ Source: listings_history table (triggers on properties + properties_extension) + one-shot
backfill from property_details.listing_events for pre-trigger history.
Climate risk First Street
- Flood 1/10 Low FEMA zone X (unshaded) · 0% chance over 30 yrs
- Wildfire 3/10 Moderate
- Heat 3/10 Moderate 7 d/yr ≥90°F today · 16 d/yr by 30 yrs out
- Wind 1/10 Low
- Air quality 7/10 Severe 9 unhealthy d/yr today · 20 by 30 yrs out
Nearby sold comps map
Loading sold comps map…
Walkable amenities ~0.75 mi
Loading nearby amenities…
Taxation est. · year 1
- Rental income
- $21,708
- − Mortgage interest
- −$5,882
- − Property taxes
- −$1,575
- − Insurance
- −$525
- − Repairs & maintenance
- −$1,737
- − Management
- −$1,737
- − Depreciation
- −$3,055
- Taxable income
- $7,198
- Est. tax owed @ 24.0%
- −$1,728
- After-tax cash flow
- $6,714/yr
For passive investors: Depreciation is non-cash, so a rental often shows a tax loss while cash-flowing — sheltering income. Rental losses are passive: they offset passive income freely, and up to $25,000/yr can offset ordinary (W-2) income if you actively participate and your MAGI is under $100k (phasing out to $0 by $150k); unused losses carry forward. On sale, claimed depreciation is recaptured at up to 25%, and gains may owe capital-gains tax (a 1031 exchange can defer both). Figures are a year-1 estimate at your 24.0% rate — not tax advice; consult a CPA.
Condition & rehab AI · 13 photos
This mobile home is in good condition with minor repairs needed. Fresh paint and updating worn areas would significantly enhance its resale and rental value.
Repairs flagged
- Minor Stairs — Worn steps and railings
- Minor Windows — Some windows have peeling paint
Value-add opportunities
- Resale Paint exterior — Fresh paint enhances curb appeal
- Rental Replace worn stairs and railings — Maintaining safety and appearance
Renovation cost estimate screening
| Repair item | Severity | Est. cost |
|---|---|---|
| Stairs · Worn steps and railings | Minor | $500–3,000 |
| Windows · Some windows have peeling paint | Minor | $500–3,000 |
| Total estimated repair cost · 2 items | $1,000–6,000 |
Value-add ROI direction
- Resale Paint exterior — Fresh paint enhances curb appeal ↑
- Rental Replace worn stairs and railings — Maintaining safety and appearance ↑
ⓘ Cost ranges are severity-bucket heuristics (US national rule-of-thumb). Get contractor quotes + a written scope before underwriting a rehab budget.
Schools (NCES district)
- District
- Helena H S
- NCES district ID
- 3013830
- Math proficiency
- 34% ▼ -6.00%
- Reading proficiency
- 54% ▼ -3.00%
- Median HH income
- $55,565
- Composite
- 38.26/100
- National rank
- #4238
- State rank
- #42 of 116 in MT
Livability — Helena
- Score
- 81/100
- State rank
- #6
- US rank
- #1389
Category grades
Schools grade is shown separately in the Schools card above.
Census & demographics
- Census place
- Helena, MT
- County
- Lewis and Clark County · 62,482 people
- City population
- 62,482
- Metro
- Helena, MT
- Population (ZIP)
- 31,728
- Household income
- $72,290
- Rent vs Own
- Severe rent burden
- 1080.0
Population outlook (Lewis and Clark County) Hauer SSP2
- Today (2025)
- 72,720 people
- By 2030
- 75,403 · +3.7%
- By 2040
- 79,496 · +9.3%
- By 2050
- 82,741 · +13.8%
- By 2075
- 90,296 · +24.2%
- By 2100
- 93,425 · +28.5%
Race, ethnicity, and origin ACS 2023
- Neighborhood character
- Predominantly White (88%)
- Race & ethnicity
- White 88% Two or more races 5% Hispanic / Latino 4% Native American 1%
- Common ancestry
- Portuguese 7% Lithuanian 4% Slovak 4%
- Foreign-born
- 1% · Canada, South Korea
- Languages at home
- 97% English-only · Spanish 1% Russian/Polish/Slavic 1%
Political lean MEDSL · Lewis and Clark
- 2024 margin
- Lean R (+5.7) · D 45.4% · R 51.1% · Other 3.5%
- 2008→2024 swing
- -12.2pp toward R · 2008: 6.5pp · 2024: -5.7pp
- All cycles
- 2024: R+5.7 2020: R+3.9 2016: R+6.9 2012: R+3.6 2008: D+6.5
Not yet ingested
- Civics
- —
Market trends
- HPI YoY
- ▼ -417.31%
- Current HPI
- 231.6233
- Rent YoY
- ▲ 1.54%
- Metro
- Helena, MT
- State GDP YoY
- ▲ 3.41%
- F500 in state
- 2
Industry mix (Fortune 500 HQ in MT)
| Industry | F500 HQs | Revenue |
|---|---|---|
| Technology / Analytics | 1 | $2B |
|
||
Price history
1 event — show timeline
- 2026-03-26 Listed $105,000 MRMLS
Cash-flow waterfall
monthlySold comps — $/sqft
last 12 mo · ≤1 miLoading sold comps…