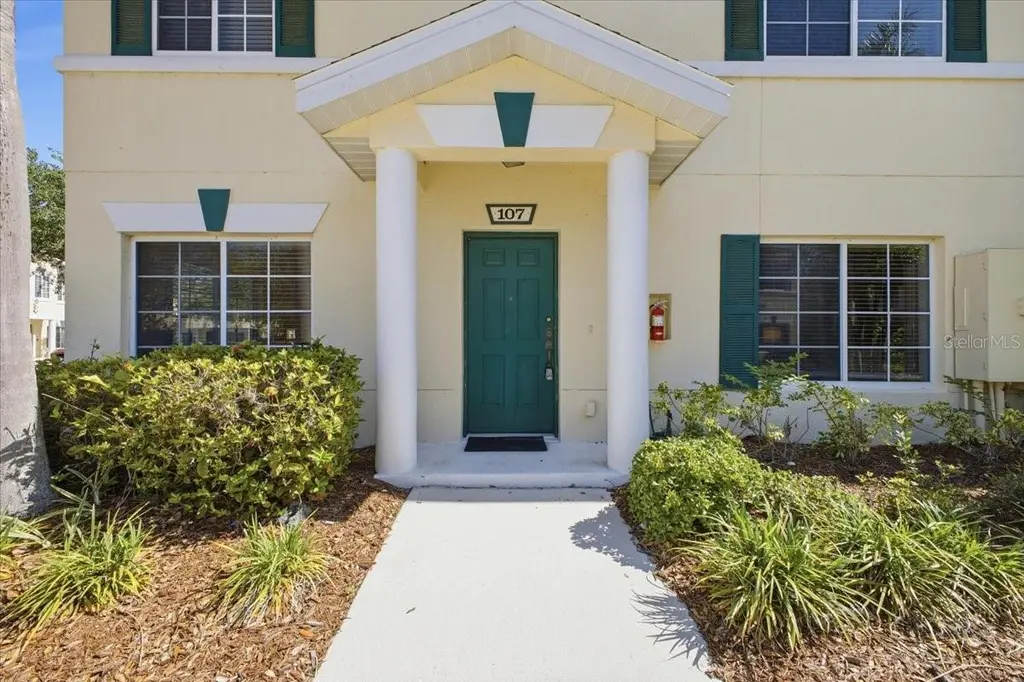
233 Cape Harbour Loop #107 · Bradenton, FL
Flood risk 6/10 · Moderate
- FEMA flood zone
- X (shaded)
- Chance of flooding over 30 yrs
- 0.56%
- Est. flood insurance / yr
- $507 – $1,088
Fire risk 1/10 · Minimal
- Est. fire insurance / yr
- $947 – $1,759
Heat risk 10/10 · Severe
- Hot days now (above 107°F)
- 7 days/yr
- Hot days in 30 yrs
- 31 days/yr
Wind risk 10/10 · Severe
- Chance of severe wind over 30 yrs
- 99.0%
Air-quality risk 3/10 · Minor
- Unhealthy air days now
- 3 days/yr
- Unhealthy air days in 30 yrs
- 3 days/yr
Risk factors via First Street. Map © Google.
Why this score? — see what drove the C- grade
The composite is a weighted blend of 9 inputs, each scored 0–100. Each bar is that input's sub-score; the figure is the points it added to the 100-point composite (weight × sub-score).
- Cash flow +15.2/30.0
- ARV discount +7.5/15.0
- 1% rule +6.9/10.0
- DSCR +4.7/10.0
- Schools +4.4/10.0
- Appreciation +4.1/10.0
- Livability +4.0/5.0
- Condition / age +2.5/5.0
- Rent growth +1.6/5.0
$185,000
🖨 Deal sheet 📄 Offer letter ✓ Due diligence
Listing remarks
Under contract-accepting backup offers. This charming move-in ready townhome offers a perfect blend of comfort and convenience for any lifestyle. Located in the sought after Lighthouse Cove at Heritage Harbour, the thoughtfully designed floor plan features 3 spacious bedrooms and 2 and a half bathrooms, providing ample space for relaxation and daily living. Residents will appreciate the condition of the interior, which allows for a seamless transition into a new home without the need for immediate updates. The spacious primary suite features a large closet and private en-suite bathroom. Lighthouse Cove offers residents a well-maintained community with desirable amenities such as a pool, wal
Key facts
- Move-in ready
- Desirable amenities
- Pool
Tags
Property features AI
Finance
- Other: Lease restrictions apply
- Financial info: Monthly condo fee equivalent noted (monthly amount listed as 352; quarterly condo fees listed as 1,056); Total annual fees listed
- HOA & community: Quarterly association fees (total quarterly condo/HOA fees noted); Association covers maintenance of grounds, pool, trash, and water; Community features include pool, playground, park, dog park, community mailbox, irrigation (reclaimed water) and sidewalks; Association management: Jessica Friday and PMI Capstone
Exterior
- Parking: Assigned parking (park in spot 107)
- Utilities: Public water; Public sewer; Cable available; High-speed internet available; Electricity connected
- Home design: Townhouse; Residential property; East-facing; Two stories; Entry on multiple levels
- Construction: Stucco exterior; Shingle roof; Slab foundation; Built with standard residential construction
- Exterior features: Sidewalk
Interior
- Kitchen: Dishwasher; Microwave; Range; Refrigerator; Solid surface counters
- Bedrooms: 3 bedrooms
- Flooring: Tile; Tile flooring throughout
- Bathrooms: 2 full bathrooms; 1 half bathroom
- Heating & cooling: Central heating (electric); Central air conditioning
- Interior features: Ceiling fans; Living room/dining room combo; Solid surface counters; Programmable thermostat; Walk-in closets; Window treatments
- Laundry & utility: Washer hookup inside; Dryer hookup (electric)
Neighborhood map
What this means for you Summary
Snapshot
- This is a 3-bed/2.5-bath condo listed at $185k.
Deal economics
- At list price, monthly cash flow is $65 ($781/yr) — positive.
- The deal already cash-flows at list — no discount required.
- Meets the 1% rule at list price ($2k rent vs $185k).
- Cap rate 6.7% vs local median 3.6% in Bradenton — top-decile yield for the area; either an underpriced asset or a hidden risk that comps aren't pricing in. Stress-test before assuming the spread holds.
Location & tenants
- Location reads 81/100 on livability (#101 in FL, #1,528 nationally) — a professional / high-income tenant draw. Strengths: commute A+, cost of living A+, housing A+; Watch: employment D+, crime D, amenities F.
- Manatee (suburban): math 54% / reading 50% proficiency, ranked #26 of 73 in FL (top 36%) — acceptable for families but not a draw, mixed tenant base, ~2y average lease.
- Market conditions: Rents falling (-3.4%/yr); 479 active listings in the ZIP; 33 comparable units currently listed for rent nearby; rentals at typical pace (median 24d on market — plan ~3-4 weeks tenant-placement turnaround); high-income renter base; 7,472 units permitted in Manatee County in 2024 (1,782 in 5+ unit buildings).
Forward outlook
- Local home prices are declining (-1.8%/yr); year-one equity from $1k of loan paydown is wiped out by about $3k of value loss. Plan a longer hold.
- Manatee County population projected at +43% by 2050 — long-run rental-demand tailwind backs the buy-and-hold thesis.
Negotiation context
- Only 4 days on market — expect competitive offers; lowballing is unlikely to land.
- 4 sale attempts since 16y ago with the ask held roughly flat each time — persistent listings suggest the price (not the market) is what's stuck; bring a comps-based counter.
- Current owner paid $65k; list at $185k implies a 185% gain — meaningful room to come down on a strong offer.
Risks & watch-outs
- Climate carrying-cost: major flood risk; severe wind risk, 99% chance of damaging wind over 30y; extreme-heat days projected 7→31/yr by 2055 (HVAC capex compounding) — expect insurance premiums to compound above CPI over the hold.
Questions for the listing agent
- What does the HOA fee cover, when was the last increase, and are there any pending special assessments or reserve-fund shortfalls?
- Any open or pending special assessments — roof, HVAC, plumbing, elevator, façade? What's the per-unit balance and payoff schedule, and is the seller paying it off at close or rolling it to the buyer?
- Is there a deadline driving the sale (1031 exchange, divorce, estate, relocation)? That informs how much negotiation room exists.
- Crime grade is D in this area — have there been break-ins, vandalism, or insurance claims at this property in the last 3 years? What carrier currently insures it and at what premium?
- What's the average days-on-market for RENTAL listings here right now (not sales)? A rising rental-DOM trend means longer vacancies and softer asking-rent achievability than the comps imply.
- What's the recent tenant-quality profile in this submarket — average credit score on applications, eviction rate, late-payment / NSF rate, and stable-employment percentage? A property-management company in the area should have these aggregated.
- How much new apartment / multifamily construction is in the pipeline within 1–3 miles? Heavy new supply (>2% of stock underway) typically softens rents 12–24 months out; light construction supports rent growth.
Investment metrics
- 1% rule
- 1.19% ✓
- Cap rate
- 6.72%
- Cash-on-cash
- 1.51%
- DSCR
- 1.07
- GRM
- 7.0
CMA / ARV
No comps found within radius.
Projected returns pro-forma
-1.82% appreciation · 0.0% rent growth · sell at horizon
- IRR
- -11.2%
- Equity multiple
- 0.56×
- Total profit
- $-22,716
- Equity at exit
- $37,486
- IRR
- -8.4%
- Equity multiple
- 0.42×
- Total profit
- $-29,937
- Equity at exit
- $33,531
Cash invested: $51,800 (down + closing). Projections, not guarantees.
Landlord ↔ Tenant lean methodology
- Overall (STATE)
- 87 Strongly Landlord-Friendly
- State Florida
- 87 Strongly Landlord-Friendly · R+3
- County
- — inherits STATE
- City
- — inherits STATE
ZIP-level market 34212
- Home prices YoY
- -0.7%
- Rents YoY
- -3.4%
- Active inventory
- 479
- Price-to-rent
- 7.0×
Monthly cashflow live
- Estimated rent
- $2,208 high interval (Pro) →
- Mortgage (P&I)
- −$970
- Tax from tax record
- −$257 /mo · $3,086/yr
- Insurance
- −$77
- HOA
- −$375
- Vacancy / Maint / Mgmt
- −$464
- Net cashflow
- $65
Break-even live
UW: 25.0% down · 7.5% · 30yr · 1.5% tax · 5.0% vac · 8.0% maint · 8.0% mgmt
Financing live
Cash to close
- Down payment
- $46,250
- Closing costs
- $5,550
- Reserves months
- —
- Total cash needed
- —
Loan-product check · same deal, 3 products live
Conventional
25% down · 7.5% · 30yr
- Down + closing
- —
- Monthly P&I
- —
- Monthly cashflow
- —
- DSCR
- —
- Eligible?
- —
Personal DTI + credit; lowest rate.
DSCR
20% down · 8.5% · 30yr
- Down + closing
- —
- Monthly P&I
- —
- Monthly cashflow
- —
- DSCR
- —
- Eligible?
- —
No personal income docs; deal must DSCR.
Hard money
10% down · 12.0% · 12mo
- Down + closing
- —
- Monthly P&I
- —
- Monthly cashflow
- —
- DSCR
- —
- Eligible?
- —
Short-term bridge; refi at stabilization.
Rent comps 33 comps
| Address | Beds | Baths | Sqft | Rent | $/sqft | DOM | Units | Dist |
|---|---|---|---|---|---|---|---|---|
| 250 Cape Harbour Loop #106 Bradenton, FL | 2.0 | 2.5 | 1429 | $1,775 | $1.24 | 14d | 1 | 0.08mi |
| 250 Cape Harbour Loop Bradenton, FL | 3.0 | 2.5 | 1200 | $1,800 | $1.50 | 23d | 1 | 0.08mi |
| 257 Cape Harbour Loop #101 Bradenton, FL | 3.0 | 2.5 | 1200 | $1,925 | $1.60 | 3d | 1 | 0.09mi |
| 257 Cape Harbour Loop #104 Bradenton, FL | 2.0 | 2.5 | 1429 | $1,700 | $1.19 | 23d | 1 | 0.09mi |
| 311 Cape Harbour Loop #103 Bradenton, FL | 2.0 | 2.5 | 1429 | $1,850 | $1.29 | 14d | 1 | 0.09mi |
| 267 Cape Harbour Loop #101 Bradenton, FL | 3.0 | 2.5 | 1200 | $1,700 | $1.42 | 23d | 1 | 0.11mi |
| 262 Cape Harbour Loop #102 Bradenton, FL | 3.0 | 2.5 | 1200 | $1,900 | $1.58 | 23d | 1 | 0.12mi |
| 360 Cape Harbour Loop #105 Bradenton, FL | 3.0 | 2.5 | 1429 | $2,200 | $1.54 | 23d | 1 | 0.13mi |
| 208 Cape Harbour Loop #101 Bradenton, FL | 3.0 | 2.5 | 1200 | $2,000 | $1.67 | 23d | 1 | 0.14mi |
| 280 Cape Harbour Loop #101 Bradenton, FL | 3.0 | 2.5 | 1400 | $2,100 | $1.50 | 15d | 1 | 0.15mi |
| 6510 Anchor Loop Bradenton, FL | 1.0–3.0 | 1.0–2.0 | 1135 | $2,180 | $1.92 | 1d | 32 | 0.32mi |
| 6760 Willowshire Way Bradenton, FL | 3.0 | 2.0 | 1387 | $3,500 | $2.52 | 23d | 1 | 0.46mi |
| 131 Babbling Brook Run Bradenton, FL | 3.0 | 2.0 | 1387 | $2,200 | $1.59 | 23d | 1 | 0.49mi |
| 6110 9th Avenue Cir NE Bradenton, FL | 2.0 | 1.5 | 1000 | $2,000 | $2.00 | 23d | 1 | 0.80mi |
| 6519 Grand Estuary Trl Bradenton, FL | 2.0 | 2.0 | 1156 | $3,000 | $2.60 | 23d | 2 | 0.86mi |
| 6515 Grand Estuary Trl #107 Bradenton, FL | 2.0 | 2.0 | 1156 | $3,950 | $3.42 | 23d | 1 | 0.87mi |
| 6411 Grand Estuary Trl #401 Bradenton, FL | 2.0 | 2.0 | 1156 | $2,325 | $2.01 | 15d | 1 | 0.89mi |
| 7005 River Hammock Dr #305 Bradenton, FL | 2.0 | 2.0 | 1121 | $2,500 | $2.23 | 23d | 1 | 0.91mi |
| 7019 River Hammock Dr Bradenton, FL | 2.0–3.0 | 2.0 | 1209 | $2,350 | $1.94 | 11d | 2 | 0.93mi |
| 7121 River Hammock Dr Bradenton, FL | 2.0 | 2.0 | 1176 | $2,248 | $1.91 | 23d | 2 | 0.93mi |
| 7121 River Hammock Dr Unit 1546059P Bradenton, FL | 2.0 | 2.0 | 1151 | $2,903 | $2.52 | 15d | 1 | 0.93mi |
| 7607 Grand Estuary Trl Bradenton, FL | 2.0 | 2.0 | 1226 | $2,900 | $2.37 | 23d | 2 | 1.15mi |
| 7705 Grand Estuary Trl Bradenton, FL | 2.0 | 2.0 | 1175 | $1,975 | $1.68 | 15d | 2 | 1.20mi |
| 7803 Grand Estuary Trl Bradenton, FL | 2.0 | 2.0 | 1371 | $2,650 | $1.93 | 23d | 2 | 1.24mi |
| 7911 Grand Estuary Trl Bradenton, FL | 2.0 | 2.0 | 1156 | $3,500 | $3.03 | 23d | 2 | 1.28mi |
| 8105 Grand Estuary Trl Bradenton, FL | 2.0 | 2.0 | 1138 | $2,875 | $2.53 | 3d | 3 | 1.35mi |
| 803 Fairwaycove Ln Bradenton, FL | 2.0 | 2.0 | 1165 | $1,835 | $1.58 | 3d | 2 | 1.38mi |
| 8205 Grand Estuary Trl Bradenton, FL | 2.0 | 2.0 | 1121 | $2,125 | $1.90 | 15d | 2 | 1.39mi |
| 8309 Grand Estuary Trl Bradenton, FL | 2.0 | 2.0 | 1185 | $3,375 | $2.85 | 15d | 2 | 1.42mi |
| 819 Fairwaycove Ln Bradenton, FL | 2.0 | 2.0 | 1165 | $1,950 | $1.67 | 15d | 2 | 1.42mi |
| 905 Fairwaycove Ln #205 Bradenton, FL | 2.0 | 2.0 | 1104 | $4,000 | $3.62 | 14d | 1 | 1.44mi |
| 8403 Grand Estuary Trl Bradenton, FL | 2.0 | 2.0 | 1138 | $2,900 | $2.55 | 23d | 2 | 1.46mi |
| 9027 Stone Harbour Loop Bradenton, FL | 2.0 | 2.0 | 1328 | $2,400 | $1.81 | 23d | 1 | 1.48mi |
HOA detail condo
- Monthly dues
- $375 · $4,500/yr
- Likely covers
- pool
- Assessments
- None detected in remarks — confirm with the listing agent.
Listing history 13 events
-
2026-05-05status Pending
-
2026-05-01$185,000 Active
-
2025-12-31historical
-
2025-12-05price $200,000
-
2025-05-30price $224,900
-
2025-05-16$235,000 Active
-
2025-01-29historical
-
2024-11-26price $249,000
-
2024-07-30price $259,900
-
2024-07-29$265,000 Active
-
2010-12-16soldstatus $65,000
-
2010-12-10soldstatus $65,000
-
2010-03-08$69,000
ⓘ Source: listings_history table (triggers on properties + properties_extension) + one-shot
backfill from property_details.listing_events for pre-trigger history.
Tax reassessment forecast FL · Resets to sale price
- Current annual tax
- $3,086 · $257/mo
- Projected year-2 tax
- $3,086 · $257/mo
- Expected delta
- $0/yr ($0/mo · 0.0%)
ⓘ Screening estimate from a state-policy table — verify with the county assessor before closing.
Climate risk First Street
- Flood 6/10 Major FEMA zone X (shaded) · 56% chance over 30 yrs
- Wildfire 1/10 Low
- Heat 10/10 Extreme 7 d/yr ≥107°F today · 31 d/yr by 30 yrs out
- Wind 10/10 Extreme 99% chance of damaging wind over 30 yrs
- Air quality 3/10 Moderate 3 unhealthy d/yr today · 3 by 30 yrs out
Nearby sold comps map
Loading sold comps map…
Walkable amenities ~0.75 mi
Loading nearby amenities…
Taxation est. · year 1
- Rental income
- $26,498
- − Mortgage interest
- −$10,363
- − Property taxes
- −$3,086
- − Insurance
- −$925
- − Repairs & maintenance
- −$2,120
- − Management
- −$2,120
- − HOA
- −$4,500
- − Depreciation
- −$5,382
- Taxable loss
- −$1,997
- Est. tax savings @ 24.0%
- +$479
- After-tax cash flow
- $1,260/yr
For passive investors: Depreciation is non-cash, so a rental often shows a tax loss while cash-flowing — sheltering income. Rental losses are passive: they offset passive income freely, and up to $25,000/yr can offset ordinary (W-2) income if you actively participate and your MAGI is under $100k (phasing out to $0 by $150k); unused losses carry forward. On sale, claimed depreciation is recaptured at up to 25%, and gains may owe capital-gains tax (a 1031 exchange can defer both). Figures are a year-1 estimate at your 24.0% rate — not tax advice; consult a CPA.
Schools (NCES district)
- District
- Manatee
- NCES district ID
- 1201230
- Math proficiency
- 54% ▼ -6.00%
- Reading proficiency
- 50% ▼ -2.00%
- Median HH income
- $49,607
- Composite
- 44.43/100
- National rank
- #2806
- State rank
- #26 of 73 in FL
Livability — Bradenton
- Score
- 81/100
- State rank
- #101
- US rank
- #1528
Category grades
Schools grade is shown separately in the Schools card above.
Census & demographics
- County
- Manatee County · 416,364 people
- City population
- 227,091
- Metro
- North Port-Sarasota-Bradenton, FL
- Population (ZIP)
- 25,536
- Household income
- $125,486
- Rent vs Own
- Severe rent burden
- 383.0
Population outlook (Manatee County) Hauer SSP2
- Today (2025)
- 447,342 people
- By 2030
- 488,911 · +9.3%
- By 2040
- 567,934 · +27.0%
- By 2050
- 637,995 · +42.6%
- By 2075
- 781,970 · +74.8%
- By 2100
- 848,272 · +89.6%
Race, ethnicity, and origin ACS 2023
- Neighborhood character
- Predominantly White (81%)
- Race & ethnicity
- White 81% Hispanic / Latino 10% Two or more races 8% Black 3% Asian 2%
- Hispanic origin (detail)
- Mexican 1% Puerto Rican 2% Cuban 1%
- Common ancestry
- Romanian 5% Lithuanian 3% Slovak 2%
- Foreign-born
- 9% · Canada, Vietnam, China
- Languages at home
- 89% English-only · Spanish 6% Other Indo-European 2% Vietnamese 2%
Political lean MEDSL · Manatee
- 2024 margin
- Strong R (+23.5) · D 37.9% · R 61.4%
- 2008→2024 swing
- -16.5pp toward R · 2008: -7.0pp · 2024: -23.5pp
- All cycles
- 2024: R+23.5 2020: R+16.1 2016: R+17.1 2012: R+12.5 2008: R+7.0
Not yet ingested
- Civics
- —
Market trends
- HPI YoY
- ▼ -1.82%
- Current HPI
- 276.7636
- Rent YoY
- ▼ -3.44%
- Metro
- North Port-Sarasota-Bradenton, FL
- State GDP YoY
- ▲ 3.28%
- F500 in state
- 36
Industry mix (Fortune 500 HQ in FL)
| Industry | F500 HQs | Revenue |
|---|---|---|
| Industrial Technology | 2 | $29B |
|
||
| Insurance | 2 | $17B |
|
||
| Retail | 1 | $60B |
|
||
| Technology Distribution | 1 | $58B |
|
||
| Homebuilding | 1 | $35B |
|
||
| Technology Manufacturing | 1 | $35B |
|
||
Price history
+168.1% since first listed13 events — show timeline
- 2026-05-05 Pending — Stellar MLS as Distributed by MLS Grid
- 2026-05-01 Listed $185,000 Stellar MLS as Distributed by MLS Grid
- 2025-12-31 Listing Removed — Stellar MLS as Distributed by MLS Grid
- 2025-12-05 Price Changed $200,000 Stellar MLS as Distributed by MLS Grid
- 2025-05-30 Price Changed $224,900 Stellar MLS as Distributed by MLS Grid
- 2025-05-16 Listed $235,000 Stellar MLS as Distributed by MLS Grid
- 2025-01-29 Listing Removed — Stellar MLS as Distributed by MLS Grid
- 2024-11-26 Price Changed $249,000 Stellar MLS as Distributed by MLS Grid
- 2024-07-30 Price Changed $259,900 Stellar MLS as Distributed by MLS Grid
- 2024-07-29 Listed $265,000 Stellar MLS as Distributed by MLS Grid
- 2010-12-16 Sold (Public Records) $65,000 Public Records
- 2010-12-10 Sold (MLS) $65,000 Stellar MLS as Distributed by MLS Grid
- 2010-03-08 Listed $69,000 Stellar MLS as Distributed by MLS Grid
Property tax history
+8.6%/yrLatest (2025): $3,086 · -0.2% YoY. Source: county tax records.
Cash-flow waterfall
monthlySold comps — $/sqft
last 12 mo · ≤1 miLoading sold comps…