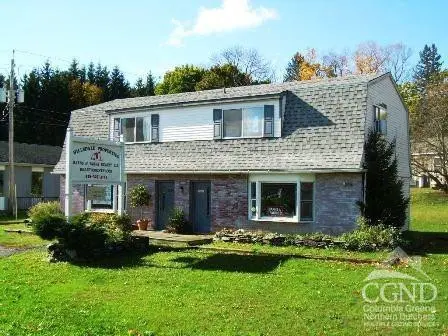
9249 Route 22 · Copake Lake, NY
Flood risk No data
- FEMA flood zone
- —
- Chance of flooding over 30 yrs
- —
- Est. flood insurance / yr
- —
Fire risk No data
- Est. fire insurance / yr
- —
Heat risk No data
- Hot days now (above threshold)
- —
- Hot days in 30 yrs
- —
Wind risk No data
- Chance of severe wind over 30 yrs
- —
Air-quality risk No data
- Unhealthy air days now
- —
- Unhealthy air days in 30 yrs
- —
Risk factors via First Street. Map © Google.
Why this score? — see what drove the C grade
The composite is a weighted blend of 9 inputs, each scored 0–100. Each bar is that input's sub-score; the figure is the points it added to the 100-point composite (weight × sub-score).
- ARV discount +15.0/15.0
- Cash flow +12.4/30.0
- Appreciation +10.0/10.0
- Schools +4.5/10.0
- DSCR +3.7/10.0
- 1% rule +3.5/10.0
- Livability +3.1/5.0
- Rent growth +2.5/5.0
- Condition / age +2.5/5.0
$257,000
🖨 Deal sheet (PDF) 📄 Offer letter ✓ Due diligence
Listing remarks MLS
Mixed Residential/Commercial building, with 3 rentable spaces. Current RR 30,540. One side of building has commercial reception area down and 1BR apartment above. Rental 1395/m. Other side is studio apartment up and storefront down. Can be rented to same party for commercial downstairs. Current rental is 795 + 550. Ideal for live/work. Building in excellent condition, roof less than 5 years old. Great location on Route 22 just South of intersection of routes 22 and 23 opposite Stewart's
Key facts
- 1br apartment
- Studio apartment
- Storefront
Tags
Neighborhood map
What this means for you Summary
Snapshot
- This is a 3-bed/?-bath single-family listed at $257k.
Deal economics
- At list price, monthly cash flow is $-43 ($-516/yr) — negative.
- To cash-flow at today's rent, offer at most $251k (2.4% below list).
- To meet the 1% rule (rent ≥ 1% of price), the offer needs to be $219k (14.6% below list).
- Recommended offer: $219k (14.6% below list) — sets the bar for 1% rule.
- Cap rate 6.1% vs local median 2.4% in Copake Lake — top-decile yield for the area; either an underpriced asset or a hidden risk that comps aren't pricing in. Stress-test before assuming the spread holds.
Location & tenants
- Location reads 62/100 on livability (#841 in NY) — a middle-class / working-renter tenant base. Strengths: employment A+, housing A+; Watch: amenities F, commute F, cost of living F.
- Taconic Hills Central School District (rural): math 53% / reading 51% proficiency, ranked #335 of 590 in NY (top 57%) — acceptable for families but not a draw, mixed tenant base, ~2y average lease.
- Zoned schools: Taconic Hills Elementary School (math 53% / reading 50%, grade C-, #1,041 of 2,108 statewide, top 50%, 562 students, 57% FRL); Taconic Hillsjunior/Senior High School (math 52% / reading 52%, grade D+, #946 of 1,100 statewide, top 88%, 502 students, 45% FRL).
- Market conditions: 55 active listings in the ZIP; 136 units permitted in Columbia County in 2024 (0 in 5+ unit buildings).
Forward outlook
- In year one you build about $27k of equity ($2k loan paydown + $26k appreciation (10.0% local appreciation)).
- Columbia County population projected at -22% by 2050 — secular population decline; favor cash flow + early exit over multi-decade hold.
- At projected returns (10.0% appreciation + 3.0% rent growth), your $72k cash investment doubles in ~3 years — after that, you're playing with house money.
- By year 2, paydown + projected appreciation supports a ~$44k cash-out refi (75% LTV) — recoverable capital for the next deal without selling this one.
Negotiation context
- It's been on market 69 days — a 6% lower offer ($242k) is reasonable based on typical stale-listing flexibility.
- 7 sale attempts since 3y ago with the ask held roughly flat each time — persistent listings suggest the price (not the market) is what's stuck; bring a comps-based counter.
Questions for the listing agent
- What do current leases actually rent for vs. the listed asking? Can we see a recent rent roll and the last 12 months of T-12 income?
- It's been on market 69 days. Have you received any prior offers? Is the seller open to a 15% concession, seller financing, or rate buy-down credit?
- Built in 1970 — when were the roof, HVAC, electrical panel, plumbing, and water heater last replaced?
- Why hasn't it sold? Are there any deal-killer items the seller is aware of (foundation, flood, title, zoning, code violations)?
- Is there a deadline driving the sale (1031 exchange, divorce, estate, relocation)? That informs how much negotiation room exists.
- Schools are D-rated, which usually means shorter tenancies and higher turnover. Who's the typical renter profile here, and what's been the actual vacancy rate?
- What's the average days-on-market for RENTAL listings here right now (not sales)? A rising rental-DOM trend means longer vacancies and softer asking-rent achievability than the comps imply.
- What's the recent tenant-quality profile in this submarket — average credit score on applications, eviction rate, late-payment / NSF rate, and stable-employment percentage? A property-management company in the area should have these aggregated.
- How much new for-sale + rental construction is in the pipeline within 1–3 miles? Heavy new supply typically softens prices + rents 12–24 months out; constrained supply supports both.
Investment metrics
- 1% rule
- 0.85% ✗
- Cap rate
- 6.09%
- Cash-on-cash
- -0.72%
- DSCR
- 0.97
- GRM
- 9.8
CMA / ARV
- ARV (median comp)
- $439,022
- List price
- $257,000
- Delta
- -41.46%
- Verdict
- UNDERPRICED
- Comps
- 2 within 1.0 mi
Projected returns pro-forma
10.0% appreciation · 3.0% rent growth · sell at horizon
- IRR
- 23.8%
- Equity multiple
- 2.91×
- Total profit
- $137,264
- Equity at exit
- $231,526
- IRR
- 21.1%
- Equity multiple
- 6.65×
- Total profit
- $406,439
- Equity at exit
- $499,294
Cash invested: $71,960 (down + closing). Projections, not guarantees.
Landlord ↔ Tenant lean methodology
- Overall (STATE)
- 15 Strongly Tenant-Friendly
- State New York
- 15 Strongly Tenant-Friendly · D+10
- County
- — inherits STATE
- City
- — inherits STATE
ZIP-level market 12529
- Home prices YoY
- 17.9%
- Active inventory
- 55
- Price-to-rent
- 9.8×
Monthly cashflow live
- Estimated rent
- $2,194 medium interval (Pro) →
- Mortgage (P&I)
- −$1,348
- Tax est. 1.5%
- −$321 /mo · $3,855/yr
- Insurance
- −$107
- HOA
- −$0
- Vacancy / Maint / Mgmt
- −$461
- Net cashflow
- $-43
Break-even live
Sensitivity live
| Price | -10% $135 | -5% $46 | +0% $-43 | +5% $-132 | +10% $-221 |
|---|---|---|---|---|---|
| Rent | -10% $-216 | -5% $-130 | +0% $-43 | +5% $44 | +10% $130 |
| Rate | -1.0pp $86 | -0.5pp $22 | base $-43 | +0.5pp $-110 | +1.0pp $-177 |
UW: 25.0% down · 7.5% · 30yr · 1.5% tax · 5.0% vac · 8.0% maint · 8.0% mgmt
Financing live
Cash to close
- Down payment
- $64,250
- Closing costs
- $7,710
- Reserves months
- —
- Total cash needed
- —
Loan-product check · same deal, 3 products live
Conventional
25% down · 7.5% · 30yr
- Down + closing
- —
- Monthly P&I
- —
- Monthly cashflow
- —
- DSCR
- —
- Eligible?
- —
Personal DTI + credit; lowest rate.
DSCR
20% down · 8.5% · 30yr
- Down + closing
- —
- Monthly P&I
- —
- Monthly cashflow
- —
- DSCR
- —
- Eligible?
- —
No personal income docs; deal must DSCR.
Hard money
10% down · 12.0% · 12mo
- Down + closing
- —
- Monthly P&I
- —
- Monthly cashflow
- —
- DSCR
- —
- Eligible?
- —
Short-term bridge; refi at stabilization.
Listing history 35 events
-
2026-06-19days on market $257,000 Active 69 DOM
-
2026-06-18days on market $257,000 Active 68 DOM
-
2026-06-17days on market $257,000 Active 67 DOM
-
2026-06-16days on market $257,000 Active 66 DOM
-
2026-06-15days on market $257,000 Active 65 DOM
-
2026-06-14pricedays on market $257,000 Active 63 DOM
-
2026-06-12days on market $259,000 Active 62 DOM
-
2026-06-09days on market $259,000 Active 59 DOM
-
2026-06-08days on market $259,000 Active 58 DOM
-
2026-06-07days on market $259,000 Active 57 DOM
-
2026-06-07days on market $259,000 Active 56 DOM
-
2026-06-04days on market $259,000 Active 53 DOM
-
2026-06-02days on market $259,000 Active 52 DOM
-
2026-06-01days on market $259,000 Active 51 DOM
-
2026-05-31days on market $259,000 Active 50 DOM
-
2026-05-31days on market $259,000 Active 49 DOM
-
2026-04-11$259,000 Active 491-char remark
Show marketing remark (491 chars)
Mixed Residential/Commercial building, with 3 rentable spaces. Current RR 30,540. One side of building has commercial reception area down and 1BR apartment above. Rental 1395/m. Other side is studio apartment up and storefront down. Can be rented to same party for commercial downstairs. Current rental is 795 + 550. Ideal for live/work. Building in excellent condition, roof less than 5 years old. Great location on Route 22 just South of intersection of routes 22 and 23 opposite Stewart's
-
2026-01-01historical
-
2025-10-29price $259,000
-
2025-10-27price $259,000
-
2025-09-28price $269,000
-
2025-09-28price $269,000
-
2025-09-16price $274,000
-
2025-09-16price $274,000
-
2025-08-30status Active
-
2025-08-28$279,000 Active
-
2025-08-10historical Active Under Contract
-
2025-07-24status Pending
-
2025-07-24historical
-
2025-05-18price $279,000
-
2025-04-14price $289,000
-
2025-01-27$279,000 Active
-
2025-01-27$299,000 Active
-
2024-05-08$319,000
-
2023-08-30$334,000
ⓘ Source: listings_history table (triggers on properties + properties_extension) + one-shot
backfill from property_details.listing_events for pre-trigger history.
Nearby sold comps map
Loading sold comps map…
Walkable amenities ~0.75 mi
Loading nearby amenities…
Taxation est. · year 1
- Rental income
- $26,325
- − Mortgage interest
- −$14,396
- − Property taxes
- −$3,855
- − Insurance
- −$1,285
- − Repairs & maintenance
- −$2,106
- − Management
- −$2,106
- − Depreciation
- −$7,476
- Taxable loss
- −$4,899
- Est. tax savings @ 24.0%
- +$1,176
- After-tax cash flow
- $660/yr
For passive investors: Depreciation is non-cash, so a rental often shows a tax loss while cash-flowing — sheltering income. Rental losses are passive: they offset passive income freely, and up to $25,000/yr can offset ordinary (W-2) income if you actively participate and your MAGI is under $100k (phasing out to $0 by $150k); unused losses carry forward. On sale, claimed depreciation is recaptured at up to 25%, and gains may owe capital-gains tax (a 1031 exchange can defer both). Figures are a year-1 estimate at your 24.0% rate — not tax advice; consult a CPA.
Schools (NCES district)
- District
- Taconic Hills Central School District
- NCES district ID
- 3628620
- Math proficiency
- 53% ▲ 10.00%
- Reading proficiency
- 51% ▲ 11.00%
- Median HH income
- $57,329
- Composite
- 45.16/100
- National rank
- #2676
- State rank
- #335 of 590 in NY
Livability — Copake Lake
- Score
- 62/100
- State rank
- #841
- US rank
- #16329
Category grades
Schools grade is shown separately in the Schools card above.
Census & demographics
- Population (ZIP)
- 2,345
Population outlook (Columbia County) Hauer SSP2
- Today (2025)
- 58,662 people
- By 2030
- 56,557 · -3.6%
- By 2040
- 51,324 · -12.5%
- By 2050
- 45,790 · -21.9%
- By 2075
- 35,232 · -39.9%
- By 2100
- 25,846 · -55.9%
Race, ethnicity, and origin ACS 2023
- Neighborhood character
- Predominantly White (90%)
- Race & ethnicity
- White 90% Two or more races 5% Hispanic / Latino 5%
- Common ancestry
- Iranian 6% Slovak 5% Lithuanian 4%
- Foreign-born
- 5% · Canada
- Languages at home
- 95% English-only · French/Haitian/Cajun 1% Spanish 1% German/W. Germanic 1%
Political lean MEDSL · Columbia
- 2024 margin
- D (+14.7) · D 57.4% · R 42.6%
- 2008→2024 swing
- +1.3pp toward D · 2008: 13.4pp · 2024: 14.7pp
- All cycles
- 2024: D+14.7 2020: D+16.7 2016: D+1.4 2012: D+11.7 2008: D+13.4
Not yet ingested
- Civics
- —
Market trends
- HPI YoY
- ▲ 69.61%
- Current HPI
- 458.3911
- Rent YoY
- —
- Metro
- —
- State GDP YoY
- ▲ 2.60%
- F500 in state
- 92
Industry mix (Fortune 500 HQ in NY)
| Industry | F500 HQs | Revenue |
|---|---|---|
| Financial Services | 10 | $950B |
|
||
| Consumer Goods | 9 | $162B |
|
||
| Insurance | 4 | $225B |
|
||
| Telecommunications | 2 | $144B |
|
||
| Pharmaceuticals | 2 | $112B |
|
||
| Media / Entertainment | 2 | $69B |
|
||
Price history
-22.5% since first listed19 events — show timeline
- 2026-04-11 Listed $259,000 HVCRMLS
- 2026-01-01 Listing Removed — OneKey® MLS as Distributed by MLS Grid
- 2025-10-29 Price Changed $259,000 OneKey® MLS as Distributed by MLS Grid
- 2025-10-27 Price Changed $259,000 HVCRMLS
- 2025-09-28 Price Changed $269,000 OneKey® MLS as Distributed by MLS Grid
- 2025-09-28 Price Changed $269,000 HVCRMLS
- 2025-09-16 Price Changed $274,000 OneKey® MLS as Distributed by MLS Grid
- 2025-09-16 Price Changed $274,000 HVCRMLS
- 2025-08-30 Relisted — HVCRMLS
- 2025-08-28 Listed $279,000 OneKey® MLS as Distributed by MLS Grid
- 2025-08-10 Contingent — HVCRMLS
- 2025-07-24 Pending — OneKey® MLS as Distributed by MLS Grid
- 2025-07-24 Listing Removed — OneKey® MLS as Distributed by MLS Grid
- 2025-05-18 Price Changed $279,000 OneKey® MLS as Distributed by MLS Grid
- 2025-04-14 Price Changed $289,000 OneKey® MLS as Distributed by MLS Grid
- 2025-01-27 Listed $299,000 OneKey® MLS as Distributed by MLS Grid
- 2025-01-27 Listed $279,000 HVCRMLS
- 2024-05-08 Listed $319,000 HVCRMLS
- 2023-08-30 Listed $334,000 HVCRMLS
Cash-flow waterfall
monthlySold comps — $/sqft
last 12 mo · ≤1 miLoading sold comps…