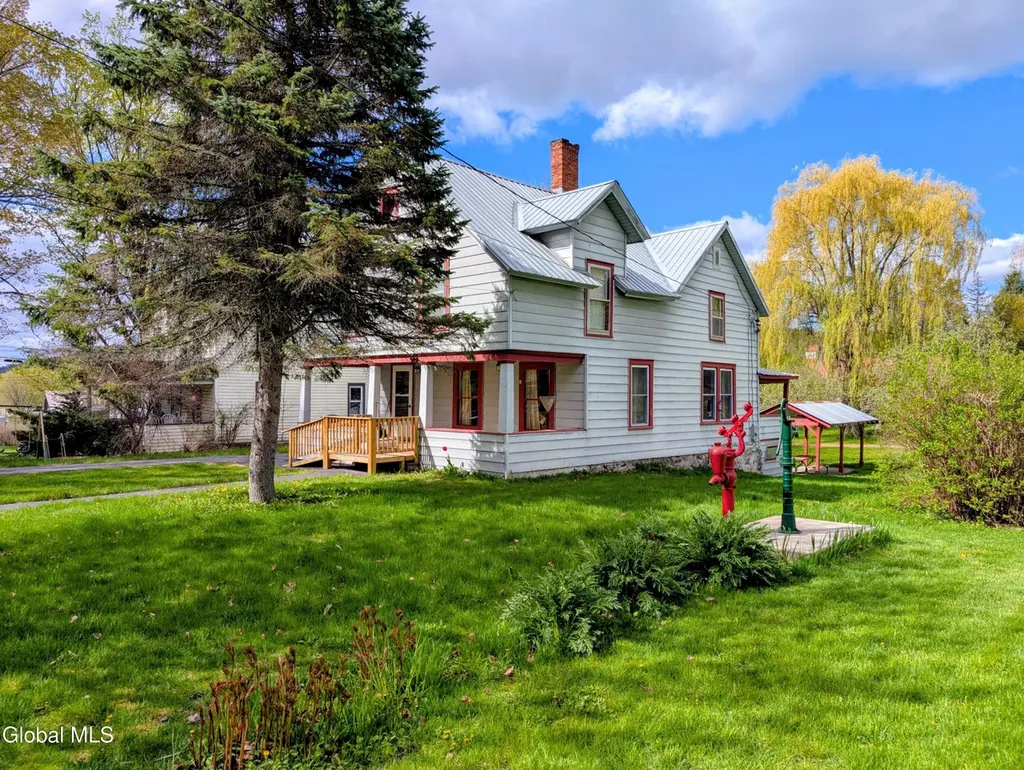
2589 Center Rd · Mineville, NY
Flood risk 1/10 · Minimal
- FEMA flood zone
- X
- Chance of flooding over 30 yrs
- 0.0%
- Est. flood insurance / yr
- $473 – $860
Fire risk 1/10 · Minimal
- Est. fire insurance / yr
- $691 – $1,283
Heat risk 2/10 · Minimal
- Hot days now (above 94°F)
- 7 days/yr
- Hot days in 30 yrs
- 15 days/yr
Wind risk 1/10 · Minimal
- Chance of severe wind over 30 yrs
- 1.0%
Air-quality risk 1/10 · Minimal
- Unhealthy air days now
- 0 days/yr
- Unhealthy air days in 30 yrs
- 0 days/yr
Risk factors via First Street. Map © Google.
Why this score? — see what drove the C+ grade
The composite is a weighted blend of 9 inputs, each scored 0–100. Each bar is that input's sub-score; the figure is the points it added to the 100-point composite (weight × sub-score).
- Cash flow +17.3/30.0
- ARV discount +15.0/15.0
- Appreciation +8.2/10.0
- DSCR +5.4/10.0
- 1% rule +4.6/10.0
- Schools +4.0/10.0
- Livability +3.1/5.0
- Rent growth +2.5/5.0
- Condition / age +2.5/5.0
$144,900
🖨 Deal sheet (PDF) 📄 Offer letter ✓ Due diligence
Listing remarks
Beautiful 4 bed, 1 bath Craftsman style home on 0.30 acres. Large front and rear porches, 1 car garage, as well as a canopy?carport in the backyard for your picnic table and grill or that perfect car project. Downstairs offers a large eat in kitchen, foyer, double living room with fireplace, and plenty of storage space. Full basement has been insulated, and furnace was updated 6 or 7 years ago. House was rewired, 100 amp service. Second floor offers 4 large bedrooms with cedar closets in two bedrooms and ample closet space in the two other bedrooms. Hardwood floors throughout most of the home, including under the carpet in the living room. Home has steel siding, metal roof, storm windows an
Key facts
- Craftsman style home
- Large eat in kitchen
- Canopy carport
Tags
Property features AI
Finance
- Other: Lot approximately 0.3 acres (cleared) with dimensions 64 x 181 x 167 x 60 and 64 feet main road frontage
Exterior
- Parking: Attached garage (1 car) and additional detached garage(s); Carport; Driveway parking; Total parking for 3 vehicles; Paved parking
- Security: Smoke detector(s); Carbon monoxide detector(s); Owned security system
- Utilities: 100 Amp electric service with circuit breakers; Public water; Public sewer
- Home design: Single family residence; Main entry on first level; Metal roof
- Construction: Aluminum siding and other construction materials; Stone foundation; Metal roof
- Exterior features: Rear porch; Front porch; Paved driveway; Garden; Pergola; Detached garage(s)
Interior
- Kitchen: Electric oven; Range hood; Refrigerator
- Bedrooms: Primary bedroom on second level; Three additional bedrooms on second level
- Flooring: Carpet; Hardwood; Laminate
- Bathrooms: One full bathroom
- Heating & cooling: Hot water heating (oil); Window unit(s) for cooling
- Interior features: Walk-in closet(s); Built-in features; Full unfinished basement with interior entry and heating
- Laundry & utility: Washer; Laundry on main level
Neighborhood map
What this means for you Summary
Snapshot
- This is a 4-bed/1.0-bath single-family listed at $145k.
Deal economics
- At list price, monthly cash flow is $105 ($1k/yr) — positive.
- The deal already cash-flows at list — no discount required.
- To meet the 1% rule (rent ≥ 1% of price), the offer needs to be $139k (3.9% below list).
- Recommended offer: $139k (3.9% below list) — sets the bar for 1% rule.
Location & tenants
- Location reads 62/100 on livability (#891 in NY) — a middle-class / working-renter tenant base. Strengths: cost of living A+, housing A+, health & safety A; Watch: amenities F, commute F, employment F.
- Moriah Central School District (rural): math 41% / reading 52% proficiency, ranked #445 of 590 in NY (top 75%) — families likely to look elsewhere, expect single-tenant / working-renter base with shorter leases.
- Zoned schools: Moriah Elementary School (math 42% / reading 47%, grade F, #1,277 of 2,108 statewide, top 64%, 385 students, 47% FRL); Moriah Junior-Senior High School (math 37% / reading 57%, grade D-, #1,007 of 1,100 statewide, top 93%, 316 students, 34% FRL) — zoned schools at 40% FRL track the district average.
- Market conditions: 10 active listings in the ZIP; 218 units permitted in Essex County in 2024 (63 in 5+ unit buildings).
Forward outlook
- In year one you build about $10k of equity ($1k loan paydown + $9k appreciation (6.3% local appreciation)).
- Essex County population projected at -20% by 2050 — secular population decline; favor cash flow + early exit over multi-decade hold.
- At projected returns (6.3% appreciation + 3.0% rent growth), your $41k cash investment doubles in ~4 years — after that, you're playing with house money.
- By year 4, paydown + projected appreciation supports a ~$35k cash-out refi (75% LTV) — recoverable capital for the next deal without selling this one.
Negotiation context
- It's been on market 15 days — a 2% lower offer ($143k) is reasonable based on typical stale-listing flexibility.
- 2 sale attempts with the ask held roughly flat each time — persistent listings suggest the price (not the market) is what's stuck; bring a comps-based counter.
Risks & watch-outs
- Watch-outs: built in 1905 — expect roof / HVAC / electrical / plumbing capex.
Questions for the listing agent
- Built in 1905 — when were the roof, HVAC, electrical panel, plumbing, and water heater last replaced?
- Is there a deadline driving the sale (1031 exchange, divorce, estate, relocation)? That informs how much negotiation room exists.
- Schools are F-rated, which usually means shorter tenancies and higher turnover. Who's the typical renter profile here, and what's been the actual vacancy rate?
- What's the average days-on-market for RENTAL listings here right now (not sales)? A rising rental-DOM trend means longer vacancies and softer asking-rent achievability than the comps imply.
- What's the recent tenant-quality profile in this submarket — average credit score on applications, eviction rate, late-payment / NSF rate, and stable-employment percentage? A property-management company in the area should have these aggregated.
- How much new for-sale + rental construction is in the pipeline within 1–3 miles? Heavy new supply typically softens prices + rents 12–24 months out; constrained supply supports both.
Investment metrics
- 1% rule
- 0.96% ✗
- Cap rate
- 7.16%
- Cash-on-cash
- 3.11%
- DSCR
- 1.14
- GRM
- 8.7
CMA / ARV
- ARV (median comp)
- $190,610
- List price
- $144,900
- Delta
- -23.98%
- Verdict
- UNDERPRICED
- Comps
- 13 within 1.0 mi
Show comp detail 5 sales within ~0.75 mi
| Address | Dist | Beds/Ba | Sqft | Sold | Price | $/sf | Match |
|---|---|---|---|---|---|---|---|
| 644 Tarbell Hill Rd | 0.17mi | 4/2.0 | 1,612 (+9%) | 2mo | $124,000 | $77 | 72 |
| 2624 Center Rd | 0.17mi | 4/1.0 | 1,359 (-8%) | 10mo | $113,000 | $83 | 70 |
| 2615 Center Rd | 0.13mi | 3/1.0 (-1) | 1,585 (+7%) | 19mo | $165,000 | $104 | 62 |
| 2543 Moriah Rd | 0.21mi | 3/1.0 (-1) | 1,270 (-14%) | 10mo | $137,800 | $109 | 53 |
| 2473 Moriah Rd | 0.55mi | 4/1.5 | 1,600 (+8%) | 15mo | $291,500 | $182 | 48 |
Match score weights: distance 35% · size 25% · config 20% · recency 20%. Top-matched comps best support the ARV.
Projected returns pro-forma
6.33% appreciation · 3.0% rent growth · sell at horizon
- IRR
- 18.7%
- Equity multiple
- 2.27×
- Total profit
- $51,433
- Equity at exit
- $94,149
- IRR
- 18.1%
- Equity multiple
- 4.58×
- Total profit
- $145,366
- Equity at exit
- $173,440
Cash invested: $40,572 (down + closing). Projections, not guarantees.
Landlord ↔ Tenant lean methodology
- Overall (STATE)
- 15 Strongly Tenant-Friendly
- State New York
- 15 Strongly Tenant-Friendly · D+10
- County
- — inherits STATE
- City
- — inherits STATE
ZIP-level market 12960
- Home prices YoY
- 1.9%
- Active inventory
- 10
- Price-to-rent
- 8.7×
Monthly cashflow live
- Estimated rent
- $1,393 medium interval (Pro) →
- Mortgage (P&I)
- −$760
- Tax from tax record
- −$175 /mo · $2,100/yr
- Insurance
- −$60
- HOA
- −$0
- Vacancy / Maint / Mgmt
- −$293
- Net cashflow
- $105
Break-even live
Sensitivity live
| Price | -10% $187 | -5% $146 | +0% $105 | +5% $64 | +10% $23 |
|---|---|---|---|---|---|
| Rent | -10% $-5 | -5% $50 | +0% $105 | +5% $160 | +10% $215 |
| Rate | -1.0pp $178 | -0.5pp $142 | base $105 | +0.5pp $68 | +1.0pp $30 |
UW: 25.0% down · 7.5% · 30yr · 1.5% tax · 5.0% vac · 8.0% maint · 8.0% mgmt
Financing live
Cash to close
- Down payment
- $36,225
- Closing costs
- $4,347
- Reserves months
- —
- Total cash needed
- —
Loan-product check · same deal, 3 products live
Conventional
25% down · 7.5% · 30yr
- Down + closing
- —
- Monthly P&I
- —
- Monthly cashflow
- —
- DSCR
- —
- Eligible?
- —
Personal DTI + credit; lowest rate.
DSCR
20% down · 8.5% · 30yr
- Down + closing
- —
- Monthly P&I
- —
- Monthly cashflow
- —
- DSCR
- —
- Eligible?
- —
No personal income docs; deal must DSCR.
Hard money
10% down · 12.0% · 12mo
- Down + closing
- —
- Monthly P&I
- —
- Monthly cashflow
- —
- DSCR
- —
- Eligible?
- —
Short-term bridge; refi at stabilization.
Listing history 6 events
-
2026-06-21days on market $144,900 Active 15 DOM
-
2026-06-18days on market $144,900 Active 13 DOM
-
2026-06-17days on market $144,900 Active 12 DOM
-
2026-06-16days on market $144,900 Active 11 DOM
-
2026-06-16status $144,900 Active 10 DOM
-
2026-05-12$144,900 Active 867-char remark
ⓘ Source: listings_history table (triggers on properties + properties_extension) + one-shot
backfill from property_details.listing_events for pre-trigger history.
Tax reassessment forecast NY · Partial reset (capped growth)
- Current annual tax
- $2,100 · $175/mo
- Projected year-2 tax
- $2,274 · $190/mo
- Expected delta
- +$175/yr (+$15/mo · 8.3%)
ⓘ Screening estimate from a state-policy table — verify with the county assessor before closing.
Climate risk First Street
- Flood 1/10 Low FEMA zone X · 0% chance over 30 yrs
- Wildfire 1/10 Low
- Heat 2/10 Low 7 d/yr ≥94°F today · 15 d/yr by 30 yrs out
- Wind 1/10 Low 100% chance of damaging wind over 30 yrs
- Air quality 1/10 Low 0 unhealthy d/yr today · 0 by 30 yrs out
Nearby sold comps map
Loading sold comps map…
Walkable amenities ~0.75 mi
Loading nearby amenities…
Taxation est. · year 1
- Rental income
- $16,716
- − Mortgage interest
- −$8,117
- − Property taxes
- −$2,100
- − Insurance
- −$724
- − Repairs & maintenance
- −$1,337
- − Management
- −$1,337
- − Depreciation
- −$4,215
- Taxable loss
- −$1,115
- Est. tax savings @ 24.0%
- +$267
- After-tax cash flow
- $1,531/yr
For passive investors: Depreciation is non-cash, so a rental often shows a tax loss while cash-flowing — sheltering income. Rental losses are passive: they offset passive income freely, and up to $25,000/yr can offset ordinary (W-2) income if you actively participate and your MAGI is under $100k (phasing out to $0 by $150k); unused losses carry forward. On sale, claimed depreciation is recaptured at up to 25%, and gains may owe capital-gains tax (a 1031 exchange can defer both). Figures are a year-1 estimate at your 24.0% rate — not tax advice; consult a CPA.
Schools (NCES district)
- District
- Moriah Central School District
- NCES district ID
- 3619830
- Math proficiency
- 41% ▼ -6.00%
- Reading proficiency
- 52% ▲ 2.00%
- Median HH income
- $46,940
- Composite
- 39.55/100
- National rank
- #3937
- State rank
- #445 of 590 in NY
Livability — Mineville
- Score
- 62/100
- State rank
- #891
- US rank
- #17259
Category grades
Schools grade is shown separately in the Schools card above.
Census & demographics
- Population (ZIP)
- 995
Population outlook (Essex County) Hauer SSP2
- Today (2025)
- 36,758 people
- By 2030
- 35,697 · -2.9%
- By 2040
- 32,697 · -11.0%
- By 2050
- 29,248 · -20.4%
- By 2075
- 22,641 · -38.4%
- By 2100
- 16,602 · -54.8%
Race, ethnicity, and origin ACS 2023
- Neighborhood character
- Predominantly White (100%)
- Race & ethnicity
- White 100%
- Common ancestry
- Lithuanian 21% Slovak 12% Romanian 8%
- Languages at home
- 98% English-only · French/Haitian/Cajun 2%
Political lean MEDSL · Essex
- 2024 margin
- Toss-up / Even · D 50.2% · R 49.8%
- 2008→2024 swing
- -12.8pp toward R · 2008: 13.3pp · 2024: 0.5pp
- All cycles
- 2024: D+0.5 2020: D+5.0 2016: R+3.4 2012: D+15.0 2008: D+13.3
Not yet ingested
- Civics
- —
Market trends
- HPI YoY
- ▲ 6.33%
- Current HPI
- 340.4974
- Rent YoY
- —
- Metro
- —
- State GDP YoY
- ▲ 2.60%
- F500 in state
- 92
Industry mix (Fortune 500 HQ in NY)
| Industry | F500 HQs | Revenue |
|---|---|---|
| Financial Services | 10 | $950B |
|
||
| Consumer Goods | 9 | $162B |
|
||
| Insurance | 4 | $225B |
|
||
| Telecommunications | 2 | $144B |
|
||
| Pharmaceuticals | 2 | $112B |
|
||
| Media / Entertainment | 2 | $69B |
|
||
Price history
3 events — show timeline
- 2026-06-15 Relisted — Global MLS
- 2026-05-22 Pending — Global MLS
- 2026-05-12 Listed $144,900 Global MLS
Property tax history
+3.5%/yrLatest (2025): $2,100 · -23.8% YoY. Source: county tax records.
Cash-flow waterfall
monthlySold comps — $/sqft
last 12 mo · ≤1 miLoading sold comps…