 Duplex
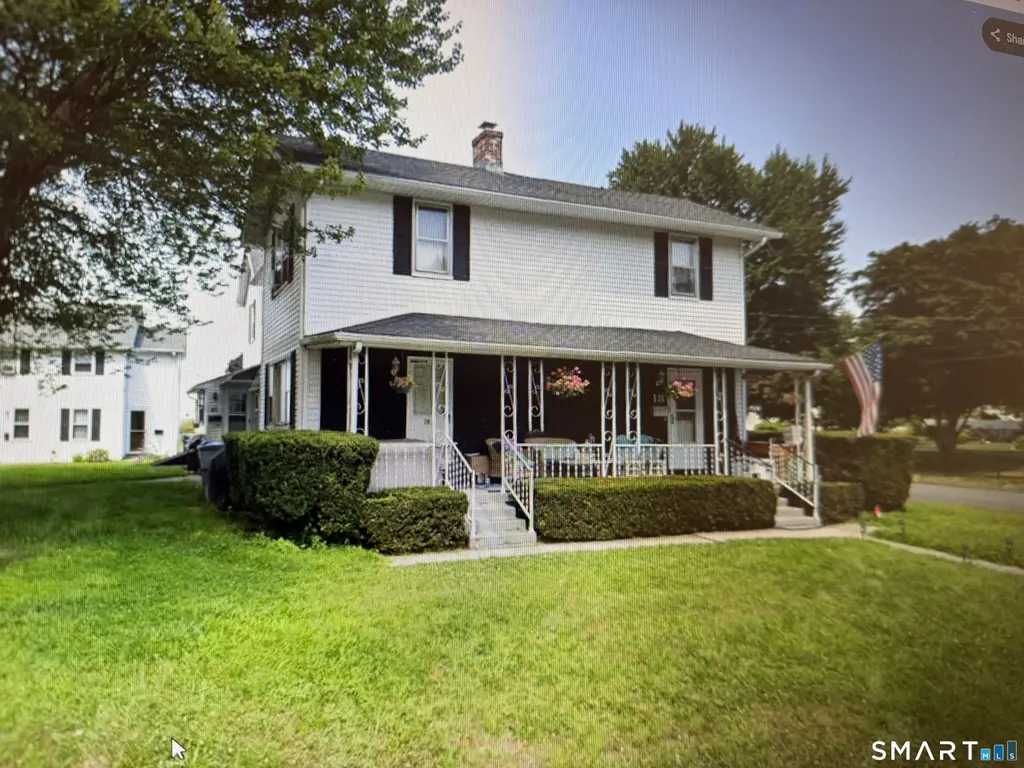
20 Manning Rd · Longmeadow, MA
Flood risk 1/10 · Minimal
- FEMA flood zone
- X (unshaded)
- Chance of flooding over 30 yrs
- 0.0%
- Est. flood insurance / yr
- $473 – $860
Fire risk 1/10 · Minimal
- Est. fire insurance / yr
- $829 – $1,539
Heat risk 4/10 · Minor
- Hot days now (above 98°F)
- 7 days/yr
- Hot days in 30 yrs
- 15 days/yr
Wind risk 6/10 · Moderate
- Chance of severe wind over 30 yrs
- 27.0%
Air-quality risk 3/10 · Minor
- Unhealthy air days now
- 2 days/yr
- Unhealthy air days in 30 yrs
- 3 days/yr
Risk factors via First Street. Map © Google.
Why this score? — see what drove the B- grade
The composite is a weighted blend of 9 inputs, each scored 0–100. Each bar is that input's sub-score; the figure is the points it added to the 100-point composite (weight × sub-score).
- Cash flow +27.0/30.0
- DSCR +9.3/10.0
- 1% rule +7.3/10.0
- ARV discount +7.1/15.0
- Livability +4.0/5.0
- Condition / age +3.8/5.0
- Rent growth +3.5/5.0
- Schools +3.0/10.0
- Appreciation +0.0/10.0
$409,000
🖨 Deal sheet 📄 Offer letter ✓ Due diligence
Multi-family units
County records classify this as Multi-Family (2-4 Unit). Listing-text estimate: 2 units. confirmed
Listing remarks MLS
ATTENTION INVESTORS. Fantastic two-family property! Desirable corner lot in quiet area of Enfield. Strong Rental Income. Nice reliable long-term tenants. Two side-by-side units, both have their own access to the basement. The left unit features six rooms, updated kitchen and bathrooms, 4-bedroom 2-bathrooms, wide open first floor layout, living room with Fireplace. See photos. The right side has 3 bedrooms and 1 bath. At the request of the tenant to protect their privacy, there are no interior photos of this side. Each unit has good-sized bedrooms. Both tenants have occupied their side for over 5 years, each unit has a long-term lease ending on March 31, 2027. 4-Car parking spots. Excellent Location Close to Downtown, Restaurants, Shopping, Costco, Fitness Centers, Parks, Bus Line, And Easy Highway Access To I-91. Diamond in the rough, rare opportunity. This Don't Last Long. Sold As-Is Please respect the tenants privacy and schedule an appointment.
Key facts
- Updated bathrooms
- Updated kitchen
- Good-sized bedrooms
Tags
Neighborhood map
What this means for you Summary
Snapshot
- This is a 1×4bd/1.5ba + 1×3bd/1ba units multifamily listed at $409k. Condition is rated good.
Deal economics
- At list price, monthly cash flow is $1k ($14k/yr) — positive. Per door: $573/mo.
- The deal already cash-flows at list — no discount required.
- Meets the 1% rule at list price ($5k rent vs $409k).
- Recommended offer: $360k (12.0% below list) — sets the bar for market timing.
- Cap rate 9.7% vs local median 3.6% in Longmeadow — top-decile yield for the area; either an underpriced asset or a hidden risk that comps aren't pricing in. Stress-test before assuming the spread holds.
Location & tenants
- Location reads 80/100 on livability (#38 in MA, #1,837 nationally) — a professional / high-income tenant draw. Strengths: schools A+, crime A+, commute A+; Watch: amenities F, cost of living F.
- Enfield School District (suburban): math 25% / reading 41% proficiency, ranked #114 of 153 in CT (top 74%) — families likely to look elsewhere, expect single-tenant / working-renter base with shorter leases.
- Market conditions: Rents rising (+3.9%/yr); solid renter incomes; 1,867 units permitted in Capitol Planning Region in 2024 (1,399 in 5+ unit buildings).
- At $5,029/mo this rent would consume 67% of the median local household income ($90k/yr) (locally 954% of renters already pay >50% of income on rent) — very limited rent-growth headroom before tenants either downsize or default.
Forward outlook
- Local home prices are declining (-3.0%/yr); year-one equity from $3k of loan paydown is wiped out by about $12k of value loss. Plan a longer hold.
- At projected returns (-3.0% appreciation + 3.9% rent growth), your $115k cash investment doubles in ~9 years — after that, you're playing with house money.
Negotiation context
- It's been on market 225 days — a 12% lower offer ($360k) is reasonable based on typical stale-listing flexibility.
Risks & watch-outs
- Watch-outs: built in 1955 — expect roof / HVAC / electrical / plumbing capex.
- Climate carrying-cost: major wind risk, 27% chance of damaging wind over 30y — expect insurance premiums to compound above CPI over the hold.
Questions for the listing agent
- It's been on market 225 days. Have you received any prior offers? Is the seller open to a 12% concession, seller financing, or rate buy-down credit?
- Can we see the unit-by-unit rent roll, current vacancy, and any below-market leases? What's the average tenancy length?
- What capital expenditures (roof, boiler, parking lot, exteriors) have been made in the last 5 years, and what's planned in the next 2?
- Built in 1955 — when were the roof, HVAC, electrical panel, plumbing, and water heater last replaced?
- Why hasn't it sold? Are there any deal-killer items the seller is aware of (foundation, flood, title, zoning, code violations)?
- Is there a deadline driving the sale (1031 exchange, divorce, estate, relocation)? That informs how much negotiation room exists.
- Schools are A-rated — typically a magnet for longer-tenancy family renters. What's the average tenant stay here, and is there a school-zone premium baked into asking?
- What's the average days-on-market for RENTAL listings here right now (not sales)? A rising rental-DOM trend means longer vacancies and softer asking-rent achievability than the comps imply.
- What's the recent tenant-quality profile in this submarket — average credit score on applications, eviction rate, late-payment / NSF rate, and stable-employment percentage? A property-management company in the area should have these aggregated.
- How much new apartment / multifamily construction is in the pipeline within 1–3 miles? Heavy new supply (>2% of stock underway) typically softens rents 12–24 months out; light construction supports rent growth.
Investment metrics
- 1% rule
- 1.23% ✓
- Cap rate
- 9.66%
- Cash-on-cash
- 12.01%
- DSCR
- 1.53
- GRM
- 6.8
CMA / ARV
- ARV (median comp)
- $405,278
- List price
- $409,000
- Delta
- 0.92%
- Verdict
- FAIR
- Comps
- 20 within 1.0 mi
Projected returns pro-forma
-3.0% appreciation · 3.9% rent growth · sell at horizon
- IRR
- 2.6%
- Equity multiple
- 1.10×
- Total profit
- $11,410
- Equity at exit
- $60,983
- IRR
- 13.0%
- Equity multiple
- 2.08×
- Total profit
- $123,465
- Equity at exit
- $35,363
Cash invested: $114,520 (down + closing). Projections, not guarantees.
Landlord ↔ Tenant lean methodology
- Overall (STATE)
- 20 Strongly Tenant-Friendly
- State Massachusetts
- 20 Strongly Tenant-Friendly · D+15
- County
- — inherits STATE
- City
- — inherits STATE
ZIP-level market 06082
- Rents YoY
- 3.9%
- Price-to-rent
- 13.0×
Monthly cashflow live
- Estimated rent
- $5,029 high interval (Pro) →
- Mortgage (P&I)
- −$2,145
- Tax est. 1.5%
- −$511 /mo · $6,135/yr
- Insurance
- −$170
- HOA
- −$0
- Vacancy / Maint / Mgmt
- −$1,056
- Net cashflow
- $1,146
Break-even live
2-unit breakdown (identical units grouped — click to expand)
| Units | Beds | Baths | Est. rent |
|---|---|---|---|
| 1× unit | 4 | 1.5 | $2,614 |
| 1× unit | 3 | 1 | $2,415 |
| Total (2 units) | $5,029 | ||
UW: 25.0% down · 7.5% · 30yr · 1.5% tax · 5.0% vac · 8.0% maint · 8.0% mgmt
Financing live
Cash to close
- Down payment
- $102,250
- Closing costs
- $12,270
- Reserves months
- —
- Total cash needed
- —
Loan-product check · same deal, 3 products live
Conventional
25% down · 7.5% · 30yr
- Down + closing
- —
- Monthly P&I
- —
- Monthly cashflow
- —
- DSCR
- —
- Eligible?
- —
Personal DTI + credit; lowest rate.
DSCR
20% down · 8.5% · 30yr
- Down + closing
- —
- Monthly P&I
- —
- Monthly cashflow
- —
- DSCR
- —
- Eligible?
- —
No personal income docs; deal must DSCR.
Hard money
10% down · 12.0% · 12mo
- Down + closing
- —
- Monthly P&I
- —
- Monthly cashflow
- —
- DSCR
- —
- Eligible?
- —
Short-term bridge; refi at stabilization.
Listing history 16 events
-
2026-06-18days on market $409,000 Active 225 DOM
-
2026-06-17days on market $409,000 Active 224 DOM
-
2026-06-16days on market $409,000 Active 223 DOM
-
2026-06-15days on market $409,000 Active 222 DOM
-
2026-06-13days on market $409,000 Active 220 DOM
-
2026-06-10days on market $409,000 Active 217 DOM
-
2026-06-09days on market $409,000 Active 216 DOM
-
2026-06-08days on market $409,000 Active 215 DOM
-
2026-06-07days on market $409,000 Active 214 DOM
-
2026-06-05days on market $409,000 Active 211 DOM
-
2026-06-03days on market $409,000 Active 210 DOM
-
2026-06-02days on market $409,000 Active 209 DOM
-
2026-06-01days on market $409,000 Active 208 DOM
-
2026-05-31days on market $409,000 Active 207 DOM
-
2026-04-01price $409,000 962-char remark
Show marketing remark (962 chars)
ATTENTION INVESTORS. Fantastic two-family property! Desirable corner lot in quiet area of Enfield. Strong Rental Income. Nice reliable long-term tenants. Two side-by-side units, both have their own access to the basement. The left unit features six rooms, updated kitchen and bathrooms, 4-bedroom 2-bathrooms, wide open first floor layout, living room with Fireplace. See photos. The right side has 3 bedrooms and 1 bath. At the request of the tenant to protect their privacy, there are no interior photos of this side. Each unit has good-sized bedrooms. Both tenants have occupied their side for over 5 years, each unit has a long-term lease ending on March 31, 2027. 4-Car parking spots. Excellent Location Close to Downtown, Restaurants, Shopping, Costco, Fitness Centers, Parks, Bus Line, And Easy Highway Access To I-91. Diamond in the rough, rare opportunity. This Don't Last Long. Sold As-Is Please respect the tenants privacy and schedule an appointment.
-
2025-11-05$450,000 Active 962-char remark
Show marketing remark (962 chars)
ATTENTION INVESTORS. Fantastic two-family property! Desirable corner lot in quiet area of Enfield. Strong Rental Income. Nice reliable long-term tenants. Two side-by-side units, both have their own access to the basement. The left unit features six rooms, updated kitchen and bathrooms, 4-bedroom 2-bathrooms, wide open first floor layout, living room with Fireplace. See photos. The right side has 3 bedrooms and 1 bath. At the request of the tenant to protect their privacy, there are no interior photos of this side. Each unit has good-sized bedrooms. Both tenants have occupied their side for over 5 years, each unit has a long-term lease ending on March 31, 2027. 4-Car parking spots. Excellent Location Close to Downtown, Restaurants, Shopping, Costco, Fitness Centers, Parks, Bus Line, And Easy Highway Access To I-91. Diamond in the rough, rare opportunity. This Don't Last Long. Sold As-Is Please respect the tenants privacy and schedule an appointment.
ⓘ Source: listings_history table (triggers on properties + properties_extension) + one-shot
backfill from property_details.listing_events for pre-trigger history.
Climate risk First Street
- Flood 1/10 Low FEMA zone X (unshaded) · 0% chance over 30 yrs
- Wildfire 1/10 Low
- Heat 4/10 Moderate 7 d/yr ≥98°F today · 15 d/yr by 30 yrs out
- Wind 6/10 Major 27% chance of damaging wind over 30 yrs
- Air quality 3/10 Moderate 2 unhealthy d/yr today · 3 by 30 yrs out
Nearby sold comps map
Loading sold comps map…
Walkable amenities ~0.75 mi
Loading nearby amenities…
Taxation est. · year 1
- Rental income
- $60,348
- − Mortgage interest
- −$22,910
- − Property taxes
- −$6,135
- − Insurance
- −$2,045
- − Repairs & maintenance
- −$4,828
- − Management
- −$4,828
- − Depreciation
- −$11,898
- Taxable income
- $7,704
- Est. tax owed @ 24.0%
- −$1,849
- After-tax cash flow
- $11,908/yr
For passive investors: Depreciation is non-cash, so a rental often shows a tax loss while cash-flowing — sheltering income. Rental losses are passive: they offset passive income freely, and up to $25,000/yr can offset ordinary (W-2) income if you actively participate and your MAGI is under $100k (phasing out to $0 by $150k); unused losses carry forward. On sale, claimed depreciation is recaptured at up to 25%, and gains may owe capital-gains tax (a 1031 exchange can defer both). Figures are a year-1 estimate at your 24.0% rate — not tax advice; consult a CPA.
Condition & rehab AI · 12 photos
A well-maintained two-family home with updated kitchens and bathrooms, located in a quiet area with good rental income potential.
Value-add opportunities
- Both Paint exterior — Enhances curb appeal and value
- Both Replace gutters — Improves drainage and aesthetics
- Both Update flooring in bedrooms — Modernizes spaces and increases value
- Both Update bathrooms — Modernizes spaces and increases value
Renovation cost estimate screening
Value-add ROI direction
- Both Paint exterior — Enhances curb appeal and value ↑
- Both Replace gutters — Improves drainage and aesthetics ↑
- Both Update flooring in bedrooms — Modernizes spaces and increases value ↑
- Both Update bathrooms — Modernizes spaces and increases value ↑
ⓘ Cost ranges are severity-bucket heuristics (US national rule-of-thumb). Get contractor quotes + a written scope before underwriting a rehab budget.
Schools (NCES district)
- District
- Enfield School District
- NCES district ID
- 0901470
- Math proficiency
- 25% ▼ -14.00%
- Reading proficiency
- 41% ▼ -10.00%
- Median HH income
- $68,750
- Composite
- 30.42/100
- National rank
- #6238
- State rank
- #114 of 153 in CT
Livability — Longmeadow
- Score
- 80/100
- State rank
- #38
- US rank
- #1837
Category grades
Schools grade is shown separately in the Schools card above.
Census & demographics
- County
- Hartford County
- City population
- 15,961
- Metro
- Hartford-East Hartford-Middletown, CT
- Population (ZIP)
- 41,090
- Household income
- $90,404
- Rent vs Own
- Severe rent burden
- 954.0
Population outlook (Capitol County) Hauer SSP2
- By 2040
- 1,063,519
Race, ethnicity, and origin ACS 2023
- Neighborhood character
- Predominantly White (76%)
- Race & ethnicity
- White 76% Hispanic / Latino 11% Two or more races 9% Black 5% Asian 2%
- Hispanic origin (detail)
- Mexican 1% Puerto Rican 7%
- Common ancestry
- Romanian 10% Lithuanian 9% Slovak 2%
- Foreign-born
- 6% · Canada, Jamaica
- Languages at home
- 89% English-only · Spanish 5% Other Indo-European 2% Russian/Polish/Slavic 1%
Political lean MEDSL · Capitol
- 2024 margin
- Strong D (+21.9) · D 60.1% · R 38.2% · Other 1.7%
- All cycles
- 2024: D+21.9
Not yet ingested
- Civics
- —
Market trends
- HPI YoY
- ▼ -494.72%
- Current HPI
- 192.4011
- Rent YoY
- ▲ 3.90%
- Metro
- Hartford-East Hartford-Middletown, CT
- State GDP YoY
- ▲ 2.28%
- F500 in state
- 38
Industry mix (Fortune 500 HQ in MA)
| Industry | F500 HQs | Revenue |
|---|---|---|
| Technology | 3 | $17B |
|
||
| Insurance | 2 | $84B |
|
||
| Retail | 2 | $76B |
|
||
| Life Sciences | 1 | $43B |
|
||
| Energy Technology | 1 | $31B |
|
||
| Aerospace / Defense | 1 | $18B |
|
||
Price history
-9.1% since first listed2 events — show timeline
- 2026-04-01 Price Changed $409,000 Smart MLS
- 2025-11-05 Listed $450,000 Smart MLS
Cash-flow waterfall
monthlySold comps — $/sqft
last 12 mo · ≤1 miLoading sold comps…