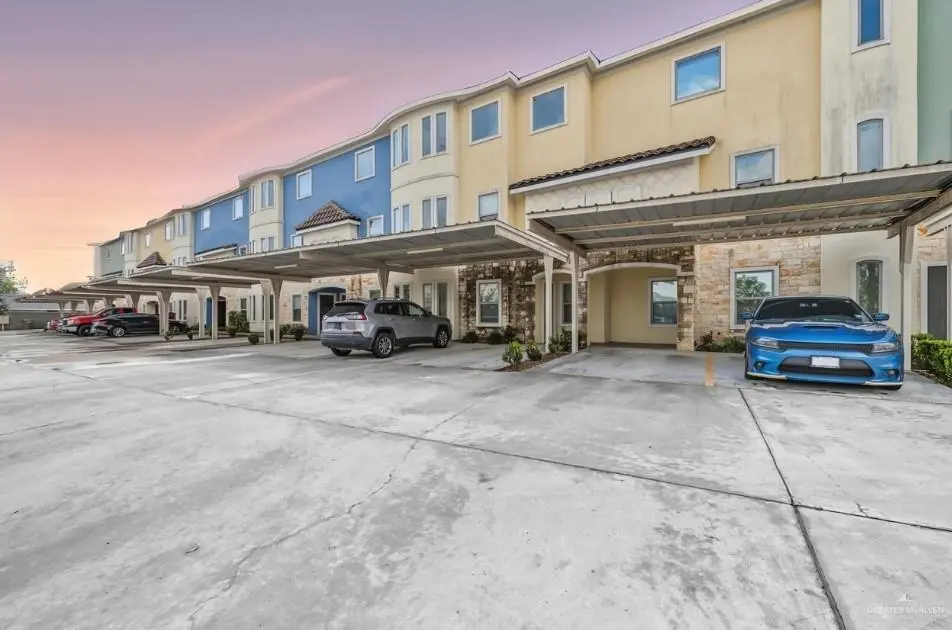
3302 S Sugar Rd Unit J · Edinburg, TX
Flood risk 7/10 · Major
- FEMA flood zone
- —
- Chance of flooding over 30 yrs
- 0.99%
- Est. flood insurance / yr
- —
Fire risk 2/10 · Minimal
- Est. fire insurance / yr
- $1,222 – $2,270
Heat risk 9/10 · Severe
- Hot days now (above 111°F)
- 7 days/yr
- Hot days in 30 yrs
- 23 days/yr
Wind risk 8/10 · Major
- Chance of severe wind over 30 yrs
- 99.0%
Air-quality risk 2/10 · Minimal
- Unhealthy air days now
- 0 days/yr
- Unhealthy air days in 30 yrs
- 1 days/yr
Risk factors via First Street. Map © Google.
Why this score? — see what drove the C- grade
The composite is a weighted blend of 9 inputs, each scored 0–100. Each bar is that input's sub-score; the figure is the points it added to the 100-point composite (weight × sub-score).
- Cash flow +15.6/30.0
- ARV discount +13.7/15.0
- DSCR +4.8/10.0
- 1% rule +4.4/10.0
- Condition / age +4.0/5.0
- Livability +3.2/5.0
- Rent growth +2.4/5.0
- Schools +2.2/10.0
- Appreciation +0.0/10.0
$211,000
🖨 Deal sheet 📄 Offer letter ✓ Due diligence
Listing remarks MLS
Incredible value in Gated Community close to UTRGV and major hospitals! Step inside this stunning three-story townhome featuring 3 bedrooms, 2 full baths, and 2 half baths in the highly sought-after South Edinburg area. The main level is perfect for entertaining, with a spacious living room and kitchen, plus a convenient half bath and laundry room. Upstairs, you'll find two generous bedrooms, each with its own full bath and ample closet space. The third floor is your private retreat, featuring a versatile bonus room (office), an additional half bath, and a balcony—perfect for enjoying your morning coffee or relaxing outdoors. Step outside to your private, fenced backyard with direct access from the kitchen—a great spot for barbecues, gardening, or simply unwinding in your own space. This townhome combines style, comfort, and functionality in a convenient location—ready for you to move in and make it home!
Key facts
- Laundry room
- Convenient half bath
- Versatile bonus room
Tags
Neighborhood map
What this means for you Summary
Snapshot
- This is a 3-bed/3.0-bath single-family listed at $211k. Condition is rated good.
Deal economics
- At list price, monthly cash flow is $89 ($1k/yr) — positive.
- The deal already cash-flows at list — no discount required.
- To meet the 1% rule (rent ≥ 1% of price), the offer needs to be $199k (5.7% below list).
- Recommended offer: $186k (12.0% below list) — sets the bar for market timing.
- Cap rate 6.8% vs local median 2.4% in Edinburg — top-decile yield for the area; either an underpriced asset or a hidden risk that comps aren't pricing in. Stress-test before assuming the spread holds.
Location & tenants
- Location reads 64/100 on livability (#784 in TX) — a middle-class / working-renter tenant base. Strengths: cost of living A+, housing A+; Watch: schools D+, employment D, amenities F.
- Edinburg CISD (urban): math 20% / reading 34% proficiency, ranked #699 of 826 in TX (top 85%) — low school quality limits family demand, transient renter base, plan for 1-2y turnover; 62% free/reduced lunch — lower-income household profile, screen leases tightly.
- Market conditions: Rents soft (-0.5%/yr); 406 active listings in the ZIP; 17 comparable units currently listed for rent nearby; rentals lingering (median 44d on market — plan ~5-8 weeks vacancy on turnover, expect pricing pressure); 71% of comp listings sitting > 30 days — soft ceiling on asking rent; 7,378 units permitted in Hidalgo County in 2024 (641 in 5+ unit buildings).
- This rent runs 36% of the median local income ($67k/yr) — at the standard rent-burdened threshold; future hikes will face affordability resistance.
Forward outlook
- Local home prices are declining (-3.0%/yr); year-one equity from $1k of loan paydown is wiped out by about $6k of value loss. Plan a longer hold.
- Hidalgo County population projected at +28% by 2050 — long-run rental-demand tailwind backs the buy-and-hold thesis.
Negotiation context
- It's been on market 134 days — a 12% lower offer ($186k) is reasonable based on typical stale-listing flexibility.
- 9 sale attempts since 7y ago; this cycle's ask is 13513% above the opening price — seller raised mid-cycle; expect resistance to lowballs.
Risks & watch-outs
- Climate carrying-cost: major flood risk; severe wind risk, 99% chance of damaging wind over 30y; extreme-heat days projected 7→23/yr by 2055 (HVAC capex compounding) — expect insurance premiums to compound above CPI over the hold.
Questions for the listing agent
- It's been on market 134 days. Have you received any prior offers? Is the seller open to a 12% concession, seller financing, or rate buy-down credit?
- What does the HOA fee cover, when was the last increase, and are there any pending special assessments or reserve-fund shortfalls?
- Why hasn't it sold? Are there any deal-killer items the seller is aware of (foundation, flood, title, zoning, code violations)?
- Is there a deadline driving the sale (1031 exchange, divorce, estate, relocation)? That informs how much negotiation room exists.
- Schools are D-rated, which usually means shorter tenancies and higher turnover. Who's the typical renter profile here, and what's been the actual vacancy rate?
- What's the average days-on-market for RENTAL listings here right now (not sales)? A rising rental-DOM trend means longer vacancies and softer asking-rent achievability than the comps imply.
- What's the recent tenant-quality profile in this submarket — average credit score on applications, eviction rate, late-payment / NSF rate, and stable-employment percentage? A property-management company in the area should have these aggregated.
- How much new for-sale + rental construction is in the pipeline within 1–3 miles? Heavy new supply typically softens prices + rents 12–24 months out; constrained supply supports both.
Investment metrics
- 1% rule
- 0.94% ✗
- Cap rate
- 6.80%
- Cash-on-cash
- 1.81%
- DSCR
- 1.08
- GRM
- 8.8
CMA / ARV
- ARV (median comp)
- $244,992
- List price
- $211,000
- Delta
- -13.87%
- Verdict
- UNDERPRICED
- Comps
- 20 within 1.0 mi
Show comp detail 12 sales within ~0.75 mi
| Address | Dist | Beds/Ba | Sqft | Sold | Price | $/sf | Match |
|---|---|---|---|---|---|---|---|
| 1604 St Claire Ave | 0.14mi | 3/2.5 | 2,019 (+11%) | 2mo | $349,000 | $173 | 72 |
| 1702 Kayla Ave | 0.41mi | 3/2.5 | 1,847 (+2%) | 9mo | $259,900 | $141 | 69 |
| 332 Roundup Cir | 0.58mi | 3/2.5 | 1,928 (+6%) | 0mo | $230,000 | $119 | 60 |
| 3102 Vera Ave | 0.48mi | 3/2.0 | 1,907 (+5%) | 6mo | $285,000 | $149 | 60 |
| 1719 Kayla Ave | 0.45mi | 3/2.0 | 1,912 (+5%) | 7mo | $264,950 | $139 | 60 |
| 432 Telfair Ave | 0.71mi | 3/2.5 | 1,726 (-5%) | 1mo | $310,000 | $180 | 56 |
| 3204 Sierra Cir | 0.17mi | 4/3.0 (+1) | 1,586 (-13%) | 13mo | $165,000 | $104 | 55 |
| 2008 Beatrice Ave | 0.63mi | 3/2.0 | 1,716 (-6%) | 5mo | $255,000 | $149 | 53 |
| 316 Kika De La Garza St | 0.71mi | 3/3.0 | 1,704 (-6%) | 4mo | $275,000 | $161 | 53 |
| 1918 Linsay Blvd | 0.57mi | 3/2.0 | 1,716 (-6%) | 9mo | $250,000 | $146 | 53 |
| 3503 Alvarado St | 0.52mi | 3/2.0 | 1,551 (-14%) | 4mo | $269,000 | $173 | 44 |
| 327 Kika De La Garza St | 0.67mi | 4/3.0 (+1) | 1,692 (-7%) | 11mo | $239,000 | $141 | 44 |
Match score weights: distance 35% · size 25% · config 20% · recency 20%. Top-matched comps best support the ARV.
Projected returns pro-forma
-3.0% appreciation · 0.0% rent growth · sell at horizon
- IRR
- -16.9%
- Equity multiple
- 0.42×
- Total profit
- $-34,306
- Equity at exit
- $31,461
- IRR
- -15.7%
- Equity multiple
- 0.24×
- Total profit
- $-44,924
- Equity at exit
- $18,243
Cash invested: $59,080 (down + closing). Projections, not guarantees.
Landlord ↔ Tenant lean methodology
- Overall (STATE)
- 87 Strongly Landlord-Friendly
- State Texas
- 87 Strongly Landlord-Friendly · R+5
- County
- — inherits STATE
- City
- — inherits STATE
ZIP-level market 78539
- Home prices YoY
- -19.6%
- Rents YoY
- -0.5%
- Active inventory
- 406
- Price-to-rent
- 8.8×
Monthly cashflow live
- Estimated rent
- $1,990 high interval (Pro) →
- Mortgage (P&I)
- −$1,107
- Tax est. 1.5%
- −$264 /mo · $3,165/yr
- Insurance
- −$88
- HOA
- −$25
- Vacancy / Maint / Mgmt
- −$418
- Net cashflow
- $89
Break-even live
UW: 25.0% down · 7.5% · 30yr · 1.5% tax · 5.0% vac · 8.0% maint · 8.0% mgmt
Financing live
Cash to close
- Down payment
- $52,750
- Closing costs
- $6,330
- Reserves months
- —
- Total cash needed
- —
Loan-product check · same deal, 3 products live
Conventional
25% down · 7.5% · 30yr
- Down + closing
- —
- Monthly P&I
- —
- Monthly cashflow
- —
- DSCR
- —
- Eligible?
- —
Personal DTI + credit; lowest rate.
DSCR
20% down · 8.5% · 30yr
- Down + closing
- —
- Monthly P&I
- —
- Monthly cashflow
- —
- DSCR
- —
- Eligible?
- —
No personal income docs; deal must DSCR.
Hard money
10% down · 12.0% · 12mo
- Down + closing
- —
- Monthly P&I
- —
- Monthly cashflow
- —
- DSCR
- —
- Eligible?
- —
Short-term bridge; refi at stabilization.
Rent comps 17 comps
| Address | Beds | Baths | Sqft | Rent | $/sqft | DOM | Units | Dist |
|---|---|---|---|---|---|---|---|---|
| 1612 Red River Ave Edinburg, TX | 4.0 | 4.0 | 2494 | $3,275 | $1.31 | 43d | 1 | 0.11mi |
| 1328 Nora Dr Edinburg, TX | 3.0 | 2.0 | 1305 | $1,900 | $1.46 | 43d | 1 | 0.18mi |
| 1400 Wisconsin Rd Unit 2 Edinburg, TX | 2.0 | 2.5 | 1400 | $1,300 | $0.93 | 43d | 1 | 0.19mi |
| 3118 Vera Ave Edinburg, TX | 3.0 | 2.0 | 1553 | $1,800 | $1.16 | 43d | 1 | 0.50mi |
| 3719 Alvarado St Edinburg, TX | 3.0 | 2.5 | 1543 | $2,095 | $1.36 | 43d | 1 | 0.62mi |
| 323 Cavazos St Edinburg, TX | 3.0 | 2.5 | 2223 | $1,700 | $0.76 | 43d | 1 | 0.66mi |
| 2714 Blue Ridge Dr Edinburg, TX | 3.0 | 2.0 | 1966 | $1,750 | $0.89 | 14d | 1 | 0.73mi |
| 2401 W Rhin Dr Edinburg, TX | 4.0 | 2.5 | 2301 | $2,400 | $1.04 | 14d | 1 | 0.81mi |
| 240 Austin Blvd Edinburg, TX | 2.0 | 2.0 | 2279 | $2,200 | $0.97 | 43d | 1 | 1.04mi |
| 2501 Camino Real Viejo Mercedes, TX | 4.0 | 2.0 | 2048 | $1,400 | $0.68 | 43d | 1 | 1.06mi |
| 4809 S Markland Ave Edinburg, TX | 3.0 | 2.0 | 1663 | $2,550 | $1.53 | 23d | 1 | 1.12mi |
| 5018 S Hummer Ln Edinburg, TX | 3.0 | 2.0 | 1926 | $1,800 | $0.93 | 23d | 1 | 1.19mi |
| 5211 Shalom Dr Edinburg, TX | 3.0 | 2.0 | 2305 | $2,200 | $0.95 | 43d | 1 | 1.30mi |
| 2012 Pin Oak Rd Edinburg, TX | 3.0 | 2.0 | 1300 | $1,600 | $1.23 | 43d | 1 | 1.45mi |
| 3421 S Kerala Ave Unit D Edinburg, TX | 3.0 | 2.5 | 1700 | $1,900 | $1.12 | 14d | 1 | 1.46mi |
| 3421 S Kerala Ave Unit D Edinburg, TX | 3.0 | 2.5 | 1700 | $1,850 | $1.09 | 43d | 1 | 1.46mi |
| 902 Hidden Forest Dr Edinburg, TX | 3.0 | 2.0 | 1764 | $1,800 | $1.02 | 43d | 1 | 1.49mi |
HOA detail
- Monthly dues
- $25 · $300/yr
- Likely covers
- security
Listing history 27 events
-
2026-06-10days on market $211,000 Active 134 DOM
-
2026-06-09days on market $211,000 Active 133 DOM
-
2026-06-08days on market $211,000 Active 132 DOM
-
2026-06-07days on market $211,000 Active 131 DOM
-
2026-06-03days on market $211,000 Active 127 DOM
-
2026-06-02days on market $211,000 Active 126 DOM
-
2026-06-01days on market $211,000 Active 125 DOM
-
2026-05-31days on market $211,000 Active 124 DOM
-
2026-05-31days on market $211,000 Active 123 DOM
-
2026-05-09$1,550
-
2026-05-09historical $1,550
-
2026-05-08$1,550
-
2026-01-28$211,000 Active 936-char remark
Show marketing remark (936 chars)
Incredible value in Gated Community close to UTRGV and major hospitals! Step inside this stunning three-story townhome featuring 3 bedrooms, 2 full baths, and 2 half baths in the highly sought-after South Edinburg area. The main level is perfect for entertaining, with a spacious living room and kitchen, plus a convenient half bath and laundry room. Upstairs, you'll find two generous bedrooms, each with its own full bath and ample closet space. The third floor is your private retreat, featuring a versatile bonus room (office), an additional half bath, and a balcony—perfect for enjoying your morning coffee or relaxing outdoors. Step outside to your private, fenced backyard with direct access from the kitchen—a great spot for barbecues, gardening, or simply unwinding in your own space. This townhome combines style, comfort, and functionality in a convenient location—ready for you to move in and make it home!
-
2024-09-04historical $1,550
-
2024-08-30historical $1,550
-
2024-08-30historical $1,550
-
2024-08-22$1,550
-
2024-08-15$1,550
-
2024-07-26$1,550
-
2024-07-26historical $1,550
-
2024-07-24$1,550
-
2019-10-20historical Withdrawn
-
2019-10-13price $169,000
-
2019-09-14$176,000 Active
-
2019-08-31historical Expired
-
2019-07-11price $176,000
-
2019-04-09$182,000 Active
ⓘ Source: listings_history table (triggers on properties + properties_extension) + one-shot
backfill from property_details.listing_events for pre-trigger history.
Climate risk First Street
- Flood 7/10 Severe 99% chance over 30 yrs
- Wildfire 2/10 Low
- Heat 9/10 Extreme 7 d/yr ≥111°F today · 23 d/yr by 30 yrs out
- Wind 8/10 Severe 99% chance of damaging wind over 30 yrs
- Air quality 2/10 Low 0 unhealthy d/yr today · 1 by 30 yrs out
Nearby sold comps map
Loading sold comps map…
Walkable amenities ~0.75 mi
Loading nearby amenities…
Taxation est. · year 1
- Rental income
- $23,882
- − Mortgage interest
- −$11,819
- − Property taxes
- −$3,165
- − Insurance
- −$1,055
- − Repairs & maintenance
- −$1,911
- − Management
- −$1,911
- − HOA
- −$300
- − Depreciation
- −$6,138
- Taxable loss
- −$2,417
- Est. tax savings @ 24.0%
- +$580
- After-tax cash flow
- $1,649/yr
For passive investors: Depreciation is non-cash, so a rental often shows a tax loss while cash-flowing — sheltering income. Rental losses are passive: they offset passive income freely, and up to $25,000/yr can offset ordinary (W-2) income if you actively participate and your MAGI is under $100k (phasing out to $0 by $150k); unused losses carry forward. On sale, claimed depreciation is recaptured at up to 25%, and gains may owe capital-gains tax (a 1031 exchange can defer both). Figures are a year-1 estimate at your 24.0% rate — not tax advice; consult a CPA.
Condition & rehab AI · 12 photos
This well-maintained, modern townhome in a gated community offers a great value with minimal repairs and updates needed.
Value-add opportunities
- Both landscaping — enhances curb appeal and adds value
- Both furniture — improves living space and aesthetics
- Both smart home integration — increases convenience and marketability
Renovation cost estimate screening
Value-add ROI direction
- Both landscaping — enhances curb appeal and adds value ↑
- Both furniture — improves living space and aesthetics ↑
- Both smart home integration — increases convenience and marketability ↑
ⓘ Cost ranges are severity-bucket heuristics (US national rule-of-thumb). Get contractor quotes + a written scope before underwriting a rehab budget.
Schools (NCES district)
- District
- Edinburg CISD
- NCES district ID
- 4818180
- Math proficiency
- 20% ▼ -34.00%
- Reading proficiency
- 34% ▼ -11.00%
- Median HH income
- $36,985
- Composite
- 22.42/100
- National rank
- #8114
- State rank
- #699 of 826 in TX
Livability — Edinburg
- Score
- 64/100
- State rank
- #784
- US rank
- #14319
Category grades
Schools grade is shown separately in the Schools card above.
Census & demographics
- Census place
- Edinburg, TX
- County
- Hidalgo County · 623,128 people
- City population
- 178,279
- Metro
- McAllen-Edinburg-Mission, TX
- Population (ZIP)
- 37,168
- Household income
- $66,967
- Rent vs Own
- Severe rent burden
- 1525.0
Population outlook (Hidalgo County) Hauer SSP2
- Today (2025)
- 955,232 people
- By 2030
- 1,009,774 · +5.7%
- By 2040
- 1,120,332 · +17.3%
- By 2050
- 1,225,036 · +28.2%
- By 2075
- 1,439,189 · +50.7%
- By 2100
- 1,533,429 · +60.5%
Race, ethnicity, and origin ACS 2023
- Neighborhood character
- Predominantly Hispanic (85%)
- Race & ethnicity
- Hispanic / Latino 85% Two or more races 45% White 10% Asian 4%
- Hispanic origin (detail)
- Mexican 77% Puerto Rican 1%
- Common ancestry
- Lithuanian 1% Italian 1% Romanian 1%
- Foreign-born
- 19% · Canada
- Languages at home
- 32% English-only · Spanish 64% Tagalog/Filipino 2% Other Asian/Pacific 1%
Political lean MEDSL · Hidalgo
- 2024 margin
- Toss-up / Even · D 48.1% · R 51.0%
- 2008→2024 swing
- -41.6pp toward R · 2008: 38.7pp · 2024: -2.9pp
- All cycles
- 2024: R+2.9 2020: D+17.1 2016: D+40.5 2012: D+41.8 2008: D+38.7
Not yet ingested
- Civics
- —
Market trends
- HPI YoY
- ▼ -51.52%
- Current HPI
- 211.4723
- Rent YoY
- ▼ -0.52%
- Metro
- McAllen-Edinburg-Mission, TX
- State GDP YoY
- ▲ 3.95%
- F500 in state
- 110
Industry mix (Fortune 500 HQ in TX)
| Industry | F500 HQs | Revenue |
|---|---|---|
| Energy | 16 | $1,198B |
|
||
| Technology | 5 | $198B |
|
||
| Engineering / Construction | 4 | $72B |
|
||
| Energy Services | 3 | $60B |
|
||
| Utilities | 3 | $41B |
|
||
| Healthcare | 2 | $330B |
|
||
Price history
-99.1% since first listed18 events — show timeline
- 2026-05-09 Listed for Rent $1,550 MCALLENMLS
- 2026-05-09 Rental Removed $1,550 RENTEC
- 2026-05-08 Listed for Rent $1,550 RENTEC
- 2026-01-28 Listed $211,000 MCALLENMLS
- 2024-09-04 Rental Removed $1,550 MCALLENMLS
- 2024-08-30 Rental Removed $1,550 SHOWMOJO
- 2024-08-30 Rental Removed $1,550 RENTEC
- 2024-08-22 Listed for Rent $1,550 RENTEC
- 2024-08-15 Listed for Rent $1,550 MCALLENMLS
- 2024-07-26 Listed for Rent $1,550 SHOWMOJO
- 2024-07-26 Rental Removed $1,550 RENTEC
- 2024-07-24 Listed for Rent $1,550 RENTEC
- 2019-10-20 Delisted — MCALLENMLS
- 2019-10-13 Price Changed $169,000 MCALLENMLS
- 2019-09-14 Listed $176,000 MCALLENMLS
- 2019-08-31 Delisted — MCALLENMLS
- 2019-07-11 Price Changed $176,000 MCALLENMLS
- 2019-04-09 Listed $182,000 MCALLENMLS
Cash-flow waterfall
monthlySold comps — $/sqft
last 12 mo · ≤1 miLoading sold comps…