5225 Legacy St · Haltom City, TX
Flood risk 1/10 · Minimal
- FEMA flood zone
- X (unshaded)
- Chance of flooding over 30 yrs
- 0.0%
- Est. flood insurance / yr
- $507 – $1,088
Fire risk 1/10 · Minimal
- Est. fire insurance / yr
- $1,222 – $2,270
Heat risk 7/10 · Major
- Hot days now (above 109°F)
- 7 days/yr
- Hot days in 30 yrs
- 23 days/yr
Wind risk 4/10 · Minor
- Chance of severe wind over 30 yrs
- 24.0%
Air-quality risk 4/10 · Minor
- Unhealthy air days now
- 4 days/yr
- Unhealthy air days in 30 yrs
- 5 days/yr
Risk factors via First Street. Map © Google.
Why this score? — see what drove the D- grade
The composite is a weighted blend of 9 inputs, each scored 0–100. Each bar is that input's sub-score; the figure is the points it added to the 100-point composite (weight × sub-score).
- Cash flow +10.8/30.0
- ARV discount +7.5/15.0
- Rent growth +4.5/5.0
- Schools +3.7/10.0
- Livability +3.3/5.0
- DSCR +3.1/10.0
- Condition / age +2.5/5.0
- 1% rule +2.0/10.0
- Appreciation +0.0/10.0
$249,990
🖨 Deal sheet (PDF) 📄 Offer letter ✓ Due diligence
Listing remarks MLS
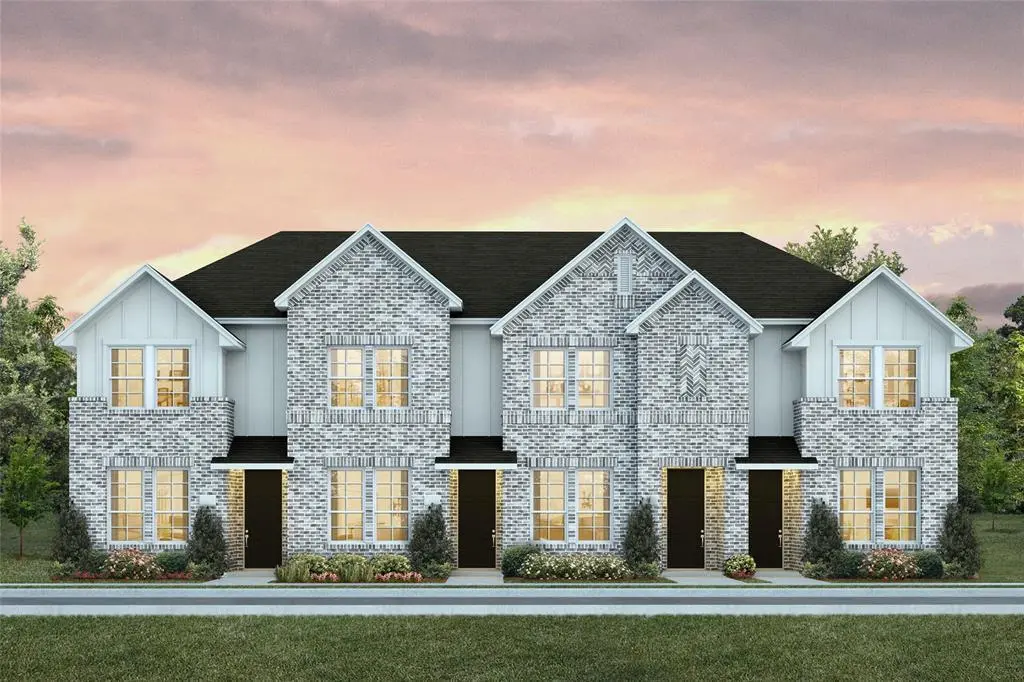
CB JENI Homes - AMELIA floor plan. This 2-bedroom, 2 full bath townhome features a full-size bedroom with an ensuite bath, perfect for guests or as a home workspace, and a laundry area that accommodates a full-size washer and dryer. The 2nd floor offers a bright and cheerful setting that's perfect for entertaining. The beautiful kitchen, with quartz countertops, spacious cabinets and designer hardware, opens to the living area. The primary bedroom will allow for a queen or king size bed and has 2 separate closets. The primary bathroom has an oversized shower, ceramic tile flooring and shower walls, and a double sink vanity. Available in JUNE!
Key facts
- Spacious cabinets
- Quartz countertops
- Full-size bedroom
Tags
Neighborhood map
What this means for you Summary
Snapshot
- This is a 2-bed/2.0-bath townhouse listed at $250k.
Deal economics
- At list price, monthly cash flow is $-116 ($-1k/yr) — negative.
- To cash-flow at today's rent, offer at most $230k (8.2% below list).
- To meet the 1% rule (rent ≥ 1% of price), the offer needs to be $176k (29.6% below list).
- Recommended offer: $176k (29.6% below list) — sets the bar for 1% rule.
- Cap rate 5.7% vs local median 4.3% in Haltom City — top-decile yield for the area; either an underpriced asset or a hidden risk that comps aren't pricing in. Stress-test before assuming the spread holds.
Location & tenants
- Location reads 66/100 on livability (#644 in TX) — a middle-class / working-renter tenant base. Strengths: cost of living A+, housing A+; Watch: employment D+, schools D, amenities F.
- Birdville ISD (suburban): math 42% / reading 43% proficiency, ranked #299 of 826 in TX (top 36%) — families likely to look elsewhere, expect single-tenant / working-renter base with shorter leases.
- Market conditions: Rents rising fast (+7.9%/yr); 124 active listings in the ZIP; 40 comparable units currently listed for rent nearby; rentals at typical pace (median 22d on market — plan ~3-4 weeks tenant-placement turnaround); 18,938 units permitted in Tarrant County in 2024 (8,336 in 5+ unit buildings).
- This rent runs 41% of the median local income ($52k/yr) — at the standard rent-burdened threshold; future hikes will face affordability resistance.
Forward outlook
- Local home prices are declining (-3.0%/yr); year-one equity from $2k of loan paydown is wiped out by about $8k of value loss. Plan a longer hold.
- Tarrant County population projected at +41% by 2050 — long-run rental-demand tailwind backs the buy-and-hold thesis.
Negotiation context
- It's been on market 50 days — a 3% lower offer ($242k) is reasonable based on typical stale-listing flexibility.
- 2 sale attempts with the ask held roughly flat each time — persistent listings suggest the price (not the market) is what's stuck; bring a comps-based counter.
Risks & watch-outs
- Climate carrying-cost: extreme-heat days projected 7→23/yr by 2055 (HVAC capex compounding) — expect insurance premiums to compound above CPI over the hold.
Questions for the listing agent
- What do current leases actually rent for vs. the listed asking? Can we see a recent rent roll and the last 12 months of T-12 income?
- It's been on market 50 days. Have you received any prior offers? Is the seller open to a 30% concession, seller financing, or rate buy-down credit?
- Is there a deadline driving the sale (1031 exchange, divorce, estate, relocation)? That informs how much negotiation room exists.
- Schools are D-rated, which usually means shorter tenancies and higher turnover. Who's the typical renter profile here, and what's been the actual vacancy rate?
- The area grade is low — what's the realistic commute time and amenity access for the typical tenant pool here? Any planned neighborhood developments (good or bad) we should know about?
- What's the average days-on-market for RENTAL listings here right now (not sales)? A rising rental-DOM trend means longer vacancies and softer asking-rent achievability than the comps imply.
- What's the recent tenant-quality profile in this submarket — average credit score on applications, eviction rate, late-payment / NSF rate, and stable-employment percentage? A property-management company in the area should have these aggregated.
- How much new for-sale + rental construction is in the pipeline within 1–3 miles? Heavy new supply typically softens prices + rents 12–24 months out; constrained supply supports both.
Investment metrics
- 1% rule
- 0.70% ✗
- Cap rate
- 5.74%
- Cash-on-cash
- -1.99%
- DSCR
- 0.91
- GRM
- 11.8
CMA / ARV
- ARV (median comp)
- $250,165
- List price
- $249,990
- Delta
- -0.07%
- Verdict
- FAIR
- Comps
- 20 within 1.0 mi
Show comp detail 12 sales within ~0.75 mi
| Address | Dist | Beds/Ba | Sqft | Sold | Price | $/sf | Match |
|---|---|---|---|---|---|---|---|
| 5222 Springlake Pkwy | 0.02mi | 2/2.0 | 1,084 (0%) | 1mo | $234,990 | $217 | 98 |
| 5236 Legacy St | 0.04mi | 2/2.0 | 1,092 (+1%) | 8mo | $244,000 | $223 | 90 |
| 5304 Cornerstone St | 0.16mi | 2/2.0 | 1,092 (+1%) | 3mo | $246,990 | $226 | 89 |
| 5220 Springlake Pkwy | 0.02mi | 2/2.0 | 1,145 (+6%) | 1mo | $244,990 | $214 | 89 |
| 5234 Legacy St | 0.03mi | 2/2.0 | 1,084 (0%) | 12mo | $261,000 | $241 | 88 |
| 5238 Legacy St | 0.04mi | 2/2.0 | 1,084 (0%) | 12mo | $269,330 | $248 | 88 |
| 5320 Cornerstone St | 0.17mi | 2/2.0 | 1,084 (0%) | 5mo | $235,000 | $217 | 88 |
| 5256 Springlake Pkwy | 0.06mi | 2/2.0 | 1,108 (+2%) | 8mo | $240,000 | $217 | 87 |
| 5240 Legacy St | 0.04mi | 2/2.0 | 1,092 (+1%) | 12mo | $254,000 | $233 | 87 |
| 5342 Springlake Pkwy | 0.20mi | 2/2.0 | 1,084 (0%) | 11mo | $245,000 | $226 | 82 |
| 5310 Cornerstone St | 0.16mi | 2/2.0 | 1,145 (+6%) | 7mo | $262,000 | $229 | 77 |
| 5344 Springlake Pkwy | 0.21mi | 2/2.0 | 1,145 (+6%) | 9mo | $253,500 | $221 | 74 |
Match score weights: distance 35% · size 25% · config 20% · recency 20%. Top-matched comps best support the ARV.
Projected returns pro-forma
-3.0% appreciation · 7.89% rent growth · sell at horizon
- IRR
- -15.0%
- Equity multiple
- 0.44×
- Total profit
- $-38,914
- Equity at exit
- $37,274
- IRR
- -0.5%
- Equity multiple
- 0.96×
- Total profit
- $-2,596
- Equity at exit
- $21,615
Cash invested: $69,997 (down + closing). Projections, not guarantees.
Landlord ↔ Tenant lean methodology
- Overall (STATE)
- 87 Strongly Landlord-Friendly
- State Texas
- 87 Strongly Landlord-Friendly · R+5
- County
- — inherits STATE
- City
- — inherits STATE
ZIP-level market 76117
- Home prices YoY
- -23.9%
- Rents YoY
- 7.9%
- Active inventory
- 124
- Price-to-rent
- 11.8×
Monthly cashflow live
- Estimated rent
- $1,759 high interval (Pro) →
- Mortgage (P&I)
- −$1,311
- Tax from tax record
- −$90 /mo · $1,082/yr
- Insurance
- −$104
- HOA
- −$0
- Vacancy / Maint / Mgmt
- −$369
- Net cashflow
- $-116
Break-even live
Sensitivity live
| Price | -10% $26 | -5% $-45 | +0% $-116 | +5% $-187 | +10% $-257 |
|---|---|---|---|---|---|
| Rent | -10% $-255 | -5% $-185 | +0% $-116 | +5% $-46 | +10% $23 |
| Rate | -1.0pp $10 | -0.5pp $-52 | base $-116 | +0.5pp $-181 | +1.0pp $-246 |
UW: 25.0% down · 7.5% · 30yr · 1.5% tax · 5.0% vac · 8.0% maint · 8.0% mgmt
Financing live
Cash to close
- Down payment
- $62,498
- Closing costs
- $7,500
- Reserves months
- —
- Total cash needed
- —
Loan-product check · same deal, 3 products live
Conventional
25% down · 7.5% · 30yr
- Down + closing
- —
- Monthly P&I
- —
- Monthly cashflow
- —
- DSCR
- —
- Eligible?
- —
Personal DTI + credit; lowest rate.
DSCR
20% down · 8.5% · 30yr
- Down + closing
- —
- Monthly P&I
- —
- Monthly cashflow
- —
- DSCR
- —
- Eligible?
- —
No personal income docs; deal must DSCR.
Hard money
10% down · 12.0% · 12mo
- Down + closing
- —
- Monthly P&I
- —
- Monthly cashflow
- —
- DSCR
- —
- Eligible?
- —
Short-term bridge; refi at stabilization.
Rent comps 40 comps
| Address | Beds | Baths | Sqft | Rent | $/sqft | DOM | Units | Dist |
|---|---|---|---|---|---|---|---|---|
| 5114 Springlake Pkwy Haltom City, TX | 2.0 | 2.0 | 1196 | $2,260 | $1.89 | 44d | 1 | 0.07mi |
| 4708 Haltom Rd Haltom City, TX | 2.0 | 2.0 | 1161 | $2,300 | $1.98 | 44d | 1 | 0.21mi |
| 4704 Haltom Rd Haltom City, TX | 2.0 | 2.0 | 1161 | $2,100 | $1.81 | 44d | 1 | 0.21mi |
| 5301 Springlake Pkwy Haltom City, TX | 1.0–2.0 | 1.0–2.0 | 813 | $1,485 | $1.83 | 23d | 4 | 0.24mi |
| 4425 Jane Anne St Haltom City, TX | 3.0 | 1.5 | 1025 | $1,800 | $1.76 | 25d | 1 | 0.42mi |
| 4209 Haltom Rd Haltom City, TX | 3.0 | 2.0 | 1404 | $1,895 | $1.35 | 45d | 1 | 0.57mi |
| 4957 Colonial Park Dr Haltom City, TX | 3.0 | 2.0 | 1432 | $1,420 | $0.99 | 25d | 1 | 0.62mi |
| 5100 Herrick Ct Haltom City, TX | 2.0 | 2.0 | 901 | $1,075 | $1.19 | 7d | 1 | 0.77mi |
| 5400 Haltom Rd Haltom City, TX | 1.0–3.0 | 1.0–2.0 | 1095 | $2,422 | $2.21 | 0d | 71 | 0.82mi |
| 4200 Northern Cross Blvd Haltom City, TX | 1.0–3.0 | 1.0–2.0 | 979 | $1,436 | $1.47 | 0d | 30 | 0.94mi |
| 5350 Fossil Creek Blvd Fort Worth, TX | 2.0 | 2.0 | 1127 | $1,705 | $1.51 | 44d | 1 | 0.98mi |
| 5350 Fossil Creek Blvd Fort Worth, TX | 1.0 | 1.0 | 772 | $1,204 | $1.56 | 13d | 1 | 0.98mi |
| 5350 Fossil Creek Blvd Apt 411 Haltom City, TX | 1.0 | 1.0 | 772 | $1,245 | $1.61 | 0d | 1 | 0.98mi |
| 5350 Fossil Creek Blvd Unit 5407 Haltom City, TX | 2.0 | 2.0 | 1030 | $1,490 | $1.45 | 44d | 1 | 0.98mi |
| 5350 Fossil Creek Blvd Unit 5371 Haltom City, TX | 1.0 | 1.0 | 772 | $1,250 | $1.62 | 15d | 1 | 0.98mi |
| 5350 Fossil Creek Blvd Unit 5383 Haltom City, TX | 3.0 | 2.0 | 1324 | $2,229 | $1.68 | 0d | 1 | 0.98mi |
| 5350 Fossil Creek Blvd Unit 5387 Haltom City, TX | 2.0 | 2.0 | 1030 | $1,374 | $1.33 | 0d | 1 | 0.98mi |
| 5350 Fossil Creek Blvd Unit 5365 Haltom City, TX | 1.0 | 1.0 | 772 | $1,204 | $1.56 | 0d | 1 | 0.98mi |
| 5350 Fossil Creek Blvd Unit 2105 Haltom City, TX | 2.0 | 2.0 | 1030 | $1,415 | $1.37 | 0d | 1 | 0.98mi |
| Fossil Creek Blvd #1125 Haltom City, TX | 1.0–2.0 | 1.0–2.0 | 881 | $2,140 | $2.43 | 21d | 7 | 1.00mi |
| 5350 Fossil Creek Blvd Unit 7-734 Fort Worth, TX | 1.0–2.0 | 1.0–2.0 | 934 | $2,180 | $2.33 | 21d | 10 | 1.00mi |
| 5333 Fossil Creek Blvd Unit 5390 Haltom City, TX | 2.0 | 2.0 | 993 | $1,360 | $1.37 | 25d | 1 | 1.06mi |
| 5333 Fossil Creek Blvd Unit 5366 Haltom City, TX | 3.0 | 2.0 | 1330 | $1,915 | $1.44 | 25d | 1 | 1.06mi |
| 5333 Fossil Creek Blvd Unit 5354 Haltom City, TX | 1.0 | 1.0 | 700 | $1,135 | $1.62 | 44d | 1 | 1.06mi |
| 4100 Northern Cross Blvd Fort Worth, TX | 3.0 | 1.0–2.0 | 948 | $2,372 | $2.50 | 0d | 36 | 1.06mi |
| 5604 Macgregor Dr Haltom City, TX | 3.0 | 2.0 | 1348 | $1,900 | $1.41 | 44d | 1 | 1.10mi |
| 5333 Fossil Creek Blvd Fort Worth, TX | 1.0 | 1.0 | 700 | $1,140 | $1.63 | 25d | 1 | 1.12mi |
| 5333 Fossil Creek Blvd Fort Worth, TX | 1.0–3.0 | 1.0–2.0 | 1015 | $1,680 | $1.66 | 3d | 110 | 1.12mi |
| 5333 Fossil Creek Blvd Fort Worth, TX | 3.0 | 2.0 | 1330 | $2,170 | $1.63 | 44d | 1 | 1.12mi |
| 5340 Jerri Ln Haltom City, TX | 3.0 | 1.0 | 1134 | $1,795 | $1.58 | 8d | 1 | 1.18mi |
| 5500 N Beach St Fort Worth, TX | 2.0 | 2.0 | 1105 | $1,835 | $1.66 | 4d | 1 | 1.20mi |
| 5500 N Beach St Fort Worth, TX | 3.0 | 2.0 | 1378 | $2,393 | $1.74 | 44d | 1 | 1.20mi |
| 5500 N Beach St Fort Worth, TX | 3.0 | 2.0 | 1378 | $2,297 | $1.67 | 21d | 1 | 1.20mi |
| 5621 Macdougall Dr Haltom City, TX | 3.0 | 2.0 | 1359 | $1,965 | $1.45 | 25d | 1 | 1.20mi |
| 4700 Fossil Vista Dr Haltom City, TX | 1.0–3.0 | 1.0–2.0 | 984 | $2,143 | $2.18 | 2d | 12 | 1.21mi |
| 6228 Glenview Dr North Richland Hills, TX | 1.0 | 1.0 | 791 | $1,225 | $1.55 | 5d | 7 | 1.24mi |
| 3736 Layton Ave Haltom City, TX | 3.0 | 1.5 | 1100 | $1,600 | $1.45 | 44d | 1 | 1.26mi |
| 4699 Fossil Vista Dr Haltom City, TX | 1.0 | 1.0 | 738 | $1,265 | $1.71 | 15d | 1 | 1.26mi |
| 5544 Dunson Dr Haltom City, TX | 3.0 | 2.0 | 1187 | $1,950 | $1.64 | 44d | 1 | 1.29mi |
| 4699 Fossil Vista Dr Unit 3121 Haltom City, TX | 3.0 | 2.0 | 1273 | $1,715 | $1.35 | 0d | 1 | 1.30mi |
Listing history 11 events
-
2026-06-09days on market $249,990 Active 50 DOM
-
2026-06-08days on market $249,990 Active 49 DOM
-
2026-06-08days on market $249,990 Active 48 DOM
-
2026-06-07days on market $249,990 Active 49 DOM
-
2026-06-04days on market $249,990 Active 46 DOM
-
2026-06-03days on market $249,990 Active 45 DOM
-
2026-06-02days on market $249,990 Active 44 DOM
-
2026-06-01days on market $249,990 Active 43 DOM
-
2026-05-31days on market $249,990 Active 42 DOM
-
2026-04-20$249,990 Active 650-char remark
Show marketing remark (650 chars)
CB JENI Homes - AMELIA floor plan. This 2-bedroom, 2 full bath townhome features a full-size bedroom with an ensuite bath, perfect for guests or as a home workspace, and a laundry area that accommodates a full-size washer and dryer. The 2nd floor offers a bright and cheerful setting that's perfect for entertaining. The beautiful kitchen, with quartz countertops, spacious cabinets and designer hardware, opens to the living area. The primary bedroom will allow for a queen or king size bed and has 2 separate closets. The primary bathroom has an oversized shower, ceramic tile flooring and shower walls, and a double sink vanity. Available in JUNE!
-
2026-04-19$249,990 Active 660-char remark
Show marketing remark (660 chars)
CB JENI HOMES AMELIA floor plan. This 2 bedroom, 2 full bath townhome features a full-size bedroom with an ensuite bath, perfect for guests or as a home workspace, and a laundry area that accommodates a full-size washer and dryer. The 2nd floor offers a bright and cheerful setting that’s perfect for entertaining. The beautiful kitchen, with quartz countertops, spacious cabinets and designer hardware, opens to the living area. The primary bedroom will allow for a queen or king size bed and has 2 separate closets. The primary bathroom has an oversized shower, ceramic tile flooring and shower walls, and a double sink vanity. Available in JUNE 2026!
ⓘ Source: listings_history table (triggers on properties + properties_extension) + one-shot
backfill from property_details.listing_events for pre-trigger history.
Tax reassessment forecast TX · Resets to sale price
- Current annual tax
- $1,082 · $90/mo
- Projected year-2 tax
- $4,575 · $381/mo
- Expected delta
- +$3,493/yr (+$291/mo · 323.0%)
ⓘ Screening estimate from a state-policy table — verify with the county assessor before closing.
Climate risk First Street
- Flood 1/10 Low FEMA zone X (unshaded) · 0% chance over 30 yrs
- Wildfire 1/10 Low
- Heat 7/10 Severe 7 d/yr ≥109°F today · 23 d/yr by 30 yrs out
- Wind 4/10 Moderate 24% chance of damaging wind over 30 yrs
- Air quality 4/10 Moderate 4 unhealthy d/yr today · 5 by 30 yrs out
Nearby sold comps map
Loading sold comps map…
Walkable amenities ~0.75 mi
Loading nearby amenities…
Taxation est. · year 1
- Rental income
- $21,106
- − Mortgage interest
- −$14,003
- − Property taxes
- −$1,082
- − Insurance
- −$1,250
- − Repairs & maintenance
- −$1,688
- − Management
- −$1,688
- − Depreciation
- −$7,272
- Taxable loss
- −$5,878
- Est. tax savings @ 24.0%
- +$1,411
- After-tax cash flow
- $21/yr
For passive investors: Depreciation is non-cash, so a rental often shows a tax loss while cash-flowing — sheltering income. Rental losses are passive: they offset passive income freely, and up to $25,000/yr can offset ordinary (W-2) income if you actively participate and your MAGI is under $100k (phasing out to $0 by $150k); unused losses carry forward. On sale, claimed depreciation is recaptured at up to 25%, and gains may owe capital-gains tax (a 1031 exchange can defer both). Figures are a year-1 estimate at your 24.0% rate — not tax advice; consult a CPA.
Schools (NCES district)
- District
- Birdville ISD
- NCES district ID
- 4810230
- Math proficiency
- 42% ▼ -12.00%
- Reading proficiency
- 43% ▼ -6.00%
- Median HH income
- $55,930
- Composite
- 37.13/100
- National rank
- #4491
- State rank
- #299 of 826 in TX
Livability — Haltom City
- Score
- 66/100
- State rank
- #644
- US rank
- #12214
Category grades
Schools grade is shown separately in the Schools card above.
Census & demographics
- Census place
- Haltom City, TX
- County
- Tarrant County · 2,033,669 people
- City population
- 32,950
- Metro
- Dallas-Fort Worth-Arlington, TX
- Population (ZIP)
- 32,950
- Household income
- $51,670
- Rent vs Own
- Severe rent burden
- 1105.0
Population outlook (Tarrant County) Hauer SSP2
- Today (2025)
- 2,380,417 people
- By 2030
- 2,578,900 · +8.3%
- By 2040
- 2,974,995 · +25.0%
- By 2050
- 3,350,489 · +40.8%
- By 2075
- 4,216,909 · +77.2%
- By 2100
- 4,741,527 · +99.2%
Race, ethnicity, and origin ACS 2023
- Neighborhood character
- Diverse neighborhood (Simpson 0.64)
- Race & ethnicity
- Hispanic / Latino 46% White 38% Two or more races 18% Asian 7% Black 6%
- Hispanic origin (detail)
- Mexican 42% Puerto Rican 1%
- Common ancestry
- Italian 2% Serbian 1% Lithuanian 1%
- Foreign-born
- 24% · Canada, Vietnam
- Languages at home
- 56% English-only · Spanish 36% Other Asian/Pacific 4% Vietnamese 2%
Political lean MEDSL · Tarrant
- 2024 margin
- Lean R (+5.1) · D 46.7% · R 51.9% · Other 1.4%
- 2008→2024 swing
- +6.6pp toward D · 2008: -11.7pp · 2024: -5.1pp
- All cycles
- 2024: R+5.1 2020: D+0.2 2016: R+8.7 2012: R+15.7 2008: R+11.7
Not yet ingested
- Civics
- —
Market trends
- HPI YoY
- ▼ -103.25%
- Current HPI
- 328.69
- Rent YoY
- ▲ 7.89%
- Metro
- Dallas-Fort Worth-Arlington, TX
- State GDP YoY
- ▲ 3.95%
- F500 in state
- 110
Industry mix (Fortune 500 HQ in TX)
| Industry | F500 HQs | Revenue |
|---|---|---|
| Energy | 16 | $1,198B |
|
||
| Technology | 5 | $198B |
|
||
| Engineering / Construction | 4 | $72B |
|
||
| Energy Services | 3 | $60B |
|
||
| Utilities | 3 | $41B |
|
||
| Healthcare | 2 | $330B |
|
||
Price history
+0.0% since first listed2 events — show timeline
- 2026-04-20 Listed $249,990 Zillow
- 2026-04-19 Listed $249,990 NTREIS
Property tax history
-1.4%/yrLatest (2025): $1,082 · -2.4% YoY. Source: county tax records.
Cash-flow waterfall
monthlySold comps — $/sqft
last 12 mo · ≤1 miLoading sold comps…