2321 Landrum Ave · Louisville/Jefferson County metro government (balance), KY
Flood risk 6/10 · Moderate
- FEMA flood zone
- X (shaded)
- Chance of flooding over 30 yrs
- 0.72%
- Est. flood insurance / yr
- $507 – $1,088
Fire risk 1/10 · Minimal
- Est. fire insurance / yr
- $839 – $1,559
Heat risk 5/10 · Moderate
- Hot days now (above 105°F)
- 7 days/yr
- Hot days in 30 yrs
- 20 days/yr
Wind risk 2/10 · Minimal
- Chance of severe wind over 30 yrs
- 2.0%
Air-quality risk 2/10 · Minimal
- Unhealthy air days now
- 1 days/yr
- Unhealthy air days in 30 yrs
- 3 days/yr
Risk factors via First Street. Map © Google.
Why this score? — see what drove the C grade
The composite is a weighted blend of 9 inputs, each scored 0–100. Each bar is that input's sub-score; the figure is the points it added to the 100-point composite (weight × sub-score).
- Cash flow +25.4/30.0
- DSCR +8.4/10.0
- ARV discount +7.5/15.0
- 1% rule +5.8/10.0
- Rent growth +2.6/5.0
- Livability +2.5/5.0
- Condition / age +2.5/5.0
- Schools +2.3/10.0
- Appreciation +0.0/10.0
$95,000
🖨 Deal sheet 📄 Offer letter ✓ Due diligence
Listing remarks
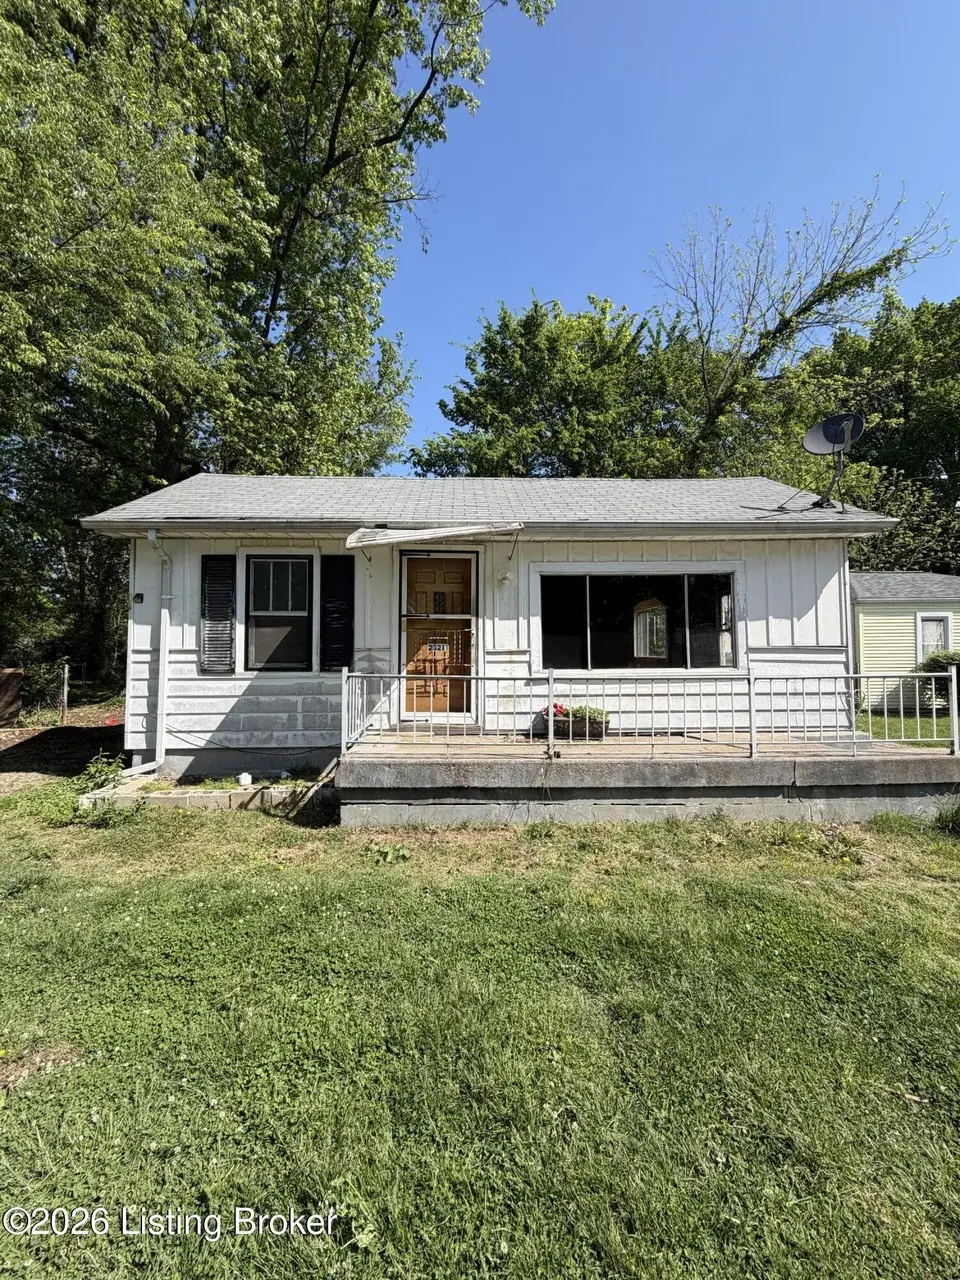
This home is a 2 bedroom 1 bath with detached garage that sits on a nice spacious corner lot. Home has a large living room with lots of windows, nice size kitchen with picture window, two bedrooms, full bath, laundry room and another room that could be used as office. Home is in need of repairs. Subject to court approval with 60-90 day closing. The property will be sold in ''as-is'' ''where-is'' condition.
Key facts
- 0.28 acre lot
- Garage
- Built 1942
Property features AI
Finance
- Other: Subdivision: Briargate
- HOA & community: No association fee
Exterior
- Parking: Detached garage (1 car); Rear entry garage; Driveway parking
- Utilities: Electricity connected; Natural gas available
- Home design: Single-family ranch-style home; One story; Built in 1942
- Construction: Vinyl siding, wood frame, and aluminum siding exterior; Shingle roof; Crawl space foundation
- Exterior features: Corner lot; Wood and chain-link fencing
Interior
- Kitchen: Kitchen located on the first floor
- Bedrooms: Two bedrooms on the first floor
- Bathrooms: One full bathroom on the first floor
- Heating & cooling: Natural gas heating
- Interior features: Six total rooms; Three closets; No basement; One fireplace: none reported
- Laundry & utility: First-floor laundry room
Neighborhood map
What this means for you Summary
Snapshot
- This is a 2-bed/1.0-bath single-family listed at $95k.
Deal economics
- At list price, monthly cash flow is $219 ($3k/yr) — positive.
- The deal already cash-flows at list — no discount required.
- Meets the 1% rule at list price ($1k rent vs $95k).
- Recommended offer: $94k (1.5% below list) — sets the bar for market timing.
- Cap rate 9.1% vs local median 4.0% in Louisville/Jefferson County metro government (balance) — top-decile yield for the area; either an underpriced asset or a hidden risk that comps aren't pricing in. Stress-test before assuming the spread holds.
Location & tenants
- Location reads: area grade C — affects rentability + tenant quality, not the cash-flow math above.
- Jefferson County (urban): math 19% / reading 35% proficiency, ranked #121 of 165 in KY (top 73%) — low school quality limits family demand, transient renter base, plan for 1-2y turnover.
- Market conditions: Rents flat; 204 active listings in the ZIP; 31 comparable units currently listed for rent nearby; rentals at typical pace (median 24d on market — plan ~3-4 weeks tenant-placement turnaround); 2,836 units permitted in Jefferson County in 2024 (1,558 in 5+ unit buildings).
Forward outlook
- Local home prices are declining (-3.0%/yr); year-one equity from $657 of loan paydown is wiped out by about $3k of value loss. Plan a longer hold.
- Jefferson County population projected at +13% by 2050 — modest demand growth; plan on rents tracking national, not racing it.
Negotiation context
- It's been on market 23 days — a 2% lower offer ($94k) is reasonable based on typical stale-listing flexibility.
Risks & watch-outs
- Watch-outs: built in 1942 — expect roof / HVAC / electrical / plumbing capex.
- Climate carrying-cost: major flood risk; extreme-heat days projected 7→20/yr by 2055 (HVAC capex compounding) — expect insurance premiums to compound above CPI over the hold.
Questions for the listing agent
- Built in 1942 — when were the roof, HVAC, electrical panel, plumbing, and water heater last replaced?
- Is there a deadline driving the sale (1031 exchange, divorce, estate, relocation)? That informs how much negotiation room exists.
- What's the average days-on-market for RENTAL listings here right now (not sales)? A rising rental-DOM trend means longer vacancies and softer asking-rent achievability than the comps imply.
- What's the recent tenant-quality profile in this submarket — average credit score on applications, eviction rate, late-payment / NSF rate, and stable-employment percentage? A property-management company in the area should have these aggregated.
- How much new for-sale + rental construction is in the pipeline within 1–3 miles? Heavy new supply typically softens prices + rents 12–24 months out; constrained supply supports both.
Investment metrics
- 1% rule
- 1.08% ✓
- Cap rate
- 9.06%
- Cash-on-cash
- 9.89%
- DSCR
- 1.44
- GRM
- 7.7
CMA / ARV
- ARV (on-the-fly)
- $191,295
- Comps found
- 12
Show comp detail 12 sales within ~0.75 mi
| Address | Dist | Beds/Ba | Sqft | Sold | Price | $/sf | Match |
|---|---|---|---|---|---|---|---|
| 5108 Stewart Dr | 0.17mi | 2/1.0 | 920 (-6%) | 1mo | $193,000 | $210 | 81 |
| 4905 Feys Dr | 0.25mi | 2/1.0 | 1,032 (+5%) | 3mo | $177,000 | $172 | 77 |
| 4929 Hyde Park Dr | 0.27mi | 3/1.0 (+1) | 936 (-5%) | 1mo | $190,000 | $203 | 74 |
| 4929 Determine Ln | 0.24mi | 3/1.0 (+1) | 1,050 (+7%) | 3mo | $170,000 | $162 | 70 |
| 4804 Ranchland Dr | 0.56mi | 2/1.0 | 941 (-4%) | 1mo | $172,500 | $183 | 66 |
| 2613 Alva Dr | 0.34mi | 3/1.0 (+1) | 1,050 (+7%) | 3mo | $205,000 | $195 | 65 |
| 2407 Omaha Ln | 0.33mi | 3/1.0 (+1) | 1,050 (+7%) | 4mo | $222,000 | $211 | 65 |
| 2515 Briargate Ave | 0.35mi | 3/1.0 (+1) | 1,080 (+10%) | 1mo | $206,000 | $191 | 60 |
| 2310 Thomas Ave | 0.37mi | 3/1.0 (+1) | 1,075 (+10%) | 2mo | $120,000 | $112 | 60 |
| 4801 Dyer Ave | 0.39mi | 3/1.0 (+1) | 1,080 (+10%) | 1mo | $180,000 | $167 | 59 |
| 4729 Graston Ave | 0.36mi | 3/2.0 (+1) | 1,072 (+9%) | 7mo | $210,000 | $196 | 53 |
| 6704 Marian Dr | 0.74mi | 2/1.0 | 925 (-6%) | 5mo | $199,500 | $216 | 52 |
Match score weights: distance 35% · size 25% · config 20% · recency 20%. Top-matched comps best support the ARV.
Projected returns pro-forma
-3.0% appreciation · 0.57% rent growth · sell at horizon
- IRR
- -4.0%
- Equity multiple
- 0.85×
- Total profit
- $-3,897
- Equity at exit
- $14,165
- IRR
- 2.9%
- Equity multiple
- 1.19×
- Total profit
- $4,938
- Equity at exit
- $8,214
Cash invested: $26,600 (down + closing). Projections, not guarantees.
Landlord ↔ Tenant lean methodology
- Overall (STATE)
- 83 Strongly Landlord-Friendly
- State Kentucky
- 83 Strongly Landlord-Friendly · R+16
- County
- — inherits STATE
- City
- — inherits STATE
ZIP-level market 40216
- Rents YoY
- 0.6%
- Active inventory
- 204
- Price-to-rent
- 7.7×
Monthly cashflow live
- Estimated rent
- $1,023 high interval (Pro) →
- Mortgage (P&I)
- −$498
- Tax from tax record
- −$51 /mo · $616/yr
- Insurance
- −$40
- HOA
- −$0
- Vacancy / Maint / Mgmt
- −$215
- Net cashflow
- $219
Break-even live
UW: 25.0% down · 7.5% · 30yr · 1.5% tax · 5.0% vac · 8.0% maint · 8.0% mgmt
Financing live
Cash to close
- Down payment
- $23,750
- Closing costs
- $2,850
- Reserves months
- —
- Total cash needed
- —
Loan-product check · same deal, 3 products live
Conventional
25% down · 7.5% · 30yr
- Down + closing
- —
- Monthly P&I
- —
- Monthly cashflow
- —
- DSCR
- —
- Eligible?
- —
Personal DTI + credit; lowest rate.
DSCR
20% down · 8.5% · 30yr
- Down + closing
- —
- Monthly P&I
- —
- Monthly cashflow
- —
- DSCR
- —
- Eligible?
- —
No personal income docs; deal must DSCR.
Hard money
10% down · 12.0% · 12mo
- Down + closing
- —
- Monthly P&I
- —
- Monthly cashflow
- —
- DSCR
- —
- Eligible?
- —
Short-term bridge; refi at stabilization.
Rent comps 31 comps
| Address | Beds | Baths | Sqft | Rent | $/sqft | DOM | Units | Dist |
|---|---|---|---|---|---|---|---|---|
| 5302 Milner Rd Unit 9 Louisville, KY | 1.0 | 1.0 | 525 | $685 | $1.30 | 23d | 1 | 0.45mi |
| 5302 Milner Rd Unit 1 Louisville, KY | 1.0 | 1.0 | 525 | $685 | $1.30 | 17d | 1 | 0.45mi |
| 5301 Milner Rd Louisville, KY | 1.0 | 1.0 | 600 | $650 | $1.08 | 23d | 1 | 0.47mi |
| 5112 Valiant Dr Unit 2 Louisville, KY | 1.0 | 1.0 | 750 | $750 | $1.00 | 17d | 1 | 0.55mi |
| 4133 Flintlock Dr Louisville, KY | 1.0 | 1.0 | 700 | $875 | $1.25 | 23d | 1 | 0.57mi |
| 1721 Tempest Way Unit 1 Louisville, KY | 1.0 | 1.0 | 700 | $725 | $1.04 | 23d | 1 | 0.59mi |
| 2001 Rockford Ln Unit RKFD-07 Louisville, KY | 2.0 | 1.0 | 800 | $1,050 | $1.31 | 3d | 1 | 0.69mi |
| 1625 Brick Kiln Ln Apt 2 Louisville, KY | 2.0 | 1.0 | 750 | $900 | $1.20 | 17d | 1 | 0.71mi |
| 1623 Brick Kiln Ln Unit 1 Louisville, KY | 2.0 | 1.0 | 860 | $900 | $1.05 | 23d | 1 | 0.73mi |
| 1602 Clover St Louisville, KY | 2.0 | 1.5 | 867 | $1,060 | $1.22 | 2d | 5 | 0.77mi |
| 4700 Walnut Grove Ave Unit 1 Louisville, KY | 2.0 | 1.0 | 900 | $799 | $0.89 | 23d | 1 | 0.90mi |
| 5700 Bruns Dr Louisville, KY | 2.0–3.0 | 2.0 | 1118 | $1,153 | $1.03 | 11d | 1 | 0.90mi |
| 4902 Saddlebrook Ln Unit 3 Louisville, KY | 2.0 | 1.0 | 800 | $899 | $1.12 | 23d | 1 | 0.98mi |
| 4904 Saddlebrook Ln Unit 4 Louisville, KY | 2.0 | 1.0 | 725 | $765 | $1.06 | 23d | 1 | 0.99mi |
| 1710 Gagel Ave Louisville, KY | 1.0 | 1.0 | 568 | $850 | $1.50 | 3d | 1 | 1.01mi |
| 4911 Saddlebrook Ln Apt 3 Louisville, KY | 2.0 | 1.0 | 800 | $949 | $1.19 | 23d | 1 | 1.03mi |
| 5629 Fox Horn Cir Louisville, KY | 1.0–2.0 | 1.0–2.0 | 1092 | $1,145 | $1.05 | 2d | 8 | 1.10mi |
| 1840 Kendall Ln Apt 25 Louisville, KY | 2.0 | 1.0 | 952 | $1,250 | $1.31 | 23d | 1 | 1.11mi |
| 1836 Kendall Ln Louisville, KY | 2.0 | 1.0 | 870 | $1,150 | $1.32 | 23d | 1 | 1.12mi |
| 1836 Kendall Ln Louisville, KY | 2.0 | 1.0 | 870 | $1,150 | $1.32 | 3d | 1 | 1.12mi |
| 6701 Crawford Crossing Pl Unit 104 Louisville, KY | 2.0 | 2.0 | 900 | $1,025 | $1.14 | 23d | 1 | 1.16mi |
| 4414 Tara Gale Ct Louisville, KY | 3.0 | 1.5 | 1000 | $1,450 | $1.45 | 3d | 1 | 1.18mi |
| 1603 Gagel Ave Unit 8 Louisville, KY | 1.0 | 1.0 | 800 | $749 | $0.94 | 23d | 1 | 1.24mi |
| 4810 Guy Dr Louisville, KY | 3.0 | 1.0 | 925 | $1,800 | $1.95 | 23d | 1 | 1.25mi |
| 3107 Melody Acres Ln Unit 4 Louisville, KY | 2.0 | 1.0 | 750 | $825 | $1.10 | 17d | 1 | 1.28mi |
| 6983 Dixie Hwy Unit 202 Louisville, KY | 2.0 | 1.0 | 800 | $1,050 | $1.31 | 23d | 1 | 1.37mi |
| 3204 Melody Acres Ln Unit 3202-3 Louisville, KY | 2.0 | 1.0 | 750 | $950 | $1.27 | 23d | 1 | 1.39mi |
| 3219 Wilkie Rd Louisville, KY | 2.0 | 1.0 | 725 | $1,350 | $1.86 | 10d | 1 | 1.40mi |
| 3311 Renwood Blvd Louisville, KY | 1.0–2.0 | 1.0–2.0 | 850 | $1,349 | $1.59 | 2d | 20 | 1.41mi |
| 6817 Brooklawn Dr Louisville, KY | 1.0–3.0 | 1.0–1.5 | 902 | $1,207 | $1.34 | 23d | 1 | 1.43mi |
| 4203 Searcy Dr Louisville, KY | 3.0 | 2.0 | 980 | $1,550 | $1.58 | 16d | 1 | 1.49mi |
Listing history 4 events
-
2026-05-16status Pending
-
2026-04-29historical Active Under Contract
-
2026-04-29price $95,000
-
2026-04-23$89,900 Active
ⓘ Source: listings_history table (triggers on properties + properties_extension) + one-shot
backfill from property_details.listing_events for pre-trigger history.
Tax reassessment forecast KY · Resets to sale price
- Current annual tax
- $616 · $51/mo
- Projected year-2 tax
- $817 · $68/mo
- Expected delta
- +$201/yr (+$17/mo · 32.6%)
ⓘ Screening estimate from a state-policy table — verify with the county assessor before closing.
Climate risk First Street
- Flood 6/10 Major FEMA zone X (shaded) · 72% chance over 30 yrs
- Wildfire 1/10 Low
- Heat 5/10 Major 7 d/yr ≥105°F today · 20 d/yr by 30 yrs out
- Wind 2/10 Low 2% chance of damaging wind over 30 yrs
- Air quality 2/10 Low 1 unhealthy d/yr today · 3 by 30 yrs out
Nearby sold comps map
Loading sold comps map…
Walkable amenities ~0.75 mi
Loading nearby amenities…
Taxation est. · year 1
- Rental income
- $12,279
- − Mortgage interest
- −$5,321
- − Property taxes
- −$616
- − Insurance
- −$475
- − Repairs & maintenance
- −$982
- − Management
- −$982
- − Depreciation
- −$2,764
- Taxable income
- $1,139
- Est. tax owed @ 24.0%
- −$273
- After-tax cash flow
- $2,358/yr
For passive investors: Depreciation is non-cash, so a rental often shows a tax loss while cash-flowing — sheltering income. Rental losses are passive: they offset passive income freely, and up to $25,000/yr can offset ordinary (W-2) income if you actively participate and your MAGI is under $100k (phasing out to $0 by $150k); unused losses carry forward. On sale, claimed depreciation is recaptured at up to 25%, and gains may owe capital-gains tax (a 1031 exchange can defer both). Figures are a year-1 estimate at your 24.0% rate — not tax advice; consult a CPA.
Schools (NCES district)
- District
- Jefferson County
- NCES district ID
- 2102990
- Math proficiency
- 19% ▼ -17.00%
- Reading proficiency
- 35% ▼ -11.00%
- Median HH income
- $47,885
- Composite
- 23.45/100
- National rank
- #7884
- State rank
- #121 of 165 in KY
Livability — Louisville/Jefferson County metro government (balance)
No livability data for this city. (Only ~50 U.S. cities are tracked.)
Census & demographics
- Census place
- Louisville/Jefferson County metro government (balance), KY
- County
- Jefferson County · 790,184 people
- City population
- 419,741
- Metro
- Louisville/Jefferson County, KY-IN
- Population (ZIP)
- 44,047
- Household income
- $56,441
- Rent vs Own
- Severe rent burden
- 1434.0
Population outlook (Jefferson County) Hauer SSP2
- Today (2025)
- 823,112 people
- By 2030
- 849,343 · +3.2%
- By 2040
- 895,696 · +8.8%
- By 2050
- 933,630 · +13.4%
- By 2075
- 1,028,262 · +24.9%
- By 2100
- 1,072,675 · +30.3%
Race, ethnicity, and origin ACS 2023
- Neighborhood character
- Diverse neighborhood (Simpson 0.60)
- Race & ethnicity
- Black 45% White 43% Hispanic / Latino 6% Two or more races 6% Asian 1%
- Hispanic origin (detail)
- Mexican 2% Cuban 3%
- Common ancestry
- Lithuanian 1% Italian 1% Slovak 1%
- Foreign-born
- 8% · Canada, Vietnam
- Languages at home
- 89% English-only · Spanish 7% French/Haitian/Cajun 1% Arabic 1%
Political lean MEDSL · Jefferson
- 2024 margin
- D (+16.6) · D 57.4% · R 40.9% · Other 1.7%
- 2008→2024 swing
- +4.5pp toward D · 2008: 12.0pp · 2024: 16.6pp
- All cycles
- 2024: D+16.6 2020: D+20.1 2016: D+13.3 2012: D+11.1 2008: D+12.0
Not yet ingested
- Civics
- —
Market trends
- HPI YoY
- ▼ -234.72%
- Current HPI
- 269.5447
- Rent YoY
- ▲ 0.57%
- Metro
- Louisville/Jefferson County, KY-IN
- State GDP YoY
- ▲ 1.81%
- F500 in state
- 4
Industry mix (Fortune 500 HQ in KY)
| Industry | F500 HQs | Revenue |
|---|---|---|
| Healthcare | 1 | $118B |
|
||
| Food / Beverage | 1 | $7B |
|
||
Price history
+5.7% since first listed4 events — show timeline
- 2026-05-16 Pending — Metro Search MLS
- 2026-04-29 Contingent — Metro Search MLS
- 2026-04-29 Price Changed $95,000 Metro Search MLS
- 2026-04-23 Listed $89,900 Metro Search MLS
Property tax history
+10.6%/yrLatest (2025): $616 · -6.8% YoY. Source: county tax records.
Cash-flow waterfall
monthlySold comps — $/sqft
last 12 mo · ≤1 miLoading sold comps…