1407 Madam Queen St · Marshall, TX
Flood risk No data
- FEMA flood zone
- —
- Chance of flooding over 30 yrs
- —
- Est. flood insurance / yr
- —
Fire risk No data
- Est. fire insurance / yr
- —
Heat risk No data
- Hot days now (above threshold)
- —
- Hot days in 30 yrs
- —
Wind risk No data
- Chance of severe wind over 30 yrs
- —
Air-quality risk No data
- Unhealthy air days now
- —
- Unhealthy air days in 30 yrs
- —
Risk factors via First Street. Map © Google.
Why this score? — see what drove the B+ grade
The composite is a weighted blend of 9 inputs, each scored 0–100. Each bar is that input's sub-score; the figure is the points it added to the 100-point composite (weight × sub-score).
- Cash flow +30.0/30.0
- ARV discount +15.0/15.0
- 1% rule +10.0/10.0
- DSCR +10.0/10.0
- Livability +3.4/5.0
- Rent growth +2.5/5.0
- Condition / age +2.5/5.0
- Schools +2.4/10.0
- Appreciation +0.0/10.0
$64,989
🖨 Deal sheet (PDF) 📄 Offer letter ✓ Due diligence
Listing remarks MLS
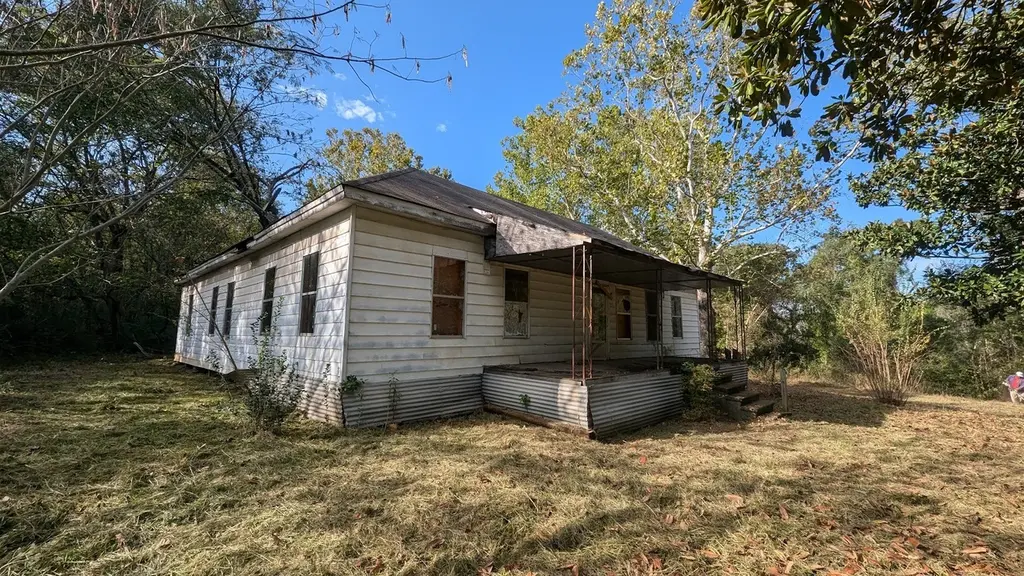
INVESTOR SPECIAL! 1407 Madam queen is a nice home sitting on almost an entire acre of land available in Marshall, TX! This is an investor special that requires a little bit of work, but has potential. The single-story property features an open floorplan that you can easily build off of. A large kitchen space, spacious bedrooms, and many unique details throughout the property. The home also has an extended covered porch area that's perfect for outdoor lounging. There is also plenty of yard space for all kinds of outdoor activities. This location offers you easy access to HWY 390 & HWY 80. You will also be minutes away from East Texas Baptist University. A prime location surrounded by many convenience, dining and shopping options. Being sold AS IS. We make it easy to own. This is a great opportunity! Don't wait, call us today to get more information on the owner's easy terms and smooth process that may be able to put the deed in your name and make this your dream home.
Key facts
- Open floorplan
- 0.97 acre lot
- Built 1940
Tags
Neighborhood map
What this means for you Summary
Snapshot
- This is a 3-bed/1.0-bath single-family listed at $65k.
Deal economics
- At list price, monthly cash flow is $736 ($9k/yr) — positive.
- The deal already cash-flows at list — no discount required.
- Meets the 1% rule at list price ($1k rent vs $65k).
- Recommended offer: $57k (12.0% below list) — sets the bar for market timing.
- Cap rate 19.9% vs local median 4.5% in Marshall — top-decile yield for the area; either an underpriced asset or a hidden risk that comps aren't pricing in. Stress-test before assuming the spread holds.
Location & tenants
- Location reads 68/100 on livability (#451 in TX) — a middle-class / working-renter tenant base. Strengths: cost of living A+, housing A+; Watch: amenities F, commute F, employment F.
- Marshall ISD (town): math 29% / reading 29% proficiency, ranked #658 of 826 in TX (top 80%) — low school quality limits family demand, transient renter base, plan for 1-2y turnover; 68% free/reduced lunch — lower-income household profile, screen leases tightly.
- Zoned schools: Marshall J H (math 30% / reading 27%, grade F, #1,122 of 1,662 statewide, top 69%, 1,105 students, 76% FRL).
- Market conditions: 144 active listings in the ZIP; 3 comparable units currently listed for rent nearby; rentals at typical pace (median 16d on market — plan ~3-4 weeks tenant-placement turnaround); lower-income renter base — watch delinquency; 85 units permitted in Harrison County in 2024 (15 in 5+ unit buildings).
- This rent runs 40% of the median local income ($42k/yr) — at the standard rent-burdened threshold; future hikes will face affordability resistance.
Forward outlook
- Local home prices are declining (-3.0%/yr); year-one equity from $450 of loan paydown is wiped out by about $2k of value loss. Plan a longer hold.
- At projected returns (-3.0% appreciation + 3.0% rent growth), your $18k cash investment doubles in ~3 years — after that, you're playing with house money.
Negotiation context
- It's been on market 578 days — a 12% lower offer ($57k) is reasonable based on typical stale-listing flexibility.
- 2 sale attempts since 6y ago with the ask held roughly flat each time — persistent listings suggest the price (not the market) is what's stuck; bring a comps-based counter.
Risks & watch-outs
- Watch-outs: built in 1940 — expect roof / HVAC / electrical / plumbing capex.
Questions for the listing agent
- It's been on market 578 days. Have you received any prior offers? Is the seller open to a 12% concession, seller financing, or rate buy-down credit?
- Built in 1940 — when were the roof, HVAC, electrical panel, plumbing, and water heater last replaced?
- Why hasn't it sold? Are there any deal-killer items the seller is aware of (foundation, flood, title, zoning, code violations)?
- Is there a deadline driving the sale (1031 exchange, divorce, estate, relocation)? That informs how much negotiation room exists.
- Schools are F-rated, which usually means shorter tenancies and higher turnover. Who's the typical renter profile here, and what's been the actual vacancy rate?
- What's the average days-on-market for RENTAL listings here right now (not sales)? A rising rental-DOM trend means longer vacancies and softer asking-rent achievability than the comps imply.
- What's the recent tenant-quality profile in this submarket — average credit score on applications, eviction rate, late-payment / NSF rate, and stable-employment percentage? A property-management company in the area should have these aggregated.
- How much new for-sale + rental construction is in the pipeline within 1–3 miles? Heavy new supply typically softens prices + rents 12–24 months out; constrained supply supports both.
Investment metrics
- 1% rule
- 2.19% ✓
- Cap rate
- 19.88%
- Cash-on-cash
- 48.54%
- DSCR
- 3.16
- GRM
- 3.8
CMA / ARV
- ARV (median comp)
- $97,269
- List price
- $64,989
- Delta
- -33.19%
- Verdict
- UNDERPRICED
- Comps
- 2 within 1.0 mi
Projected returns pro-forma
-3.0% appreciation · 3.0% rent growth · sell at horizon
- IRR
- 46.0%
- Equity multiple
- 3.00×
- Total profit
- $36,328
- Equity at exit
- $9,690
- IRR
- 51.8%
- Equity multiple
- 6.05×
- Total profit
- $91,924
- Equity at exit
- $5,619
Cash invested: $18,197 (down + closing). Projections, not guarantees.
Landlord ↔ Tenant lean methodology
- Overall (STATE)
- 87 Strongly Landlord-Friendly
- State Texas
- 87 Strongly Landlord-Friendly · R+5
- County
- — inherits STATE
- City
- — inherits STATE
ZIP-level market 75670
- Home prices YoY
- -33.8%
- Active inventory
- 144
- Price-to-rent
- 3.8×
Monthly cashflow live
- Estimated rent
- $1,421 medium interval (Pro) →
- Mortgage (P&I)
- −$341
- Tax from tax record
- −$18 /mo · $220/yr
- Insurance
- −$27
- HOA
- −$0
- Lot rent
- −$0
- Vacancy / Maint / Mgmt
- −$298
- Net cashflow
- $736
Break-even live
Sensitivity live
| Price | -10% $773 | -5% $754 | +0% $736 | +5% $718 | +10% $699 |
|---|---|---|---|---|---|
| Rent | -10% $624 | -5% $680 | +0% $736 | +5% $792 | +10% $848 |
| Rate | -1.0pp $769 | -0.5pp $753 | base $736 | +0.5pp $719 | +1.0pp $702 |
UW: 25.0% down · 7.5% · 30yr · 1.5% tax · 5.0% vac · 8.0% maint · 8.0% mgmt
Financing live
Cash to close
- Down payment
- $16,247
- Closing costs
- $1,950
- Reserves months
- —
- Total cash needed
- —
Loan-product check · same deal, 3 products live
Conventional
25% down · 7.5% · 30yr
- Down + closing
- —
- Monthly P&I
- —
- Monthly cashflow
- —
- DSCR
- —
- Eligible?
- —
Personal DTI + credit; lowest rate.
DSCR
20% down · 8.5% · 30yr
- Down + closing
- —
- Monthly P&I
- —
- Monthly cashflow
- —
- DSCR
- —
- Eligible?
- —
No personal income docs; deal must DSCR.
Hard money
10% down · 12.0% · 12mo
- Down + closing
- —
- Monthly P&I
- —
- Monthly cashflow
- —
- DSCR
- —
- Eligible?
- —
Short-term bridge; refi at stabilization.
Rent comps 3 comps
| Address | Beds | Baths | Sqft | Rent | $/sqft | DOM | Units | Dist |
|---|---|---|---|---|---|---|---|---|
| 2707 Norwood St Marshall, TX | 1.0–3.0 | 1.0–2.0 | 971 | $1,290 | $1.33 | 15d | 16 | 0.89mi |
| 1103 Elm St Marshall, TX | 3.0 | 1.0 | 1439 | $1,662 | $1.15 | 46d | 1 | 1.20mi |
| 1101 James Farmer St Marshall, TX | 4.0 | 2.0 | 1350 | $1,650 | $1.22 | 15d | 1 | 1.42mi |
Listing history 21 events
-
2026-06-21days on market $64,989 Active 578 DOM
-
2026-06-19days on market $64,989 Active 576 DOM
-
2026-06-18days on market $64,989 Active 575 DOM
-
2026-06-17days on market $64,989 Active 574 DOM
-
2026-06-16days on market $64,989 Active 573 DOM
-
2026-06-15days on market $64,989 Active 572 DOM
-
2026-06-14days on market $64,989 Active 570 DOM
-
2026-06-13days on market $64,989 Active 569 DOM
-
2026-06-10days on market $64,989 Active 567 DOM
-
2026-06-09days on market $64,989 Active 566 DOM
-
2026-06-08days on market $64,989 Active 565 DOM
-
2026-06-07days on market $64,989 Active 564 DOM
-
2026-06-02days on market $64,989 Active 559 DOM
-
2026-06-01days on market $64,989 Active 558 DOM
-
2026-05-31days on market $64,989 Active 557 DOM
-
2026-05-30days on market $64,989 Active 556 DOM
-
2024-11-20historical
Show marketing remark (985 chars)
INVESTOR SPECIAL! 1407 Madam queen is a nice home sitting on almost an entire acre of land available in Marshall, TX! This is an investor special that requires a little bit of work, but has potential. The single-story property features an open floorplan that you can easily build off of. A large kitchen space, spacious bedrooms, and many unique details throughout the property. The home also has an extended covered porch area that's perfect for outdoor lounging. There is also plenty of yard space for all kinds of outdoor activities. This location offers you easy access to HWY 390 & HWY 80. You will also be minutes away from East Texas Baptist University. A prime location surrounded by many convenience, dining and shopping options. Being sold AS IS. We make it easy to own. This is a great opportunity! Don't wait, call us today to get more information on the owner's easy terms and smooth process that may be able to put the deed in your name and make this your dream home.
-
2024-11-20$64,989 Active 985-char remark
Show marketing remark (985 chars)
INVESTOR SPECIAL! 1407 Madam queen is a nice home sitting on almost an entire acre of land available in Marshall, TX! This is an investor special that requires a little bit of work, but has potential. The single-story property features an open floorplan that you can easily build off of. A large kitchen space, spacious bedrooms, and many unique details throughout the property. The home also has an extended covered porch area that's perfect for outdoor lounging. There is also plenty of yard space for all kinds of outdoor activities. This location offers you easy access to HWY 390 & HWY 80. You will also be minutes away from East Texas Baptist University. A prime location surrounded by many convenience, dining and shopping options. Being sold AS IS. We make it easy to own. This is a great opportunity! Don't wait, call us today to get more information on the owner's easy terms and smooth process that may be able to put the deed in your name and make this your dream home.
-
2024-09-09price $64,989
-
2022-08-22price $66,999
-
2020-12-10$69,999 Active
ⓘ Source: listings_history table (triggers on properties + properties_extension) + one-shot
backfill from property_details.listing_events for pre-trigger history.
Tax reassessment forecast TX · Resets to sale price
- Current annual tax
- $220 · $18/mo
- Projected year-2 tax
- $1,189 · $99/mo
- Expected delta
- +$969/yr (+$81/mo · 440.0%)
ⓘ Screening estimate from a state-policy table — verify with the county assessor before closing.
Nearby sold comps map
Loading sold comps map…
Walkable amenities ~0.75 mi
Loading nearby amenities…
Taxation est. · year 1
- Rental income
- $17,047
- − Mortgage interest
- −$3,640
- − Property taxes
- −$220
- − Insurance
- −$325
- − Repairs & maintenance
- −$1,364
- − Management
- −$1,364
- − Depreciation
- −$1,891
- Taxable income
- $8,243
- Est. tax owed @ 24.0%
- −$1,978
- After-tax cash flow
- $6,854/yr
For passive investors: Depreciation is non-cash, so a rental often shows a tax loss while cash-flowing — sheltering income. Rental losses are passive: they offset passive income freely, and up to $25,000/yr can offset ordinary (W-2) income if you actively participate and your MAGI is under $100k (phasing out to $0 by $150k); unused losses carry forward. On sale, claimed depreciation is recaptured at up to 25%, and gains may owe capital-gains tax (a 1031 exchange can defer both). Figures are a year-1 estimate at your 24.0% rate — not tax advice; consult a CPA.
Schools (NCES district)
- District
- Marshall ISD
- NCES district ID
- 4829160
- Math proficiency
- 29% ▼ -7.00%
- Reading proficiency
- 29% ▼ -7.00%
- Median HH income
- $40,095
- Composite
- 24.43/100
- National rank
- #7680
- State rank
- #658 of 826 in TX
Livability — Marshall
- Score
- 68/100
- State rank
- #451
- US rank
- #9156
Category grades
Schools grade is shown separately in the Schools card above.
Census & demographics
- Census place
- Marshall, TX
- County
- Harrison County · 18,670 people
- City population
- 18,670
- Metro
- Longview, TX
- Population (ZIP)
- 18,670
- Household income
- $42,386
- Rent vs Own
- Severe rent burden
- 598.0
Population outlook (Harrison County) Hauer SSP2
- Today (2025)
- 68,691 people
- By 2030
- 69,317 · +0.9%
- By 2040
- 69,973 · +1.9%
- By 2050
- 70,090 · +2.0%
- By 2075
- 70,607 · +2.8%
- By 2100
- 67,546 · -1.7%
Race, ethnicity, and origin ACS 2023
- Neighborhood character
- Diverse neighborhood (Simpson 0.67)
- Race & ethnicity
- Black 39% White 35% Hispanic / Latino 23% Two or more races 11%
- Hispanic origin (detail)
- Mexican 22%
- Common ancestry
- Lithuanian 1% Italian 1% Slovak 1%
- Foreign-born
- 6% · Canada
- Languages at home
- 85% English-only · Spanish 14%
Political lean MEDSL · Harrison
- 2024 margin
- Solid R (+50.6) · D 24.4% · R 75.0%
- 2008→2024 swing
- -19.2pp toward R · 2008: -31.4pp · 2024: -50.6pp
- All cycles
- 2024: R+50.6 2020: R+45.6 2016: R+43.9 2012: R+34.6 2008: R+31.4
Not yet ingested
- Civics
- —
Market trends
- HPI YoY
- ▼ -51.33%
- Current HPI
- 100.3741
- Rent YoY
- —
- Metro
- Longview, TX
- State GDP YoY
- ▲ 3.95%
- F500 in state
- 110
Industry mix (Fortune 500 HQ in TX)
| Industry | F500 HQs | Revenue |
|---|---|---|
| Energy | 16 | $1,198B |
|
||
| Technology | 5 | $198B |
|
||
| Engineering / Construction | 4 | $72B |
|
||
| Energy Services | 3 | $60B |
|
||
| Utilities | 3 | $41B |
|
||
| Healthcare | 2 | $330B |
|
||
Price history
-7.2% since first listed5 events — show timeline
- 2024-11-20 Listed $64,989 HARMLS
- 2024-11-20 Listing Removed — HARMLS
- 2024-09-09 Price Changed $64,989 HARMLS
- 2022-08-22 Price Changed $66,999 HARMLS
- 2020-12-10 Listed $69,999 HARMLS
Property tax history
-6.2%/yrLatest (2025): $220 · +18.9% YoY. Source: county tax records.
Cash-flow waterfall
monthlySold comps — $/sqft
last 12 mo · ≤1 miLoading sold comps…