 Multi-family
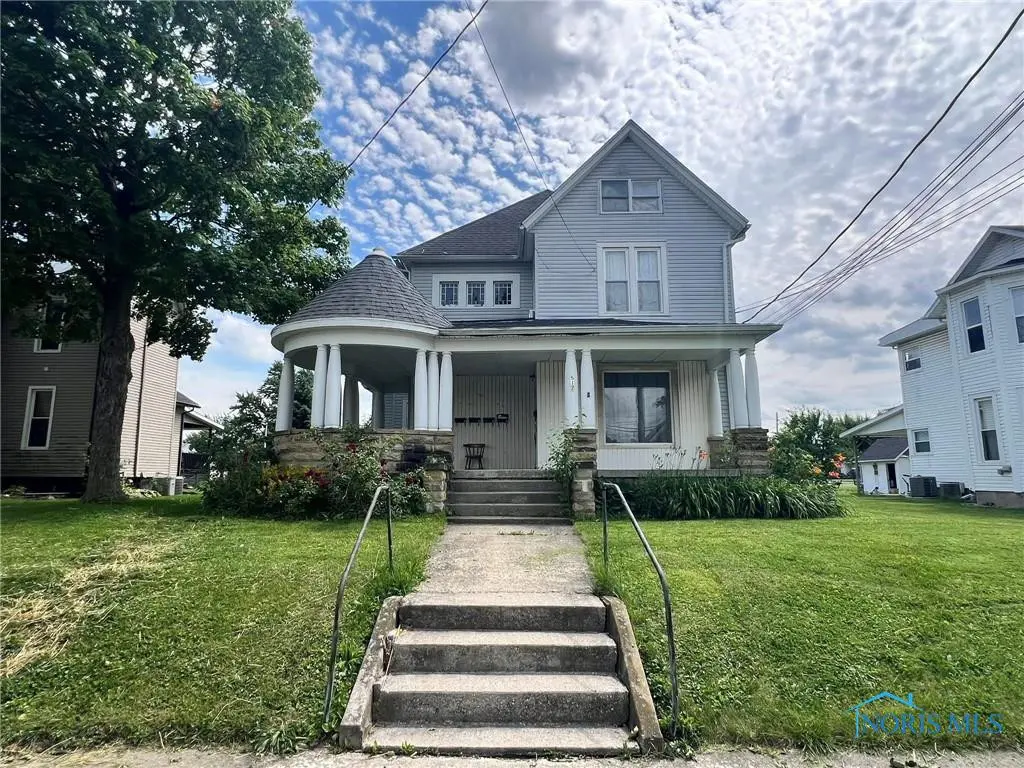
517 E Findlay St · Carey, OH
Flood risk 1/10 · Minimal
- FEMA flood zone
- X
- Chance of flooding over 30 yrs
- 0.0%
- Est. flood insurance / yr
- $507 – $1,088
Fire risk 1/10 · Minimal
- Est. fire insurance / yr
- $713 – $1,323
Heat risk 3/10 · Minor
- Hot days now (above 99°F)
- 7 days/yr
- Hot days in 30 yrs
- 17 days/yr
Wind risk 2/10 · Minimal
- Chance of severe wind over 30 yrs
- —
Air-quality risk 2/10 · Minimal
- Unhealthy air days now
- 1 days/yr
- Unhealthy air days in 30 yrs
- 2 days/yr
Risk factors via First Street. Map © Google.
Why this score? — see what drove the B- grade
The composite is a weighted blend of 9 inputs, each scored 0–100. Each bar is that input's sub-score; the figure is the points it added to the 100-point composite (weight × sub-score).
- Cash flow +28.9/30.0
- DSCR +10.0/10.0
- 1% rule +7.4/10.0
- ARV discount +6.3/15.0
- Schools +4.7/10.0
- Livability +3.7/5.0
- Rent growth +2.5/5.0
- Condition / age +2.5/5.0
- Appreciation +0.0/10.0
$219,900
🖨 Deal sheet (PDF) 📄 Offer letter ✓ Due diligence
Multi-family units
County records classify this as Multi-Family (5+ Unit). Listing-text estimate: 1 unit. estimate disagrees with records
5+ unit building — per-unit beds/baths from public records are typically unavailable; the breakdown below (if shown) is an estimate from the listing text.
Listing remarks MLS
Great investment opportunity. 5 units all rented. Great rental history. Back lot parking and street parking available. Barn for storage or could also be rented out. Tenant rights apply.
Key facts
- Rented units
- Rental history
- Barn for storage
Tags
Neighborhood map
What this means for you Summary
Snapshot
- This is a 5-bed/5.0-bath multifamily listed at $220k.
Deal economics
- At list price, monthly cash flow is $743 ($9k/yr) — positive.
- The deal already cash-flows at list — no discount required.
- Meets the 1% rule at list price ($3k rent vs $220k).
- Recommended offer: $194k (12.0% below list) — sets the bar for market timing.
Location & tenants
- Location reads 73/100 on livability (#320 in OH) — a middle-class / working-renter tenant base. Strengths: cost of living A+, housing A+, crime A; Watch: amenities F, commute F, health & safety F.
- Carey Exempted Village Schools (town): math 54% / reading 57% proficiency, ranked #363 of 656 in OH (top 55%) — acceptable for families but not a draw, mixed tenant base, ~2y average lease.
- Zoned schools: Carey Elementary School (math 67% / reading 62%, grade B, #522 of 1,584 statewide, top 36%, 369 students, 43% FRL); Carey High School (math 44% / reading 53%, grade D, #427 of 781 statewide, top 55%, 463 students, 21% FRL).
- Market conditions: 16 active listings in the ZIP; solid renter incomes; 20 units permitted in Wyandot County in 2024 (0 in 5+ unit buildings).
- This rent runs 43% of the median local income ($77k/yr) — at the standard rent-burdened threshold; future hikes will face affordability resistance.
Forward outlook
- Local home prices are declining (-3.0%/yr); year-one equity from $2k of loan paydown is wiped out by about $7k of value loss. Plan a longer hold.
- Wyandot County population projected at -17% by 2050 — secular population decline; favor cash flow + early exit over multi-decade hold.
- At projected returns (-3.0% appreciation + 3.0% rent growth), your $62k cash investment doubles in ~9 years — after that, you're playing with house money.
Negotiation context
- It's been on market 254 days — a 12% lower offer ($194k) is reasonable based on typical stale-listing flexibility.
- 14 sale attempts since 15y ago with the ask held roughly flat each time — persistent listings suggest the price (not the market) is what's stuck; bring a comps-based counter.
- Current owner paid $80k; list at $220k implies a 175% gain — meaningful room to come down on a strong offer.
Risks & watch-outs
- Watch-outs: built in 1910 — expect roof / HVAC / electrical / plumbing capex.
Questions for the listing agent
- It's been on market 254 days. Have you received any prior offers? Is the seller open to a 12% concession, seller financing, or rate buy-down credit?
- Built in 1910 — when were the roof, HVAC, electrical panel, plumbing, and water heater last replaced?
- Why hasn't it sold? Are there any deal-killer items the seller is aware of (foundation, flood, title, zoning, code violations)?
- Is there a deadline driving the sale (1031 exchange, divorce, estate, relocation)? That informs how much negotiation room exists.
- Schools are B-rated — typically a magnet for longer-tenancy family renters. What's the average tenant stay here, and is there a school-zone premium baked into asking?
- What's the average days-on-market for RENTAL listings here right now (not sales)? A rising rental-DOM trend means longer vacancies and softer asking-rent achievability than the comps imply.
- What's the recent tenant-quality profile in this submarket — average credit score on applications, eviction rate, late-payment / NSF rate, and stable-employment percentage? A property-management company in the area should have these aggregated.
- How much new apartment / multifamily construction is in the pipeline within 1–3 miles? Heavy new supply (>2% of stock underway) typically softens rents 12–24 months out; light construction supports rent growth.
Investment metrics
- 1% rule
- 1.24% ✓
- Cap rate
- 10.35%
- Cash-on-cash
- 14.47%
- DSCR
- 1.64
- GRM
- 6.7
CMA / ARV
- ARV (median comp)
- $214,359
- List price
- $219,900
- Delta
- 2.58%
- Verdict
- FAIR
- Comps
- 2 within 1.0 mi
Projected returns pro-forma
-3.0% appreciation · 3.0% rent growth · sell at horizon
- IRR
- 4.9%
- Equity multiple
- 1.19×
- Total profit
- $11,641
- Equity at exit
- $32,788
- IRR
- 14.3%
- Equity multiple
- 2.15×
- Total profit
- $70,937
- Equity at exit
- $19,013
Cash invested: $61,572 (down + closing). Projections, not guarantees.
Landlord ↔ Tenant lean methodology
- Overall (STATE)
- 73 Landlord-Friendly
- State Ohio
- 73 Landlord-Friendly · R+6
- County
- — inherits STATE
- City
- — inherits STATE
ZIP-level market 43316
- Home prices YoY
- -18.0%
- Active inventory
- 16
- Price-to-rent
- 33.6×
Monthly cashflow live
- Estimated rent
- $2,725 medium interval (Pro) →
- Mortgage (P&I)
- −$1,153
- Tax from tax record
- −$165 /mo · $1,983/yr
- Insurance
- −$92
- HOA
- −$0
- Vacancy / Maint / Mgmt
- −$572
- Net cashflow
- $743
Break-even live
Sensitivity live
| Price | -10% $867 | -5% $805 | +0% $743 | +5% $680 | +10% $618 |
|---|---|---|---|---|---|
| Rent | -10% $527 | -5% $635 | +0% $743 | +5% $850 | +10% $958 |
| Rate | -1.0pp $853 | -0.5pp $799 | base $743 | +0.5pp $686 | +1.0pp $628 |
5-unit breakdown (identical units grouped — click to expand)
| Units | Beds | Baths | Est. rent |
|---|---|---|---|
| 5× units | 1 | 1 | $2,725 |
| #1 | 1 | 1 | $545 |
| #2 | 1 | 1 | $545 |
| #3 | 1 | 1 | $545 |
| #4 | 1 | 1 | $545 |
| #5 | 1 | 1 | $545 |
| Total (5 units) | $2,725 | ||
UW: 25.0% down · 7.5% · 30yr · 1.5% tax · 5.0% vac · 8.0% maint · 8.0% mgmt
Financing live
Cash to close
- Down payment
- $54,975
- Closing costs
- $6,597
- Reserves months
- —
- Total cash needed
- —
Loan-product check · same deal, 3 products live
Conventional
25% down · 7.5% · 30yr
- Down + closing
- —
- Monthly P&I
- —
- Monthly cashflow
- —
- DSCR
- —
- Eligible?
- —
Personal DTI + credit; lowest rate.
DSCR
20% down · 8.5% · 30yr
- Down + closing
- —
- Monthly P&I
- —
- Monthly cashflow
- —
- DSCR
- —
- Eligible?
- —
No personal income docs; deal must DSCR.
Hard money
10% down · 12.0% · 12mo
- Down + closing
- —
- Monthly P&I
- —
- Monthly cashflow
- —
- DSCR
- —
- Eligible?
- —
Short-term bridge; refi at stabilization.
Listing history 50 events
-
2026-06-22days on market $219,900 Active 254 DOM
-
2026-06-21days on market $219,900 Active 253 DOM
-
2026-06-21days on market $219,900 Active 252 DOM
-
2026-06-18days on market $219,900 Active 250 DOM
-
2026-06-17days on market $219,900 Active 249 DOM
-
2026-06-16days on market $219,900 Active 248 DOM
-
2026-06-15days on market $219,900 Active 247 DOM
-
2026-06-13days on market $219,900 Active 245 DOM
-
2026-06-12days on market $219,900 Active 244 DOM
-
2026-06-09days on market $219,900 Active 242 DOM
-
2026-06-08days on market $219,900 Active 241 DOM
-
2026-06-07days on market $219,900 Active 240 DOM
-
2026-06-07days on market $219,900 Active 239 DOM
-
2026-06-04days on market $219,900 Active 236 DOM
-
2026-06-02days on market $219,900 Active 235 DOM
-
2026-06-01days on market $219,900 Active 234 DOM
-
2026-05-31days on market $219,900 Active 233 DOM
-
2026-05-18price $219,900 185-char remark
Show marketing remark (185 chars)
Great investment opportunity. 5 units all rented. Great rental history. Back lot parking and street parking available. Barn for storage or could also be rented out. Tenant rights apply.
-
2026-01-19price $225,000 185-char remark
Show marketing remark (185 chars)
Great investment opportunity. 5 units all rented. Great rental history. Back lot parking and street parking available. Barn for storage or could also be rented out. Tenant rights apply.
-
2025-10-14historical
-
2025-10-14historical
-
2025-10-09$227,900 Active 185-char remark
Show marketing remark (185 chars)
Great investment opportunity. 5 units all rented. Great rental history. Back lot parking and street parking available. Barn for storage or could also be rented out. Tenant rights apply.
-
2025-10-06historical
-
2025-08-12price $228,900
-
2025-05-07price $229,900
-
2025-04-07price $234,500
-
2025-03-05$239,500 Active
-
2025-02-04historical
-
2024-10-31$235,900 Active
-
2024-10-29historical
-
2024-07-30price $239,500
-
2024-06-18price $244,500
-
2024-02-20price $249,900
-
2024-01-16status Active
-
2024-01-16historical
-
2024-01-12historical
-
2024-01-11$267,400 Active
-
2023-12-26$309,999 Active
-
2023-12-22historical
-
2020-08-04soldstatus $80,000
-
2020-07-31soldstatus $80,000
-
2020-05-05$80,000
-
2017-06-20soldstatus $100,000
-
2017-05-16historical
-
2017-05-16historical
-
2016-11-16$115,000
-
2016-11-16$115,000
-
2016-11-16$115,000
-
2012-03-26historical
-
2011-12-05historical
ⓘ Source: listings_history table (triggers on properties + properties_extension) + one-shot
backfill from property_details.listing_events for pre-trigger history.
Tax reassessment forecast OH · Partial reset (capped growth)
- Current annual tax
- $1,983 · $165/mo
- Projected year-2 tax
- $2,707 · $226/mo
- Expected delta
- +$724/yr (+$60/mo · 36.5%)
ⓘ Screening estimate from a state-policy table — verify with the county assessor before closing.
Climate risk First Street
- Flood 1/10 Low FEMA zone X · 0% chance over 30 yrs
- Wildfire 1/10 Low
- Heat 3/10 Moderate 7 d/yr ≥99°F today · 17 d/yr by 30 yrs out
- Wind 2/10 Low
- Air quality 2/10 Low 1 unhealthy d/yr today · 2 by 30 yrs out
Nearby sold comps map
Loading sold comps map…
Walkable amenities ~0.75 mi
Loading nearby amenities…
Taxation est. · year 1
- Rental income
- $32,700
- − Mortgage interest
- −$12,318
- − Property taxes
- −$1,983
- − Insurance
- −$1,100
- − Repairs & maintenance
- −$2,616
- − Management
- −$2,616
- − Depreciation
- −$6,397
- Taxable income
- $5,670
- Est. tax owed @ 24.0%
- −$1,361
- After-tax cash flow
- $7,551/yr
For passive investors: Depreciation is non-cash, so a rental often shows a tax loss while cash-flowing — sheltering income. Rental losses are passive: they offset passive income freely, and up to $25,000/yr can offset ordinary (W-2) income if you actively participate and your MAGI is under $100k (phasing out to $0 by $150k); unused losses carry forward. On sale, claimed depreciation is recaptured at up to 25%, and gains may owe capital-gains tax (a 1031 exchange can defer both). Figures are a year-1 estimate at your 24.0% rate — not tax advice; consult a CPA.
Schools (NCES district)
- District
- Carey Exempted Village Schools
- NCES district ID
- 3904526
- Math proficiency
- 54% ▼ -8.00%
- Reading proficiency
- 57% ▼ -8.00%
- Median HH income
- $47,153
- Composite
- 47.07/100
- National rank
- #2336
- State rank
- #363 of 656 in OH
Livability — Carey
- Score
- 73/100
- State rank
- #320
- US rank
- #5239
Category grades
Schools grade is shown separately in the Schools card above.
Census & demographics
- Census place
- Carey, OH
- County
- Wyandot · 23,050 people
- City population
- 6,095
- Population (ZIP)
- 6,095
- Household income
- $76,813
- Rent vs Own
- Severe rent burden
- 7.1
Population outlook (Wyandot County) Hauer SSP2
- Today (2025)
- 21,485 people
- By 2030
- 20,883 · -2.8%
- By 2040
- 19,425 · -9.6%
- By 2050
- 17,815 · -17.1%
- By 2075
- 14,208 · -33.9%
- By 2100
- 10,744 · -50.0%
Race, ethnicity, and origin ACS 2023
- Neighborhood character
- Predominantly White (98%)
- Race & ethnicity
- White 98% Two or more races 1%
- Common ancestry
- Romanian 1% Italian 1% Serbian 1%
- Foreign-born
- 0% · China
Political lean MEDSL · Wyandot
- 2024 margin
- Solid R (+51.2) · D 24.0% · R 75.2%
- 2008→2024 swing
- -34.7pp toward R · 2008: -16.5pp · 2024: -51.2pp
- All cycles
- 2024: R+51.2 2020: R+50.3 2016: R+46.8 2012: R+20.4 2008: R+16.5
Not yet ingested
- Civics
- —
Market trends
- HPI YoY
- ▼ -50.77%
- Current HPI
- 230.8394
- Rent YoY
- —
- Metro
- —
- State GDP YoY
- ▲ 1.98%
- F500 in state
- 48
Industry mix (Fortune 500 HQ in OH)
| Industry | F500 HQs | Revenue |
|---|---|---|
| Insurance | 3 | $145B |
|
||
| Industrial Machinery | 3 | $49B |
|
||
| Financial Services | 3 | $24B |
|
||
| Consumer Goods | 2 | $93B |
|
||
| Aerospace / Defense | 2 | $47B |
|
||
| Utilities | 2 | $33B |
|
||
Price history
+99.9% since first listed38 events — show timeline
- 2026-05-18 Price Changed $219,900 NORIS
- 2026-01-19 Price Changed $225,000 NORIS
- 2025-10-14 Listing Removed — NORIS
- 2025-10-14 Listing Removed — NORIS
- 2025-10-09 Listed $227,900 NORIS
- 2025-10-06 Listing Removed — NORIS
- 2025-08-12 Price Changed $228,900 NORIS
- 2025-05-07 Price Changed $229,900 NORIS
- 2025-04-07 Price Changed $234,500 NORIS
- 2025-03-05 Listed $239,500 NORIS
- 2025-02-04 Listing Removed — NORIS
- 2024-10-31 Listed $235,900 NORIS
- 2024-10-29 Listing Removed — NORIS
- 2024-07-30 Price Changed $239,500 NORIS
- 2024-06-18 Price Changed $244,500 NORIS
- 2024-02-20 Price Changed $249,900 NORIS
- 2024-01-16 Relisted — NORIS
- 2024-01-16 Listing Removed — NORIS
- 2024-01-12 Listing Removed — NORIS
- 2024-01-11 Listed $267,400 NORIS
- 2023-12-26 Listed $309,999 NORIS
- 2023-12-22 Coming Soon — NORIS
- 2020-08-04 Sold (Public Records) $80,000 Public Records
- 2020-07-31 Sold (MLS) $80,000 NORIS
- 2020-05-05 Listed $80,000 NORIS
- 2017-06-20 Sold (Public Records) $100,000 Public Records
- 2017-05-16 Listing Removed — NORIS
- 2017-05-16 Listing Removed — NORIS
- 2016-11-16 Listed $115,000 NORIS
- 2016-11-16 Listed $115,000 NORIS
- 2016-11-16 Listed $115,000 WCARE
- 2012-03-26 Listing Removed — NORIS
- 2011-12-05 Listing Removed — NORIS
- 2011-12-04 Listed $150,000 NORIS
- 2011-12-04 Listed $150,000 NORIS
- 2011-03-27 Listed $150,000 NORIS
- 2011-03-27 Listed $150,000 NORIS
- 2001-04-02 Sold (Public Records) $110,000 Public Records
Property tax history
+2.9%/yrLatest (2025): $1,983 · +62.1% YoY. Source: county tax records.
Cash-flow waterfall
monthlySold comps — $/sqft
last 12 mo · ≤1 miLoading sold comps…