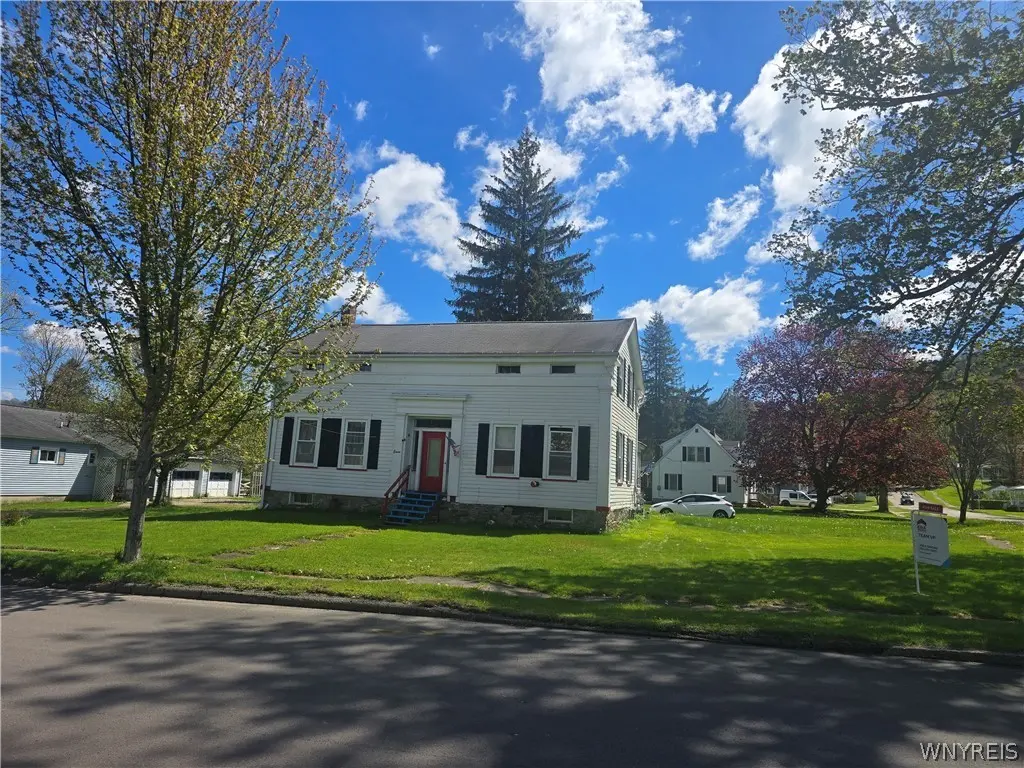
11 Grace St · Cuba, NY
Flood risk 8/10 · Major
- FEMA flood zone
- X
- Chance of flooding over 30 yrs
- 0.99%
- Est. flood insurance / yr
- $473 – $860
Fire risk 1/10 · Minimal
- Est. fire insurance / yr
- $691 – $1,283
Heat risk 2/10 · Minimal
- Hot days now (above 89°F)
- 8 days/yr
- Hot days in 30 yrs
- 18 days/yr
Wind risk 1/10 · Minimal
- Chance of severe wind over 30 yrs
- —
Air-quality risk 1/10 · Minimal
- Unhealthy air days now
- 0 days/yr
- Unhealthy air days in 30 yrs
- 0 days/yr
Risk factors via First Street. Map © Google.
Why this score? — see what drove the B+ grade
The composite is a weighted blend of 9 inputs, each scored 0–100. Each bar is that input's sub-score; the figure is the points it added to the 100-point composite (weight × sub-score).
- Cash flow +30.0/30.0
- 1% rule +10.0/10.0
- DSCR +10.0/10.0
- Appreciation +8.6/10.0
- ARV discount +7.5/15.0
- Schools +4.5/10.0
- Livability +3.7/5.0
- Rent growth +2.5/5.0
- Condition / age +2.5/5.0
$40,000
🖨 Deal sheet (PDF) 📄 Offer letter ✓ Due diligence
Listing remarks
Huge house for little money. This is needs some major attention but the space is there. It is located on a neighborhood street in Cuba, NY This is a true colonial house with small 2nd story wondows, sometimes called eyebrow windows. The garage is in bad condion and might need to be torn down. The kitchen is huge and a big living room, plus a big bedroom om the first floor. If you want to restore a historic house, take a look at this one! More ictures will be coming. The taxes can be lowered after purchase
Key facts
- 0.37 acre lot
- Garage
- Built 1900
Property features AI
Exterior
- Parking: Attached garage (1 car)
- Utilities: Sewer connected; Public water available
- Home design: Single-story home; Existing/resale property
- Construction: Frame construction with wood siding; Metal roof; Stone foundation; Built previously (existing)
- Exterior features: Dirt driveway; Rectangular residential lot; City street frontage; Lot dimensions approximately 84 x 157 feet
Interior
- Kitchen: Appliances negotiable; Gas water heater
- Bedrooms: One bedroom on the main level
- Flooring: Carpet; Varied flooring
- Bathrooms: One full bathroom (main level)
- Heating & cooling: Gas forced-air heating
- Interior features: Leaded glass windows; Eat-in kitchen; Separate/formal living room; Country-style kitchen
Neighborhood map
What this means for you Summary
Snapshot
- This is a 3-bed/2.5-bath single-family listed at $40k.
Deal economics
- At list price, monthly cash flow is $592 ($7k/yr) — positive.
- The deal already cash-flows at list — no discount required.
- Meets the 1% rule at list price ($1k rent vs $40k).
- Recommended offer: $39k (1.5% below list) — sets the bar for market timing.
- Cap rate 25.7% vs local median 3.1% in Cuba — top-decile yield for the area; either an underpriced asset or a hidden risk that comps aren't pricing in. Stress-test before assuming the spread holds.
Location & tenants
- Location reads 73/100 on livability (#309 in NY) — a middle-class / working-renter tenant base. Strengths: cost of living A+, housing A+, health & safety A; Watch: employment D, amenities F, commute F.
- Cuba-Rushford Central School District (rural): math 44% / reading 61% proficiency, ranked #350 of 590 in NY (top 59%) — acceptable for families but not a draw, mixed tenant base, ~2y average lease.
- Market conditions: 43 active listings in the ZIP; 87 units permitted in Allegany County in 2024 (0 in 5+ unit buildings).
Forward outlook
- In year one you build about $3k of equity ($277 loan paydown + $3k appreciation (7.2% local appreciation)).
- Allegany County population projected at -26% by 2050 — secular population decline; favor cash flow + early exit over multi-decade hold.
- At projected returns (7.2% appreciation + 3.0% rent growth), your $11k cash investment doubles in ~2 years — after that, you're playing with house money.
- By year 10, paydown + projected appreciation supports a ~$34k cash-out refi (75% LTV) — recoverable capital for the next deal without selling this one.
Negotiation context
- It's been on market 21 days — a 2% lower offer ($39k) is reasonable based on typical stale-listing flexibility.
Risks & watch-outs
- Watch-outs: flood insurance adds $56/mo; built in 1900 — expect roof / HVAC / electrical / plumbing capex.
- Climate carrying-cost: severe flood risk — expect insurance premiums to compound above CPI over the hold.
Questions for the listing agent
- Built in 1900 — when were the roof, HVAC, electrical panel, plumbing, and water heater last replaced?
- What's the actual annual flood-insurance premium (NFIP or private), and is the property in a SFHA with mandatory coverage?
- Is there a deadline driving the sale (1031 exchange, divorce, estate, relocation)? That informs how much negotiation room exists.
- Schools are B-rated — typically a magnet for longer-tenancy family renters. What's the average tenant stay here, and is there a school-zone premium baked into asking?
- What's the average days-on-market for RENTAL listings here right now (not sales)? A rising rental-DOM trend means longer vacancies and softer asking-rent achievability than the comps imply.
- What's the recent tenant-quality profile in this submarket — average credit score on applications, eviction rate, late-payment / NSF rate, and stable-employment percentage? A property-management company in the area should have these aggregated.
- How much new for-sale + rental construction is in the pipeline within 1–3 miles? Heavy new supply typically softens prices + rents 12–24 months out; constrained supply supports both.
Investment metrics
- 1% rule
- 2.92% ✓
- Cap rate
- 25.72%
- Cash-on-cash
- 69.39%
- DSCR
- 4.09
- GRM
- 2.8
CMA / ARV
- ARV (median comp)
- $189,968
- List price
- $40,000
- Delta
- -78.94%
- Verdict
- UNDERPRICED
- Comps
- 15 within 1.0 mi
Show comp detail 3 sales within ~0.75 mi
| Address | Dist | Beds/Ba | Sqft | Sold | Price | $/sf | Match |
|---|---|---|---|---|---|---|---|
| 13 Prospect St | 0.48mi | 3/2.0 | 2,250 (-3%) | 10mo | $179,000 | $80 | 62 |
| 101 E Main St | 0.26mi | 4/2.5 (+1) | 2,524 (+8%) | 19mo | $154,000 | $61 | 53 |
| 136 South St | 0.68mi | 4/3.0 (+1) | 2,060 (-12%) | 4mo | $270,000 | $131 | 39 |
Match score weights: distance 35% · size 25% · config 20% · recency 20%. Top-matched comps best support the ARV.
Projected returns pro-forma
7.17% appreciation · 3.0% rent growth · sell at horizon
- IRR
- 72.4%
- Equity multiple
- 5.66×
- Total profit
- $52,147
- Equity at exit
- $28,160
- IRR
- 68.6%
- Equity multiple
- 12.02×
- Total profit
- $123,423
- Equity at exit
- $53,897
Cash invested: $11,200 (down + closing). Projections, not guarantees.
Landlord ↔ Tenant lean methodology
- Overall (STATE)
- 15 Strongly Tenant-Friendly
- State New York
- 15 Strongly Tenant-Friendly · D+10
- County
- — inherits STATE
- City
- — inherits STATE
ZIP-level market 14727
- Home prices YoY
- 2.5%
- Active inventory
- 43
- Price-to-rent
- 2.8×
Monthly cashflow live
- Estimated rent
- $1,170 medium interval (Pro) →
- Mortgage (P&I)
- −$210
- Tax est. 1.5%
- −$50 /mo · $600/yr
- Insurance
- −$17
- Flood insurance flood zone
- −$56 /mo · $666/yr
- HOA
- −$0
- Vacancy / Maint / Mgmt
- −$246
- Net cashflow
- $592
Break-even live
Sensitivity live
| Price | -10% $620 | -5% $606 | +0% $592 | +5% $578 | +10% $564 |
|---|---|---|---|---|---|
| Rent | -10% $500 | -5% $546 | +0% $592 | +5% $638 | +10% $685 |
| Rate | -1.0pp $612 | -0.5pp $602 | base $592 | +0.5pp $582 | +1.0pp $571 |
UW: 25.0% down · 7.5% · 30yr · 1.5% tax · 5.0% vac · 8.0% maint · 8.0% mgmt
Financing live
Cash to close
- Down payment
- $10,000
- Closing costs
- $1,200
- Reserves months
- —
- Total cash needed
- —
Loan-product check · same deal, 3 products live
Conventional
25% down · 7.5% · 30yr
- Down + closing
- —
- Monthly P&I
- —
- Monthly cashflow
- —
- DSCR
- —
- Eligible?
- —
Personal DTI + credit; lowest rate.
DSCR
20% down · 8.5% · 30yr
- Down + closing
- —
- Monthly P&I
- —
- Monthly cashflow
- —
- DSCR
- —
- Eligible?
- —
No personal income docs; deal must DSCR.
Hard money
10% down · 12.0% · 12mo
- Down + closing
- —
- Monthly P&I
- —
- Monthly cashflow
- —
- DSCR
- —
- Eligible?
- —
Short-term bridge; refi at stabilization.
Listing history 6 events
-
2026-06-07statusdays on market $40,000 Pending 21 DOM
-
2026-06-04days on market $40,000 Active 19 DOM
-
2026-06-02days on market $40,000 Active 18 DOM
-
2026-06-01days on market $40,000 Active 17 DOM
-
2026-05-31days on market $40,000 Active 16 DOM
-
2026-05-14$40,000 Active 510-char remark
ⓘ Source: listings_history table (triggers on properties + properties_extension) + one-shot
backfill from property_details.listing_events for pre-trigger history.
Climate risk First Street
- Flood 8/10 Severe FEMA zone X · 99% chance over 30 yrs
- Wildfire 1/10 Low
- Heat 2/10 Low 8 d/yr ≥89°F today · 18 d/yr by 30 yrs out
- Wind 1/10 Low
- Air quality 1/10 Low 0 unhealthy d/yr today · 0 by 30 yrs out
Nearby sold comps map
Loading sold comps map…
Walkable amenities ~0.75 mi
Loading nearby amenities…
Taxation est. · year 1
- Rental income
- $14,037
- − Mortgage interest
- −$2,241
- − Property taxes
- −$600
- − Insurance
- −$866
- − Repairs & maintenance
- −$1,123
- − Management
- −$1,123
- − Depreciation
- −$1,164
- Taxable income
- $6,920
- Est. tax owed @ 24.0%
- −$1,661
- After-tax cash flow
- $5,445/yr
For passive investors: Depreciation is non-cash, so a rental often shows a tax loss while cash-flowing — sheltering income. Rental losses are passive: they offset passive income freely, and up to $25,000/yr can offset ordinary (W-2) income if you actively participate and your MAGI is under $100k (phasing out to $0 by $150k); unused losses carry forward. On sale, claimed depreciation is recaptured at up to 25%, and gains may owe capital-gains tax (a 1031 exchange can defer both). Figures are a year-1 estimate at your 24.0% rate — not tax advice; consult a CPA.
Schools (NCES district)
- District
- Cuba-Rushford Central School District
- NCES district ID
- 3632010
- Math proficiency
- 44% ▼ -18.00%
- Reading proficiency
- 61% ▲ 5.00%
- Median HH income
- $47,256
- Composite
- 44.53/100
- National rank
- #2792
- State rank
- #350 of 590 in NY
Livability — Cuba
- Score
- 73/100
- State rank
- #309
- US rank
- #5131
Category grades
Schools grade is shown separately in the Schools card above.
Census & demographics
- Census place
- Cuba, NY
- Population (ZIP)
- 5,039
Population outlook (Allegany County) Hauer SSP2
- Today (2025)
- 45,362 people
- By 2030
- 43,078 · -5.0%
- By 2040
- 38,031 · -16.2%
- By 2050
- 33,634 · -25.9%
- By 2075
- 25,285 · -44.3%
- By 2100
- 18,902 · -58.3%
Race, ethnicity, and origin ACS 2023
- Neighborhood character
- Predominantly White (95%)
- Race & ethnicity
- White 95% Two or more races 2% Hispanic / Latino 2% Asian 1%
- Common ancestry
- Romanian 5% Iranian 3% Polish 2%
- Foreign-born
- 2% · Canada
- Languages at home
- 97% English-only · German/W. Germanic 2% Spanish 1%
Political lean MEDSL · Allegany
- 2024 margin
- Solid R (+43.2) · D 28.4% · R 71.6%
- 2008→2024 swing
- -21.5pp toward R · 2008: -21.7pp · 2024: -43.2pp
- All cycles
- 2024: R+43.2 2020: R+38.9 2016: R+42.3 2012: R+25.3 2008: R+21.7
Not yet ingested
- Civics
- —
Market trends
- HPI YoY
- ▲ 7.17%
- Current HPI
- 298.31
- Rent YoY
- —
- Metro
- —
- State GDP YoY
- ▲ 2.60%
- F500 in state
- 92
Industry mix (Fortune 500 HQ in NY)
| Industry | F500 HQs | Revenue |
|---|---|---|
| Financial Services | 10 | $950B |
|
||
| Consumer Goods | 9 | $162B |
|
||
| Insurance | 4 | $225B |
|
||
| Telecommunications | 2 | $144B |
|
||
| Pharmaceuticals | 2 | $112B |
|
||
| Media / Entertainment | 2 | $69B |
|
||
Price history
2 events — show timeline
- 2026-06-06 Pending — WNYREIS
- 2026-05-14 Listed $40,000 WNYREIS
Property tax history
+3.3%/yrLatest (2025): $3,078 · +36.9% YoY. Source: county tax records.
Cash-flow waterfall
monthlySold comps — $/sqft
last 12 mo · ≤1 miLoading sold comps…