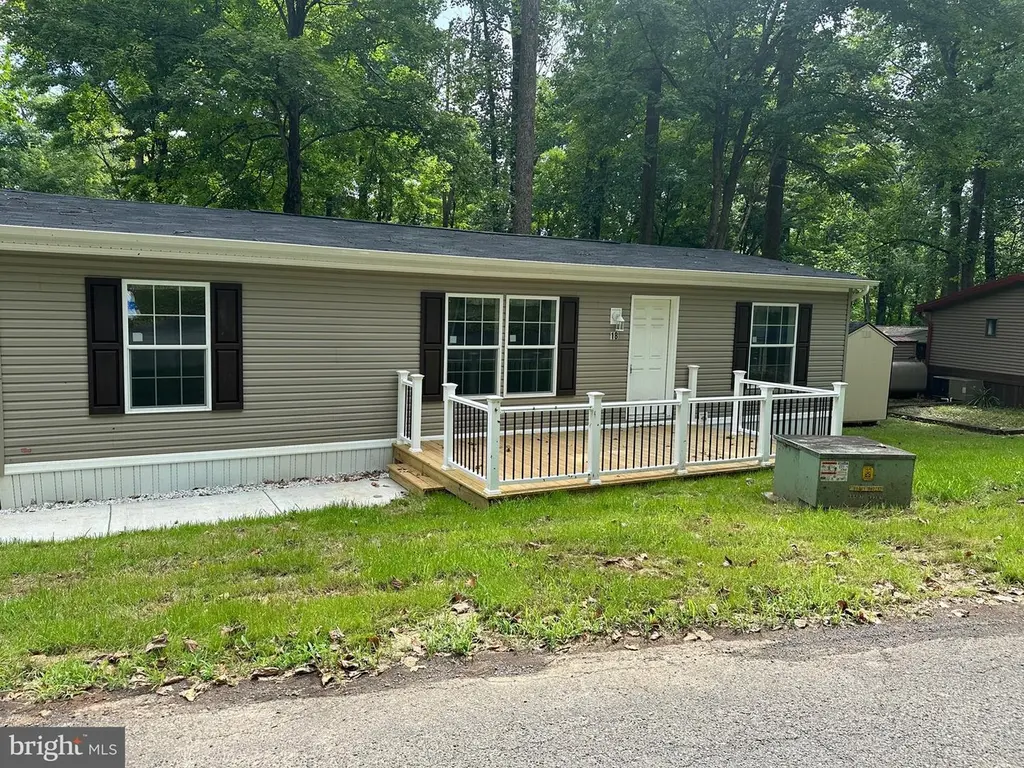
18 Ash Ln · Quakertown, PA
Flood risk 1/10 · Minimal
- FEMA flood zone
- X (unshaded)
- Chance of flooding over 30 yrs
- 0.0%
- Est. flood insurance / yr
- $473 – $860
Fire risk 3/10 · Minor
- Est. fire insurance / yr
- $511 – $949
Heat risk 4/10 · Minor
- Hot days now (above 100°F)
- 7 days/yr
- Hot days in 30 yrs
- 15 days/yr
Wind risk 4/10 · Minor
- Chance of severe wind over 30 yrs
- 22.0%
Air-quality risk 2/10 · Minimal
- Unhealthy air days now
- 1 days/yr
- Unhealthy air days in 30 yrs
- 2 days/yr
Risk factors via First Street. Map © Google.
Why this score? — see what drove the C grade
The composite is a weighted blend of 9 inputs, each scored 0–100. Each bar is that input's sub-score; the figure is the points it added to the 100-point composite (weight × sub-score).
- Cash flow +27.2/30.0
- DSCR +9.5/10.0
- 1% rule +7.4/10.0
- Schools +4.4/10.0
- Livability +4.0/5.0
- Rent growth +2.5/5.0
- Condition / age +2.5/5.0
- ARV discount +0.0/15.0
- Appreciation +0.0/10.0
$169,500
🖨 Deal sheet 📄 Offer letter ✓ Due diligence
Listing remarks MLS
This Lexington Limited Skyline home comes with an extended warranty up to 7 years. There is drywall throughout. The open concept lends itself to today's modern living. When you are not swimming or golfing , you can enjoy a barbeque on the front or back deck. Don't miss this charmer
Key facts
- Open concept
- 0.25 acre lot
- Community pool
Tags
Neighborhood map
What this means for you Summary
Snapshot
- This is a 3-bed/2.0-bath manufactured listed at $170k.
Deal economics
- At list price, monthly cash flow is $486 ($6k/yr) — positive.
- The deal already cash-flows at list — no discount required.
- Meets the 1% rule at list price ($2k rent vs $170k).
- Recommended offer: $149k (12.0% below list) — sets the bar for market timing.
- Cap rate 9.7% vs local median 4.2% in Quakertown — top-decile yield for the area; either an underpriced asset or a hidden risk that comps aren't pricing in. Stress-test before assuming the spread holds.
Location & tenants
- Location reads 80/100 on livability (#222 in PA, #1,945 nationally) — a professional / high-income tenant draw. Strengths: housing A+, health & safety A+, cost of living A; Watch: commute F.
- Quakertown Community SD (suburban): math 45% / reading 55% proficiency, ranked #154 of 539 in PA (top 29%) — acceptable for families but not a draw, mixed tenant base, ~2y average lease.
- Market conditions: 144 active listings in the ZIP; solid renter incomes; 663 units permitted in Bucks County in 2024 (106 in 5+ unit buildings).
Forward outlook
- Local home prices are declining (-3.0%/yr); year-one equity from $1k of loan paydown is wiped out by about $5k of value loss. Plan a longer hold.
- Bucks County population projected to shrink 7% by 2050 — rents likely to lag national; underwrite the cash flow, not the appreciation.
- At projected returns (-3.0% appreciation + 3.0% rent growth), your $47k cash investment doubles in ~10 years — after that, you're playing with house money.
Negotiation context
- It's been on market 484 days — a 12% lower offer ($149k) is reasonable based on typical stale-listing flexibility.
- 5 sale attempts since 33y ago with the ask held roughly flat each time — persistent listings suggest the price (not the market) is what's stuck; bring a comps-based counter.
- Current owner paid $6k; list at $170k implies a 2508% gain — meaningful room to come down on a strong offer.
Questions for the listing agent
- It's been on market 484 days. Have you received any prior offers? Is the seller open to a 12% concession, seller financing, or rate buy-down credit?
- Why hasn't it sold? Are there any deal-killer items the seller is aware of (foundation, flood, title, zoning, code violations)?
- Is there a deadline driving the sale (1031 exchange, divorce, estate, relocation)? That informs how much negotiation room exists.
- Schools are A-rated — typically a magnet for longer-tenancy family renters. What's the average tenant stay here, and is there a school-zone premium baked into asking?
- What's the average days-on-market for RENTAL listings here right now (not sales)? A rising rental-DOM trend means longer vacancies and softer asking-rent achievability than the comps imply.
- What's the recent tenant-quality profile in this submarket — average credit score on applications, eviction rate, late-payment / NSF rate, and stable-employment percentage? A property-management company in the area should have these aggregated.
- How much new for-sale + rental construction is in the pipeline within 1–3 miles? Heavy new supply typically softens prices + rents 12–24 months out; constrained supply supports both.
Investment metrics
- 1% rule
- 1.24% ✓
- Cap rate
- 9.74%
- Cash-on-cash
- 12.30%
- DSCR
- 1.55
- GRM
- 6.7
CMA / ARV
- ARV (median comp)
- $144,473
- List price
- $169,500
- Delta
- 17.32%
- Verdict
- OVERPRICED
- Comps
- 20 within 1.0 mi
Projected returns pro-forma
-3.0% appreciation · 3.0% rent growth · sell at horizon
- IRR
- 1.9%
- Equity multiple
- 1.07×
- Total profit
- $3,542
- Equity at exit
- $25,273
- IRR
- 11.6%
- Equity multiple
- 1.91×
- Total profit
- $43,101
- Equity at exit
- $14,655
Cash invested: $47,460 (down + closing). Projections, not guarantees.
Landlord ↔ Tenant lean methodology
- Overall (STATE)
- 62 Landlord-Friendly
- State Pennsylvania
- 62 Landlord-Friendly · EVEN
- County
- — inherits STATE
- City
- — inherits STATE
ZIP-level market 18951
- Active inventory
- 144
- Price-to-rent
- 6.7×
Monthly cashflow live
- Estimated rent
- $2,098 medium interval (Pro) →
- Mortgage (P&I)
- −$889
- Tax est. 1.5%
- −$212 /mo · $2,542/yr
- Insurance
- −$71
- HOA
- −$0
- Vacancy / Maint / Mgmt
- −$441
- Net cashflow
- $486
Break-even live
UW: 25.0% down · 7.5% · 30yr · 1.5% tax · 5.0% vac · 8.0% maint · 8.0% mgmt
Financing live
Cash to close
- Down payment
- $42,375
- Closing costs
- $5,085
- Reserves months
- —
- Total cash needed
- —
Loan-product check · same deal, 3 products live
Conventional
25% down · 7.5% · 30yr
- Down + closing
- —
- Monthly P&I
- —
- Monthly cashflow
- —
- DSCR
- —
- Eligible?
- —
Personal DTI + credit; lowest rate.
DSCR
20% down · 8.5% · 30yr
- Down + closing
- —
- Monthly P&I
- —
- Monthly cashflow
- —
- DSCR
- —
- Eligible?
- —
No personal income docs; deal must DSCR.
Hard money
10% down · 12.0% · 12mo
- Down + closing
- —
- Monthly P&I
- —
- Monthly cashflow
- —
- DSCR
- —
- Eligible?
- —
Short-term bridge; refi at stabilization.
Listing history 21 events
-
2026-06-13statusdays on market $169,500 Pending 484 DOM
-
2026-06-09days on market $169,500 Active 481 DOM
-
2026-06-08days on market $169,500 Active 480 DOM
-
2026-06-07days on market $169,500 Active 479 DOM
-
2026-06-04days on market $169,500 Active 476 DOM
-
2026-06-03days on market $169,500 Active 475 DOM
-
2026-06-02days on market $169,500 Active 474 DOM
-
2026-06-01days on market $169,500 Active 473 DOM
-
2026-05-31days on market $169,500 Active 472 DOM
-
2026-02-11price $169,500 282-char remark
Show marketing remark (282 chars)
This Lexington Limited Skyline home comes with an extended warranty up to 7 years. There is drywall throughout. The open concept lends itself to today's modern living. When you are not swimming or golfing , you can enjoy a barbeque on the front or back deck. Don't miss this charmer
-
2025-02-13$178,000 Active 282-char remark
Show marketing remark (282 chars)
This Lexington Limited Skyline home comes with an extended warranty up to 7 years. There is drywall throughout. The open concept lends itself to today's modern living. When you are not swimming or golfing , you can enjoy a barbeque on the front or back deck. Don't miss this charmer
-
2024-12-31historical
-
2024-09-11price $178,000
-
2024-07-13$168,000 Active
-
2010-05-26soldstatus $6,500
-
2010-05-26soldstatus $6,500
-
2010-04-09$10,000
-
2010-04-09$10,000
-
1994-01-07soldstatus $15,500
-
1993-11-01historical
-
1993-05-17$15,500
ⓘ Source: listings_history table (triggers on properties + properties_extension) + one-shot
backfill from property_details.listing_events for pre-trigger history.
Climate risk First Street
- Flood 1/10 Low FEMA zone X (unshaded) · 0% chance over 30 yrs
- Wildfire 3/10 Moderate
- Heat 4/10 Moderate 7 d/yr ≥100°F today · 15 d/yr by 30 yrs out
- Wind 4/10 Moderate 22% chance of damaging wind over 30 yrs
- Air quality 2/10 Low 1 unhealthy d/yr today · 2 by 30 yrs out
Nearby sold comps map
Loading sold comps map…
Walkable amenities ~0.75 mi
Loading nearby amenities…
Taxation est. · year 1
- Rental income
- $25,181
- − Mortgage interest
- −$9,495
- − Property taxes
- −$2,542
- − Insurance
- −$848
- − Repairs & maintenance
- −$2,014
- − Management
- −$2,014
- − Depreciation
- −$4,931
- Taxable income
- $3,336
- Est. tax owed @ 24.0%
- −$801
- After-tax cash flow
- $5,036/yr
For passive investors: Depreciation is non-cash, so a rental often shows a tax loss while cash-flowing — sheltering income. Rental losses are passive: they offset passive income freely, and up to $25,000/yr can offset ordinary (W-2) income if you actively participate and your MAGI is under $100k (phasing out to $0 by $150k); unused losses carry forward. On sale, claimed depreciation is recaptured at up to 25%, and gains may owe capital-gains tax (a 1031 exchange can defer both). Figures are a year-1 estimate at your 24.0% rate — not tax advice; consult a CPA.
Schools (NCES district)
- District
- Quakertown Community SD
- NCES district ID
- 4219890
- Math proficiency
- 45% ▼ -11.00%
- Reading proficiency
- 55% ▼ -15.00%
- Median HH income
- $66,186
- Composite
- 44.3/100
- National rank
- #2833
- State rank
- #154 of 539 in PA
Livability — Quakertown
- Score
- 80/100
- State rank
- #222
- US rank
- #1945
Category grades
Schools grade is shown separately in the Schools card above.
Census & demographics
- County
- Bucks County · 506,477 people
- City population
- 36,568
- Metro
- Philadelphia-Camden-Wilmington, PA-NJ-DE-MD
- Population (ZIP)
- 36,568
- Household income
- $98,268
- Rent vs Own
- Severe rent burden
- 488.0
Population outlook (Bucks County) Hauer SSP2
- Today (2025)
- 630,973 people
- By 2030
- 627,093 · -0.6%
- By 2040
- 609,680 · -3.4%
- By 2050
- 584,225 · -7.4%
- By 2075
- 539,840 · -14.4%
- By 2100
- 483,970 · -23.3%
Race, ethnicity, and origin ACS 2023
- Neighborhood character
- Predominantly White (85%)
- Race & ethnicity
- White 85% Two or more races 7% Hispanic / Latino 6% Asian 3% Black 2%
- Hispanic origin (detail)
- Mexican 4% Puerto Rican 1%
- Common ancestry
- Romanian 5% Polish 3% Slovak 2%
- Foreign-born
- 7% · Canada, China, Jamaica
- Languages at home
- 90% English-only · Spanish 5% Other Indo-European 1% German/W. Germanic 1%
Political lean MEDSL · Bucks
- 2024 margin
- Toss-up / Even · D 49.5% · R 49.5%
- 2008→2024 swing
- -8.7pp toward R · 2008: 8.7pp · 2024: -0.1pp
- All cycles
- 2024: R+0.1 2020: D+4.4 2016: D+0.6 2012: D+1.2 2008: D+8.7
Not yet ingested
- Civics
- —
Market trends
- HPI YoY
- ▼ -247.25%
- Current HPI
- 283.2262
- Rent YoY
- —
- Metro
- Philadelphia-Camden-Wilmington, PA-NJ-DE-MD
- State GDP YoY
- ▲ 1.68%
- F500 in state
- 34
Industry mix (Fortune 500 HQ in PA)
| Industry | F500 HQs | Revenue |
|---|---|---|
| Healthcare | 2 | $309B |
|
||
| Insurance | 2 | $27B |
|
||
| Telecommunications / Media | 1 | $124B |
|
||
| Industrial Distribution | 1 | $22B |
|
||
| Financial Services | 1 | $20B |
|
||
| Chemicals / Materials | 1 | $18B |
|
||
Price history
+993.5% since first listed12 events — show timeline
- 2026-02-11 Price Changed $169,500 BRIGHT MLS
- 2025-02-13 Listed $178,000 BRIGHT MLS
- 2024-12-31 Listing Removed — BRIGHT MLS
- 2024-09-11 Price Changed $178,000 BRIGHT MLS
- 2024-07-13 Listed $168,000 BRIGHT MLS
- 2010-05-26 Sold (MLS) $6,500 TREND
- 2010-05-26 Sold (MLS) $6,500 BRIGHT MLS
- 2010-04-09 Listed $10,000 TREND
- 2010-04-09 Listed $10,000 BRIGHT MLS
- 1994-01-07 Sold (MLS) $15,500 BRIGHT MLS
- 1993-11-01 Listing Removed — BRIGHT MLS
- 1993-05-17 Listed $15,500 BRIGHT MLS
Cash-flow waterfall
monthlySold comps — $/sqft
last 12 mo · ≤1 miLoading sold comps…