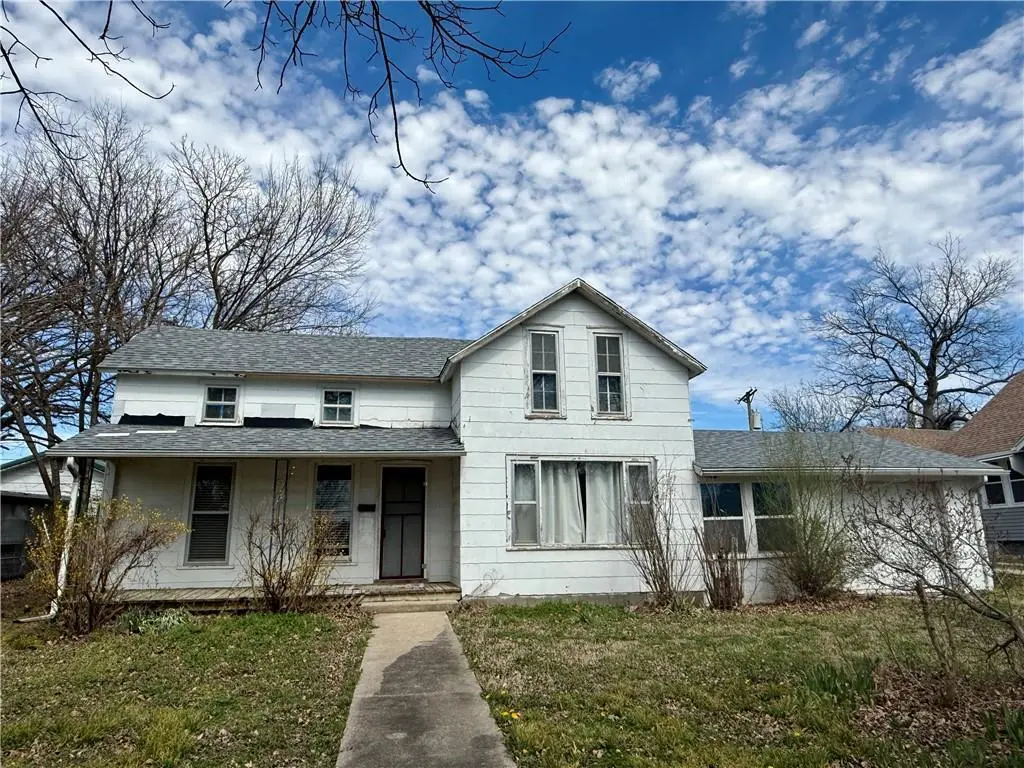
318 Miami St · Burlington, KS
Flood risk 1/10 · Minimal
- FEMA flood zone
- X (unshaded)
- Chance of flooding over 30 yrs
- 0.0%
- Est. flood insurance / yr
- $507 – $1,088
Fire risk 3/10 · Minor
- Est. fire insurance / yr
- $1,154 – $2,142
Heat risk 5/10 · Moderate
- Hot days now (above 107°F)
- 7 days/yr
- Hot days in 30 yrs
- 18 days/yr
Wind risk 2/10 · Minimal
- Chance of severe wind over 30 yrs
- 0.0%
Air-quality risk 2/10 · Minimal
- Unhealthy air days now
- 1 days/yr
- Unhealthy air days in 30 yrs
- 2 days/yr
Risk factors via First Street. Map © Google.
Why this score? — see what drove the B+ grade
The composite is a weighted blend of 9 inputs, each scored 0–100. Each bar is that input's sub-score; the figure is the points it added to the 100-point composite (weight × sub-score).
- Cash flow +30.0/30.0
- ARV discount +15.0/15.0
- 1% rule +10.0/10.0
- DSCR +10.0/10.0
- Livability +3.8/5.0
- Schools +3.1/10.0
- Rent growth +2.5/5.0
- Condition / age +2.5/5.0
- Appreciation +0.0/10.0
$65,000
🖨 Deal sheet 📄 Offer letter ✓ Due diligence
Key facts
- Updated electrical
- Front and back yards
- Inviting front porch
Tags
Property features AI
Finance
- Other: Directions: From 75 HWY turn east on Miami. House on north side of road
- HOA & community: No association fees; No maintenance provided
Exterior
- Parking: Attached parking; Carport; 1 garage space
- Utilities: Public water; Public sewer
- Home design: Single-family residential; Frame construction; Composition roof; About 1,244 sq ft living area; Built over 100 years ago; Facing / entry direction not specified
- Construction: Frame construction; Composition roof
- Exterior features: Not in a flood plain; Lot approximately 63 x 120 ft
Interior
- Bedrooms: 3 bedrooms (one on main level, two on upper level)
- Bathrooms: 1 full bathroom
- Heating & cooling: Forced air heating; Electric cooling (air conditioning)
- Interior features: Cellar basement; 1.5-story floor plan
Neighborhood map
What this means for you Summary
Snapshot
- This is a 3-bed/1.0-bath single-family listed at $65k.
Deal economics
- At list price, monthly cash flow is $397 ($5k/yr) — positive.
- The deal already cash-flows at list — no discount required.
- Meets the 1% rule at list price ($1k rent vs $65k).
- Recommended offer: $63k (3.0% below list) — sets the bar for market timing.
Location & tenants
- Location reads 76/100 on livability (#57 in KS, #3,781 nationally) — a middle-class / working-renter tenant base. Strengths: cost of living A+, housing A+, health & safety A+; Watch: employment C-, schools D, amenities F.
- Burlington (town): math 34% / reading 37% proficiency, ranked #54 of 169 in KS (top 32%) — families likely to look elsewhere, expect single-tenant / working-renter base with shorter leases.
- Market conditions: 38 active listings in the ZIP; 1 comparable units currently listed for rent nearby; 29 units permitted in Coffey County in 2024 (0 in 5+ unit buildings).
Forward outlook
- Local home prices are declining (-3.0%/yr); year-one equity from $449 of loan paydown is wiped out by about $2k of value loss. Plan a longer hold.
- Coffey County population projected at -12% by 2050 — secular population decline; favor cash flow + early exit over multi-decade hold.
- At projected returns (-3.0% appreciation + 3.0% rent growth), your $18k cash investment doubles in ~5 years — after that, you're playing with house money.
Negotiation context
- It's been on market 33 days — a 3% lower offer ($63k) is reasonable based on typical stale-listing flexibility.
- Current owner paid $28k; list at $65k implies a 128% gain — meaningful room to come down on a strong offer.
Risks & watch-outs
- Watch-outs: built in 1880 — expect roof / HVAC / electrical / plumbing capex.
- Climate carrying-cost: extreme-heat days projected 7→18/yr by 2055 (HVAC capex compounding) — expect insurance premiums to compound above CPI over the hold.
Questions for the listing agent
- It's been on market 33 days. Have you received any prior offers? Is the seller open to a 3% concession, seller financing, or rate buy-down credit?
- Built in 1880 — when were the roof, HVAC, electrical panel, plumbing, and water heater last replaced?
- Is there a deadline driving the sale (1031 exchange, divorce, estate, relocation)? That informs how much negotiation room exists.
- Schools are D-rated, which usually means shorter tenancies and higher turnover. Who's the typical renter profile here, and what's been the actual vacancy rate?
- What's the average days-on-market for RENTAL listings here right now (not sales)? A rising rental-DOM trend means longer vacancies and softer asking-rent achievability than the comps imply.
- What's the recent tenant-quality profile in this submarket — average credit score on applications, eviction rate, late-payment / NSF rate, and stable-employment percentage? A property-management company in the area should have these aggregated.
- How much new for-sale + rental construction is in the pipeline within 1–3 miles? Heavy new supply typically softens prices + rents 12–24 months out; constrained supply supports both.
Investment metrics
- 1% rule
- 1.54% ✓
- Cap rate
- 13.63%
- Cash-on-cash
- 26.20%
- DSCR
- 2.17
- GRM
- 5.4
CMA / ARV
- ARV (on-the-fly)
- $93,300
- Comps found
- 6
Show comp detail 6 sales within ~0.75 mi
| Address | Dist | Beds/Ba | Sqft | Sold | Price | $/sf | Match |
|---|---|---|---|---|---|---|---|
| 318 Miami St | 0.00mi | 3/1.0 | 1,244 (0%) | 1mo | $65,000 | $52 | 99 |
| 322 N 5th St | 0.13mi | 2/1.0 (-1) | 1,296 (+4%) | 11mo | $85,000 | $66 | 73 |
| 809 Alleghaney St | 0.67mi | 3/2.0 | 1,200 (-4%) | 2mo | $89,999 | $75 | 57 |
| 621 N 3rd St | 0.23mi | 4/3.0 (+1) | 1,402 (+13%) | 8mo | $195,000 | $139 | 48 |
| 914 Des Moines St | 0.52mi | 3/1.0 | 1,372 (+10%) | 13mo | $100,000 | $73 | 48 |
| 202 N 11th St | 0.62mi | 2/1.5 (-1) | 1,200 (-4%) | 14mo | $235,000 | $196 | 47 |
Match score weights: distance 35% · size 25% · config 20% · recency 20%. Top-matched comps best support the ARV.
Projected returns pro-forma
-3.0% appreciation · 3.0% rent growth · sell at horizon
- IRR
- 19.9%
- Equity multiple
- 1.81×
- Total profit
- $14,755
- Equity at exit
- $9,692
- IRR
- 28.2%
- Equity multiple
- 3.49×
- Total profit
- $45,355
- Equity at exit
- $5,620
Cash invested: $18,200 (down + closing). Projections, not guarantees.
Landlord ↔ Tenant lean methodology
- Overall (STATE)
- 83 Strongly Landlord-Friendly
- State Kansas
- 83 Strongly Landlord-Friendly · R+10
- County
- — inherits STATE
- City
- — inherits STATE
ZIP-level market 66839
- Home prices YoY
- -11.8%
- Active inventory
- 38
- Price-to-rent
- 5.4×
Monthly cashflow live
- Estimated rent
- $1,000 medium interval (Pro) →
- Mortgage (P&I)
- −$341
- Tax from tax record
- −$25 /mo · $296/yr
- Insurance
- −$27
- HOA
- −$0
- Vacancy / Maint / Mgmt
- −$210
- Net cashflow
- $397
Break-even live
UW: 25.0% down · 7.5% · 30yr · 1.5% tax · 5.0% vac · 8.0% maint · 8.0% mgmt
Financing live
Cash to close
- Down payment
- $16,250
- Closing costs
- $1,950
- Reserves months
- —
- Total cash needed
- —
Loan-product check · same deal, 3 products live
Conventional
25% down · 7.5% · 30yr
- Down + closing
- —
- Monthly P&I
- —
- Monthly cashflow
- —
- DSCR
- —
- Eligible?
- —
Personal DTI + credit; lowest rate.
DSCR
20% down · 8.5% · 30yr
- Down + closing
- —
- Monthly P&I
- —
- Monthly cashflow
- —
- DSCR
- —
- Eligible?
- —
No personal income docs; deal must DSCR.
Hard money
10% down · 12.0% · 12mo
- Down + closing
- —
- Monthly P&I
- —
- Monthly cashflow
- —
- DSCR
- —
- Eligible?
- —
Short-term bridge; refi at stabilization.
Rent comps 1 comps
| Address | Beds | Baths | Sqft | Rent | $/sqft | DOM | Units | Dist |
|---|---|---|---|---|---|---|---|---|
| 524 Juniatta St Burlington, KS | 2.0 | 1.0 | 1200 | $1,000 | $0.83 | 44d | 1 | 0.18mi |
Listing history 4 events
-
2026-05-01status Pending
-
2026-03-29$65,000 Active
-
2006-11-01soldstatus $28,500
-
1994-05-01soldstatus $15,000
ⓘ Source: listings_history table (triggers on properties + properties_extension) + one-shot
backfill from property_details.listing_events for pre-trigger history.
Tax reassessment forecast KS · Resets to sale price
- Current annual tax
- $296 · $25/mo
- Projected year-2 tax
- $916 · $76/mo
- Expected delta
- +$620/yr (+$52/mo · 209.1%)
ⓘ Screening estimate from a state-policy table — verify with the county assessor before closing.
Climate risk First Street
- Flood 1/10 Low FEMA zone X (unshaded) · 0% chance over 30 yrs
- Wildfire 3/10 Moderate
- Heat 5/10 Major 7 d/yr ≥107°F today · 18 d/yr by 30 yrs out
- Wind 2/10 Low 0% chance of damaging wind over 30 yrs
- Air quality 2/10 Low 1 unhealthy d/yr today · 2 by 30 yrs out
Nearby sold comps map
Loading sold comps map…
Walkable amenities ~0.75 mi
Loading nearby amenities…
Taxation est. · year 1
- Rental income
- $12,000
- − Mortgage interest
- −$3,641
- − Property taxes
- −$296
- − Insurance
- −$325
- − Repairs & maintenance
- −$960
- − Management
- −$960
- − Depreciation
- −$1,891
- Taxable income
- $3,927
- Est. tax owed @ 24.0%
- −$942
- After-tax cash flow
- $3,826/yr
For passive investors: Depreciation is non-cash, so a rental often shows a tax loss while cash-flowing — sheltering income. Rental losses are passive: they offset passive income freely, and up to $25,000/yr can offset ordinary (W-2) income if you actively participate and your MAGI is under $100k (phasing out to $0 by $150k); unused losses carry forward. On sale, claimed depreciation is recaptured at up to 25%, and gains may owe capital-gains tax (a 1031 exchange can defer both). Figures are a year-1 estimate at your 24.0% rate — not tax advice; consult a CPA.
Schools (NCES district)
- District
- Burlington
- NCES district ID
- 2004290
- Math proficiency
- 34% ▼ -4.00%
- Reading proficiency
- 37% ▲ 1.00%
- Median HH income
- $53,723
- Composite
- 31.12/100
- National rank
- #6064
- State rank
- #54 of 169 in KS
Livability — Burlington
- Score
- 76/100
- State rank
- #57
- US rank
- #3781
Category grades
Schools grade is shown separately in the Schools card above.
Census & demographics
- Census place
- Burlington, KS
- Population (ZIP)
- 3,904
Population outlook (Coffey County) Hauer SSP2
- Today (2025)
- 8,172 people
- By 2030
- 8,015 · -1.9%
- By 2040
- 7,612 · -6.9%
- By 2050
- 7,178 · -12.2%
- By 2075
- 6,580 · -19.5%
- By 2100
- 5,971 · -26.9%
Race, ethnicity, and origin ACS 2023
- Neighborhood character
- Predominantly White (89%)
- Race & ethnicity
- White 89% Two or more races 6% Hispanic / Latino 5% Asian 1%
- Hispanic origin (detail)
- Mexican 5%
- Common ancestry
- Italian 14% Slovak 2% Lithuanian 2%
- Foreign-born
- 1% · Canada
- Languages at home
- 97% English-only · Spanish 1% Other Indo-European 1%
Political lean MEDSL · Coffey
- 2024 margin
- Solid R (+55.7) · D 21.3% · R 77.0% · Other 1.6%
- 2008→2024 swing
- -10.0pp toward R · 2008: -45.7pp · 2024: -55.7pp
- All cycles
- 2024: R+55.7 2020: R+55.7 2016: R+57.3 2012: R+51.5 2008: R+45.7
Not yet ingested
- Civics
- —
Market trends
- HPI YoY
- ▼ -32.99%
- Current HPI
- 247.43
- Rent YoY
- —
- Metro
- —
- State GDP YoY
- —
- F500 in state
- 0
Price history
+333.3% since first listed4 events — show timeline
- 2026-05-01 Pending — Heartland MLS as Distributed by MLS Grid
- 2026-03-29 Listed $65,000 Heartland MLS as Distributed by MLS Grid
- 2006-11-01 Sold (Public Records) $28,500 Public Records
- 1994-05-01 Sold (Public Records) $15,000 Public Records
Property tax history
-2.7%/yrLatest (2025): $296 · -1.9% YoY. Source: county tax records.
Cash-flow waterfall
monthlySold comps — $/sqft
last 12 mo · ≤1 miLoading sold comps…