 Duplex
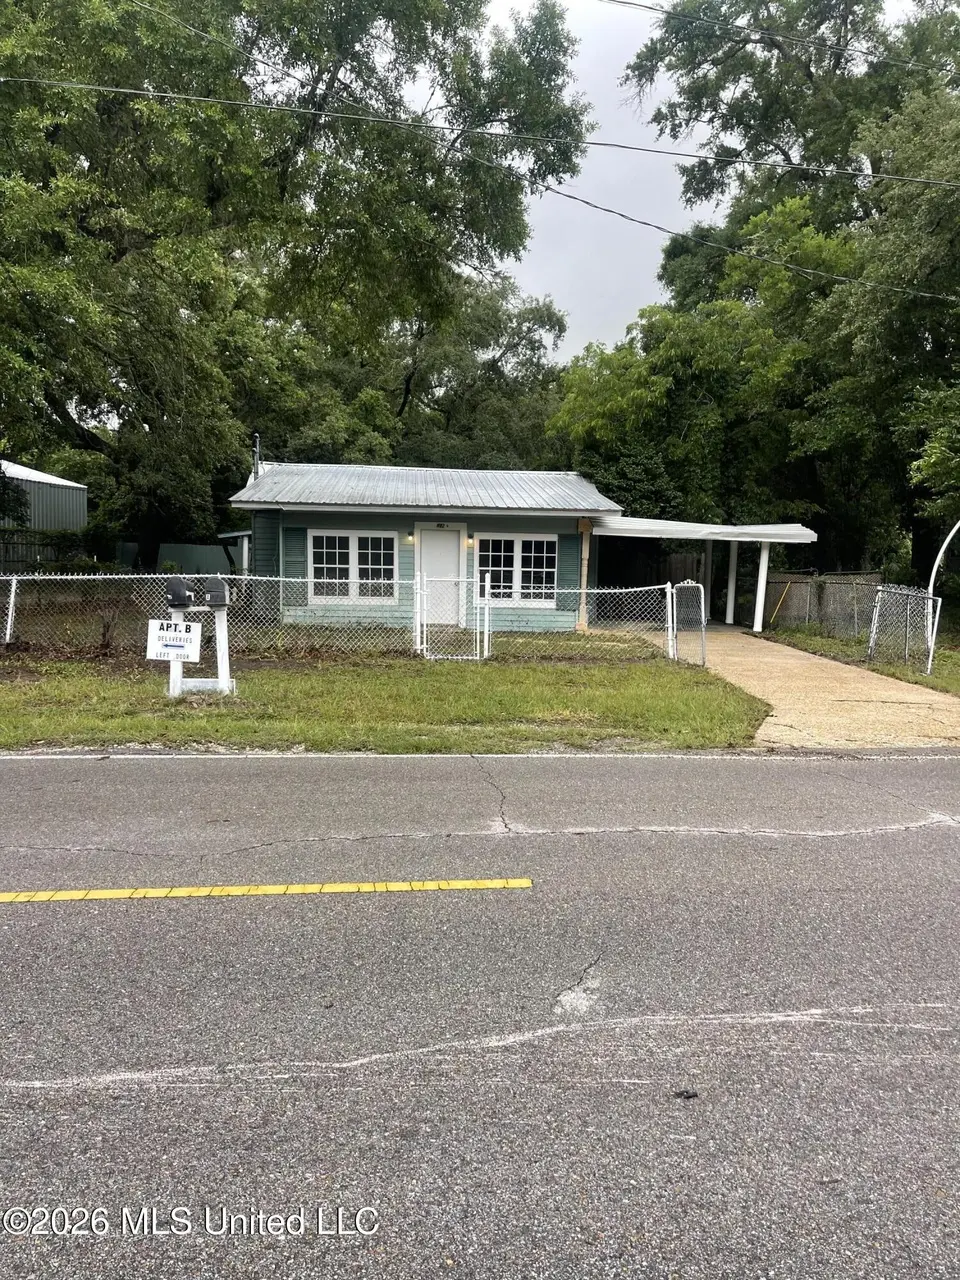
522 E Railroad St · Gulfport, MS
Flood risk 4/10 · Minor
- FEMA flood zone
- X (shaded)
- Chance of flooding over 30 yrs
- 0.13%
- Est. flood insurance / yr
- $507 – $1,088
Fire risk 3/10 · Minor
- Est. fire insurance / yr
- $1,241 – $2,305
Heat risk 10/10 · Severe
- Hot days now (above 106°F)
- 7 days/yr
- Hot days in 30 yrs
- 23 days/yr
Wind risk 9/10 · Severe
- Chance of severe wind over 30 yrs
- 99.0%
Air-quality risk 1/10 · Minimal
- Unhealthy air days now
- 0 days/yr
- Unhealthy air days in 30 yrs
- 0 days/yr
Risk factors via First Street. Map © Google.
Why this score? — see what drove the B grade
The composite is a weighted blend of 9 inputs, each scored 0–100. Each bar is that input's sub-score; the figure is the points it added to the 100-point composite (weight × sub-score).
- Cash flow +30.0/30.0
- 1% rule +10.0/10.0
- DSCR +10.0/10.0
- ARV discount +7.5/15.0
- Livability +3.7/5.0
- Rent growth +3.6/5.0
- Schools +3.4/10.0
- Condition / age +2.5/5.0
- Appreciation +0.0/10.0
$115,000
🖨 Deal sheet (PDF) 📄 Offer letter ✓ Due diligence
Multi-family units
County records classify this as Multi-Family (2-4 Unit). Listing-text estimate: 2 units. confirmed
Listing remarks
Investor Opportunity! Nestled beneath beautiful, mature oak trees, this duplex offers charm, privacy, and income potential. Each unit offers 1- Bedroom, 1- Bathroom with separate entrances which creates an attractive rental setup. Situated on 4 lots (+/-. 38 Acre). While could benefit from some updating and improvements, the property offers solid potential for investors. Conveniently located near downtown Gulfport and Hwy 90. Don't miss out on this one.
Key facts
- Income potential
- Separate entrances
- 4 lots
Tags
Property features AI
Finance
- Financial info: Annual tax information available
Exterior
- Parking: Private carport; Driveway
- Utilities: Public water; Public sewer; Electricity connected; Water connected
- Home design: Duplex; One level; Siding construction; Slab foundation; View waterfront feature
- Construction: Siding construction; Slab foundation; Metal roof
- Exterior features: Private yard; Chain link and wood fencing; Metal roof
Interior
- Bedrooms: 2-unit duplex (total units: 2)
- Bathrooms: 2 full bathrooms (total)
- Interior features: Central heating; Ceiling fan(s); Central air
Neighborhood map
What this means for you Summary
Snapshot
- This is a 2 × 1-bed/1.0-bath units multifamily listed at $115k.
Deal economics
- At list price, monthly cash flow is $1k ($12k/yr) — positive. Per door: $513/mo.
- The deal already cash-flows at list — no discount required.
- Meets the 1% rule at list price ($2k rent vs $115k).
- Recommended offer: $113k (1.5% below list) — sets the bar for market timing.
- Cap rate 17.0% vs local median 4.9% in Gulfport — top-decile yield for the area; either an underpriced asset or a hidden risk that comps aren't pricing in. Stress-test before assuming the spread holds.
Location & tenants
- Location reads 73/100 on livability (#15 in MS) — a middle-class / working-renter tenant base. Strengths: cost of living A+, housing A+, health & safety A+; Watch: amenities F, commute F, employment F.
- Gulfport School District (urban): math 41% / reading 42% proficiency, ranked #37 of 130 in MS (top 28%) — families likely to look elsewhere, expect single-tenant / working-renter base with shorter leases; 67% free/reduced lunch — lower-income household profile, screen leases tightly.
- Zoned schools: Pass Road Elementary School (math 32% / reading 42%, grade F, #135 of 375 statewide, top 39%, 398 students, 100% FRL); Gulfport Central Middle School (math 20% / reading 23%, grade F, #109 of 179 statewide, top 62%, 585 students, 100% FRL); Gulfport High School (math 42% / reading 36%, grade F, #54 of 197 statewide, top 28%, 1,728 students, 100% FRL) — zoned schools average 100% FRL vs 67% district-wide (33 pts higher); higher-poverty schools than district average — tighter screening recommended.
- Market conditions: Rents rising fast (+4.3%/yr); 301 active listings in the ZIP; 16 comparable units currently listed for rent nearby; rentals lingering (median 46d on market — plan ~5-8 weeks vacancy on turnover, expect pricing pressure); 56% of comp listings sitting > 30 days — soft ceiling on asking rent; 2,194 units permitted in Harrison County in 2024 (0 in 5+ unit buildings).
- At $2,248/mo this rent would consume 49% of the median local household income ($55k/yr) (locally 1059% of renters already pay >50% of income on rent) — very limited rent-growth headroom before tenants either downsize or default.
Forward outlook
- Local home prices are declining (-3.0%/yr); year-one equity from $795 of loan paydown is wiped out by about $3k of value loss. Plan a longer hold.
- Harrison County population projected at +27% by 2050 — long-run rental-demand tailwind backs the buy-and-hold thesis.
- At projected returns (-3.0% appreciation + 4.3% rent growth), your $32k cash investment doubles in ~4 years — after that, you're playing with house money.
Negotiation context
- It's been on market 16 days — a 2% lower offer ($113k) is reasonable based on typical stale-listing flexibility.
- 2 sale attempts with the ask held roughly flat each time — persistent listings suggest the price (not the market) is what's stuck; bring a comps-based counter.
Risks & watch-outs
- Climate carrying-cost: severe wind risk, 99% chance of damaging wind over 30y; extreme-heat days projected 7→23/yr by 2055 (HVAC capex compounding) — expect insurance premiums to compound above CPI over the hold.
Questions for the listing agent
- Can we see the unit-by-unit rent roll, current vacancy, and any below-market leases? What's the average tenancy length?
- What capital expenditures (roof, boiler, parking lot, exteriors) have been made in the last 5 years, and what's planned in the next 2?
- Built in 1965 — when were the roof, HVAC, electrical panel, plumbing, and water heater last replaced?
- Is there a deadline driving the sale (1031 exchange, divorce, estate, relocation)? That informs how much negotiation room exists.
- Schools are D-rated, which usually means shorter tenancies and higher turnover. Who's the typical renter profile here, and what's been the actual vacancy rate?
- What's the average days-on-market for RENTAL listings here right now (not sales)? A rising rental-DOM trend means longer vacancies and softer asking-rent achievability than the comps imply.
- What's the recent tenant-quality profile in this submarket — average credit score on applications, eviction rate, late-payment / NSF rate, and stable-employment percentage? A property-management company in the area should have these aggregated.
- How much new apartment / multifamily construction is in the pipeline within 1–3 miles? Heavy new supply (>2% of stock underway) typically softens rents 12–24 months out; light construction supports rent growth.
Investment metrics
- 1% rule
- 1.95% ✓
- Cap rate
- 17.00%
- Cash-on-cash
- 38.25%
- DSCR
- 2.70
- GRM
- 4.3
CMA / ARV
No comps found within radius.
Projected returns pro-forma
-3.0% appreciation · 4.26% rent growth · sell at horizon
- IRR
- 35.7%
- Equity multiple
- 2.54×
- Total profit
- $49,619
- Equity at exit
- $17,147
- IRR
- 43.1%
- Equity multiple
- 5.33×
- Total profit
- $139,546
- Equity at exit
- $9,943
Cash invested: $32,200 (down + closing). Projections, not guarantees.
Landlord ↔ Tenant lean methodology
- Overall (STATE)
- 90 Strongly Landlord-Friendly
- State Mississippi
- 90 Strongly Landlord-Friendly · R+11
- County
- — inherits STATE
- City
- — inherits STATE
ZIP-level market 39507
- Home prices YoY
- -27.1%
- Rents YoY
- 4.3%
- Active inventory
- 301
- Price-to-rent
- 8.5×
Monthly cashflow live
- Estimated rent
- $2,248 medium interval (Pro) →
- Mortgage (P&I)
- −$603
- Tax from tax record
- −$99 /mo · $1,184/yr
- Insurance
- −$48
- HOA
- −$0
- Vacancy / Maint / Mgmt
- −$472
- Net cashflow
- $1,026
Break-even live
Sensitivity live
| Price | -10% $1,091 | -5% $1,059 | +0% $1,026 | +5% $994 | +10% $961 |
|---|---|---|---|---|---|
| Rent | -10% $849 | -5% $937 | +0% $1,026 | +5% $1,115 | +10% $1,204 |
| Rate | -1.0pp $1,084 | -0.5pp $1,055 | base $1,026 | +0.5pp $996 | +1.0pp $966 |
2-unit breakdown (identical units grouped — click to expand)
| Units | Beds | Baths | Est. rent |
|---|---|---|---|
| 2× units | 1 | 1 | $2,248 |
| #1 | 1 | 1 | $1,124 |
| #2 | 1 | 1 | $1,124 |
| Total (2 units) | $2,248 | ||
UW: 25.0% down · 7.5% · 30yr · 1.5% tax · 5.0% vac · 8.0% maint · 8.0% mgmt
Financing live
Cash to close
- Down payment
- $28,750
- Closing costs
- $3,450
- Reserves months
- —
- Total cash needed
- —
Loan-product check · same deal, 3 products live
Conventional
25% down · 7.5% · 30yr
- Down + closing
- —
- Monthly P&I
- —
- Monthly cashflow
- —
- DSCR
- —
- Eligible?
- —
Personal DTI + credit; lowest rate.
DSCR
20% down · 8.5% · 30yr
- Down + closing
- —
- Monthly P&I
- —
- Monthly cashflow
- —
- DSCR
- —
- Eligible?
- —
No personal income docs; deal must DSCR.
Hard money
10% down · 12.0% · 12mo
- Down + closing
- —
- Monthly P&I
- —
- Monthly cashflow
- —
- DSCR
- —
- Eligible?
- —
Short-term bridge; refi at stabilization.
Rent comps 16 comps
| Address | Beds | Baths | Sqft | Rent | $/sqft | DOM | Units | Dist |
|---|---|---|---|---|---|---|---|---|
| 2311 5th Ave Gulfport, MS | 3.0 | 1.5 | 1100 | $1,300 | $1.18 | 45d | 1 | 0.49mi |
| 2233 5th Ave Gulfport, MS | 3.0 | 1.0 | 1215 | $1,300 | $1.07 | 45d | 1 | 0.50mi |
| 2706 6th Ave Gulfport, MS | 3.0 | 2.0 | 1217 | $1,300 | $1.07 | 22d | 1 | 0.59mi |
| 124 30th 1/2 St Gulfport, MS | 2.0 | 1.5 | 1007 | $1,100 | $1.09 | 45d | 1 | 0.62mi |
| 2823 6th Ave Unit A Gulfport, MS | 3.0 | 2.0 | 1100 | $1,100 | $1.00 | 22d | 1 | 0.66mi |
| 941 22nd St Gulfport, MS | 3.0 | 2.0 | 1450 | $1,600 | $1.10 | 15d | 1 | 0.67mi |
| 3209 F Ave Gulfport, MS | 2.0 | 1.0 | 1000 | $850 | $0.85 | 45d | 1 | 0.79mi |
| 1224 29th St Gulfport, MS | 2.0 | 2.0 | 1050 | $1,155 | $1.10 | 15d | 1 | 1.01mi |
| 3503 Hancock Ave Gulfport, MS | 2.0 | 2.5 | 1100 | $1,100 | $1.00 | 22d | 1 | 1.11mi |
| 1511 2nd St Gulfport, MS | 3.0 | 1.5 | 1030 | $2,000 | $1.94 | 45d | 1 | 1.26mi |
| 1400 28th St Gulfport, MS | 2.0–3.0 | 2.0 | 1101 | $943 | $0.86 | 15d | 1 | 1.26mi |
| 3333 12th Ave Gulfport, MS | 2.0 | 2.0 | 1000 | $899 | $0.90 | 45d | 1 | 1.30mi |
| 3333 12th Ave Unit 6 Gulfport, MS | 2.0 | 2.5 | 1000 | $899 | $0.90 | 45d | 1 | 1.30mi |
| 1605 20th St Gulfport, MS | 3.0 | 3.0 | 1350 | $1,095 | $0.81 | 45d | 1 | 1.30mi |
| 2207 16th Ave Gulfport, MS | 2.0 | 1.0 | 1325 | $1,425 | $1.08 | 15d | 1 | 1.35mi |
| 2227 17th Ave Gulfport, MS | 2.0 | 1.0 | 1000 | $850 | $0.85 | 45d | 1 | 1.42mi |
Listing history 12 events
-
2026-06-22days on market $115,000 Active 16 DOM
-
2026-06-18days on market $115,000 Active 13 DOM
-
2026-06-17days on market $115,000 Active 12 DOM
-
2026-06-16days on market $115,000 Active 11 DOM
-
2026-06-15days on market $115,000 Active 10 DOM
-
2026-06-14days on market $115,000 Active 8 DOM
-
2026-06-13days on market $115,000 Active 7 DOM
-
2026-06-10days on market $115,000 Active 5 DOM
-
2026-06-09days on market $115,000 Active 4 DOM
-
2026-06-08days on market $115,000 Active 3 DOM
-
2026-06-07remarks 457-char remark
-
2026-06-07$115,000 Active 2 DOM
ⓘ Source: listings_history table (triggers on properties + properties_extension) + one-shot
backfill from property_details.listing_events for pre-trigger history.
Tax reassessment forecast MS · Resets to sale price
- Current annual tax
- $1,184 · $99/mo
- Projected year-2 tax
- $1,184 · $99/mo
- Expected delta
- $0/yr ($0/mo · 0.0%)
ⓘ Screening estimate from a state-policy table — verify with the county assessor before closing.
Climate risk First Street
- Flood 4/10 Moderate FEMA zone X (shaded) · 13% chance over 30 yrs
- Wildfire 3/10 Moderate
- Heat 10/10 Extreme 7 d/yr ≥106°F today · 23 d/yr by 30 yrs out
- Wind 9/10 Extreme 99% chance of damaging wind over 30 yrs
- Air quality 1/10 Low 0 unhealthy d/yr today · 0 by 30 yrs out
Nearby sold comps map
Loading sold comps map…
Walkable amenities ~0.75 mi
Loading nearby amenities…
Taxation est. · year 1
- Rental income
- $26,976
- − Mortgage interest
- −$6,442
- − Property taxes
- −$1,184
- − Insurance
- −$575
- − Repairs & maintenance
- −$2,158
- − Management
- −$2,158
- − Depreciation
- −$3,345
- Taxable income
- $11,113
- Est. tax owed @ 24.0%
- −$2,667
- After-tax cash flow
- $9,648/yr
For passive investors: Depreciation is non-cash, so a rental often shows a tax loss while cash-flowing — sheltering income. Rental losses are passive: they offset passive income freely, and up to $25,000/yr can offset ordinary (W-2) income if you actively participate and your MAGI is under $100k (phasing out to $0 by $150k); unused losses carry forward. On sale, claimed depreciation is recaptured at up to 25%, and gains may owe capital-gains tax (a 1031 exchange can defer both). Figures are a year-1 estimate at your 24.0% rate — not tax advice; consult a CPA.
Schools (NCES district)
- District
- Gulfport School District
- NCES district ID
- 2801710
- Math proficiency
- 41% ▼ -15.00%
- Reading proficiency
- 42% ▼ -6.00%
- Median HH income
- $35,712
- Composite
- 34.38/100
- National rank
- #5213
- State rank
- #37 of 130 in MS
Livability — Gulfport
- Score
- 73/100
- State rank
- #15
- US rank
- #5010
Category grades
Schools grade is shown separately in the Schools card above.
Census & demographics
- Census place
- Gulfport, MS
- County
- Harrison County · 178,171 people
- City population
- 96,188
- Metro
- Gulfport-Biloxi, MS
- Population (ZIP)
- 18,564
- Household income
- $54,657
- Rent vs Own
- Severe rent burden
- 1059.0
Population outlook (Harrison County) Hauer SSP2
- Today (2025)
- 228,444 people
- By 2030
- 241,942 · +5.9%
- By 2040
- 267,531 · +17.1%
- By 2050
- 291,062 · +27.4%
- By 2075
- 346,711 · +51.8%
- By 2100
- 378,165 · +65.5%
Race, ethnicity, and origin ACS 2023
- Neighborhood character
- Majority White (65%)
- Race & ethnicity
- White 65% Black 24% Hispanic / Latino 6% Two or more races 5% Asian 1%
- Hispanic origin (detail)
- Mexican 2% Cuban 1%
- Common ancestry
- Slovak 4% Lithuanian 4% Romanian 2%
- Foreign-born
- 4% · Canada
- Languages at home
- 94% English-only · Spanish 2% French/Haitian/Cajun 2% Other Indo-European 1%
Political lean MEDSL · Harrison
- 2024 margin
- Strong R (+28.9) · D 35.0% · R 63.9% · Other 1.1%
- 2008→2024 swing
- -2.9pp toward R · 2008: -26.0pp · 2024: -28.9pp
- All cycles
- 2024: R+28.9 2020: R+25.2 2016: R+30.7 2012: R+26.6 2008: R+26.0
Not yet ingested
- Civics
- —
Market trends
- HPI YoY
- ▼ -67.48%
- Current HPI
- 181.6606
- Rent YoY
- ▲ 4.26%
- Metro
- Gulfport-Biloxi, MS
- State GDP YoY
- —
- F500 in state
- 0
Price history
3 events — show timeline
- 2026-06-05 Listed $115,000 MLSU
- 2026-05-29 Rental Removed $750 Avail
- 2026-05-27 Listed for Rent $750 Avail
Property tax history
-3.6%/yrLatest (2025): $1,184 · +3.8% YoY. Source: county tax records.
Cash-flow waterfall
monthlySold comps — $/sqft
last 12 mo · ≤1 miLoading sold comps…