 Multi-family
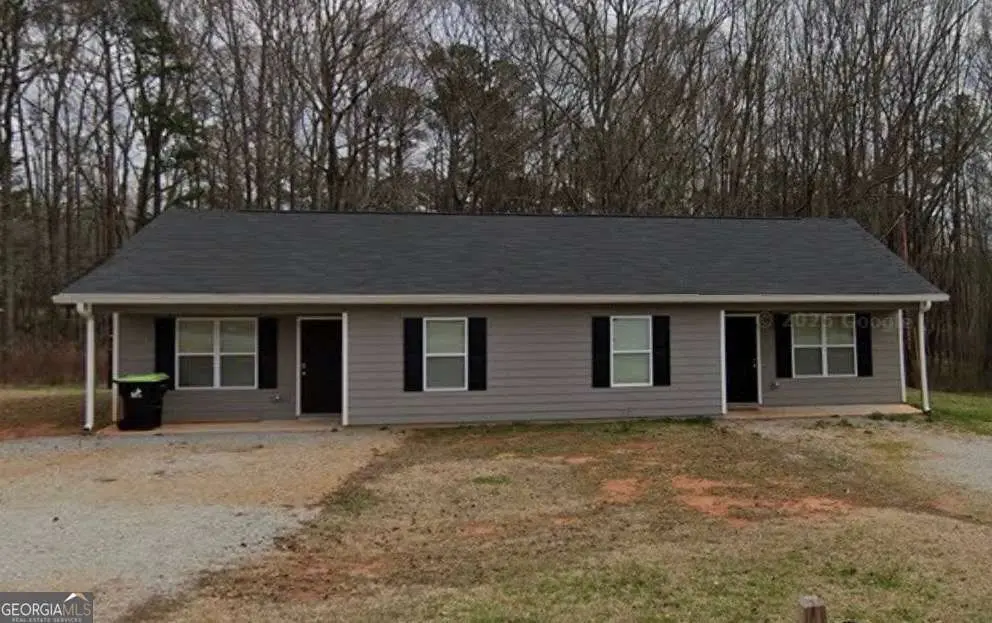
234 Temple Ter · Temple, GA
Flood risk 1/10 · Minimal
- FEMA flood zone
- X (unshaded)
- Chance of flooding over 30 yrs
- 0.0%
- Est. flood insurance / yr
- $507 – $1,088
Fire risk 3/10 · Minor
- Est. fire insurance / yr
- $963 – $1,789
Heat risk 5/10 · Moderate
- Hot days now (above 102°F)
- 7 days/yr
- Hot days in 30 yrs
- 19 days/yr
Wind risk 6/10 · Moderate
- Chance of severe wind over 30 yrs
- 27.0%
Air-quality risk 3/10 · Minor
- Unhealthy air days now
- 3 days/yr
- Unhealthy air days in 30 yrs
- 4 days/yr
Risk factors via First Street. Map © Google.
Why this score? — see what drove the B grade
The composite is a weighted blend of 9 inputs, each scored 0–100. Each bar is that input's sub-score; the figure is the points it added to the 100-point composite (weight × sub-score).
- Cash flow +26.9/30.0
- Appreciation +10.0/10.0
- DSCR +9.3/10.0
- ARV discount +7.5/15.0
- 1% rule +7.2/10.0
- Condition / age +3.8/5.0
- Schools +3.6/10.0
- Livability +3.6/5.0
- Rent growth +2.5/5.0
$825,000
🖨 Deal sheet (PDF) 📄 Offer letter ✓ Due diligence
Multi-family units
County records classify this as Multi-Family (5+ Unit). Listing-text estimate: 1 unit. estimate disagrees with records
5+ unit building — per-unit beds/baths from public records are typically unavailable; the breakdown below (if shown) is an estimate from the listing text.
Listing remarks
Outstanding Investment Opportunity. Property includes 2 Duplexes and 2 Trailers, totaling 6 tenant occupied units. Duplexes built in 2016 and 2022, with "maintenance free" in mind. Current monthly income of $6,825 with potential for increases. Additional "lots" with water meters and septic systems on back side of property - call agent for details. All units occupied * DO NOT DISTURB TENANTS!!!!!
Key facts
- 7.87 acre lot
- Built 2022
- Listed 138 days
Property features AI
Finance
- Other: Property located in Temple, Carroll County, GA (ZIP 30179); Parcel reference: T04 0050022
- Financial info: Gross income reported: $79,200; Listing offers accepted: 1031 Exchange, Cash, Conventional
- HOA & community: No HOA
Exterior
- Parking: Parking pad / open parking
- Utilities: Public water; Septic tank sewer; Individual electric meters
- Home design: Residential income property; Multi-family / duplex; Six units total
- Construction: Built in 2022
- Exterior features: Aluminum siding; Concrete elements; Vinyl siding; Resale condition; Lot approximately 7.87 acres
Interior
- Heating & cooling: Electric heating with heat pump; Central electric air conditioning
- Interior features: One level; No basement; No fireplaces
Neighborhood map
What this means for you Summary
Snapshot
- This is a multifamily listed at $825k. Condition is rated good.
Deal economics
- At list price, monthly cash flow is $2k ($27k/yr) — positive.
- The deal already cash-flows at list — no discount required.
- Meets the 1% rule at list price ($10k rent vs $825k).
- Recommended offer: $726k (12.0% below list) — sets the bar for market timing.
- Cap rate 9.6% vs local median 4.8% in Temple — top-decile yield for the area; either an underpriced asset or a hidden risk that comps aren't pricing in. Stress-test before assuming the spread holds.
Location & tenants
- Location reads 72/100 on livability (#60 in GA) — a middle-class / working-renter tenant base. Strengths: crime A+, cost of living A+, housing A+; Watch: amenities F, commute F.
- Carroll County (rural): math 42% / reading 41% proficiency, ranked #38 of 174 in GA (top 22%) — families likely to look elsewhere, expect single-tenant / working-renter base with shorter leases.
- Zoned schools: Temple Elementary School (math 37% / reading 38%, grade F, #474 of 1,228 statewide, top 39%, 662 students, 75% FRL); Temple Middle School (math 31% / reading 36%, grade F, #206 of 470 statewide, top 45%, 621 students, 67% FRL); Temple High School (math 22% / reading 22%, grade F, #213 of 424 statewide, top 51%, 746 students, 62% FRL).
- Market conditions: 189 active listings in the ZIP; 9 comparable units currently listed for rent nearby; rentals leasing fast (median 13d on market — plan ~1-2 weeks tenant-placement turnaround); solid renter incomes; 876 units permitted in Carroll County in 2024 (150 in 5+ unit buildings).
- At $10,106/mo this rent would consume 158% of the median local household income ($77k/yr) (locally 396% of renters already pay >50% of income on rent) — very limited rent-growth headroom before tenants either downsize or default.
Forward outlook
- In year one you build about $88k of equity ($6k loan paydown + $82k appreciation (10.0% local appreciation)).
- Carroll County population projected at +12% by 2050 — modest demand growth; plan on rents tracking national, not racing it.
- At projected returns (10.0% appreciation + 3.0% rent growth), your $231k cash investment doubles in ~2 years — after that, you're playing with house money.
- By year 2, paydown + projected appreciation supports a ~$142k cash-out refi (75% LTV) — recoverable capital for the next deal without selling this one.
Negotiation context
- It's been on market 138 days — a 12% lower offer ($726k) is reasonable based on typical stale-listing flexibility.
- 3 sale attempts with the ask held roughly flat each time — persistent listings suggest the price (not the market) is what's stuck; bring a comps-based counter.
Risks & watch-outs
- Climate carrying-cost: major wind risk, 27% chance of damaging wind over 30y; extreme-heat days projected 7→19/yr by 2055 (HVAC capex compounding) — expect insurance premiums to compound above CPI over the hold.
Questions for the listing agent
- It's been on market 138 days. Have you received any prior offers? Is the seller open to a 12% concession, seller financing, or rate buy-down credit?
- Why hasn't it sold? Are there any deal-killer items the seller is aware of (foundation, flood, title, zoning, code violations)?
- Is there a deadline driving the sale (1031 exchange, divorce, estate, relocation)? That informs how much negotiation room exists.
- Schools are D-rated, which usually means shorter tenancies and higher turnover. Who's the typical renter profile here, and what's been the actual vacancy rate?
- What's the average days-on-market for RENTAL listings here right now (not sales)? A rising rental-DOM trend means longer vacancies and softer asking-rent achievability than the comps imply.
- What's the recent tenant-quality profile in this submarket — average credit score on applications, eviction rate, late-payment / NSF rate, and stable-employment percentage? A property-management company in the area should have these aggregated.
- How much new apartment / multifamily construction is in the pipeline within 1–3 miles? Heavy new supply (>2% of stock underway) typically softens rents 12–24 months out; light construction supports rent growth.
Investment metrics
- 1% rule
- 1.22% ✓
- Cap rate
- 9.61%
- Cash-on-cash
- 11.86%
- DSCR
- 1.53
- GRM
- 6.8
CMA / ARV
No comps found within radius.
Projected returns pro-forma
10.0% appreciation · 3.0% rent growth · sell at horizon
- IRR
- 33.0%
- Equity multiple
- 3.58×
- Total profit
- $594,833
- Equity at exit
- $743,225
- IRR
- 28.5%
- Equity multiple
- 8.09×
- Total profit
- $1,637,676
- Equity at exit
- $1,602,794
Cash invested: $231,000 (down + closing). Projections, not guarantees.
Landlord ↔ Tenant lean methodology
- Overall (STATE)
- 90 Strongly Landlord-Friendly
- State Georgia
- 90 Strongly Landlord-Friendly · R+3
- County
- — inherits STATE
- City
- — inherits STATE
ZIP-level market 30179
- Home prices YoY
- 6.7%
- Active inventory
- 189
- Price-to-rent
- 38.7×
Monthly cashflow live
- Estimated rent
- $10,106 high interval (Pro) →
- Mortgage (P&I)
- −$4,326
- Tax est. 1.5%
- −$1,031 /mo · $12,375/yr
- Insurance
- −$344
- HOA
- −$0
- Vacancy / Maint / Mgmt
- −$2,122
- Net cashflow
- $2,282
Break-even live
Sensitivity live
| Price | -10% $2,852 | -5% $2,567 | +0% $2,282 | +5% $1,997 | +10% $1,712 |
|---|---|---|---|---|---|
| Rent | -10% $1,484 | -5% $1,883 | +0% $2,282 | +5% $2,682 | +10% $3,081 |
| Rate | -1.0pp $2,698 | -0.5pp $2,492 | base $2,282 | +0.5pp $2,069 | +1.0pp $1,851 |
6-unit breakdown (identical units grouped — click to expand)
| Units | Beds | Baths | Est. rent |
|---|---|---|---|
| 4× units | 2 | 1 | $7,104 |
| #1 | 2 | 1 | $1,776 |
| #2 | 2 | 1 | $1,776 |
| #3 | 2 | 1 | $1,776 |
| #4 | 2 | 1 | $1,776 |
| 2× units | 1 | 1 | $3,002 |
| #5 | 1 | 1 | $1,501 |
| #6 | 1 | 1 | $1,501 |
| Total (6 units) | $10,106 | ||
UW: 25.0% down · 7.5% · 30yr · 1.5% tax · 5.0% vac · 8.0% maint · 8.0% mgmt
Financing live
Cash to close
- Down payment
- $206,250
- Closing costs
- $24,750
- Reserves months
- —
- Total cash needed
- —
Loan-product check · same deal, 3 products live
Conventional
25% down · 7.5% · 30yr
- Down + closing
- —
- Monthly P&I
- —
- Monthly cashflow
- —
- DSCR
- —
- Eligible?
- —
Personal DTI + credit; lowest rate.
DSCR
20% down · 8.5% · 30yr
- Down + closing
- —
- Monthly P&I
- —
- Monthly cashflow
- —
- DSCR
- —
- Eligible?
- —
No personal income docs; deal must DSCR.
Hard money
10% down · 12.0% · 12mo
- Down + closing
- —
- Monthly P&I
- —
- Monthly cashflow
- —
- DSCR
- —
- Eligible?
- —
Short-term bridge; refi at stabilization.
Rent comps 9 comps
| Address | Beds | Baths | Sqft | Rent | $/sqft | DOM | Units | Dist |
|---|---|---|---|---|---|---|---|---|
| 121 Breckenridge Pt Temple, GA | 3.0 | 2.0 | 1687 | $1,800 | $1.07 | 20d | 1 | 0.67mi |
| 116 Arborwood Way Temple, GA | 3.0 | 2.0 | 1782 | $1,905 | $1.07 | 13d | 1 | 0.68mi |
| 395 Villa Rosa Rd Temple, GA | 2.0 | 1.5–2.5 | 1119 | $1,418 | $1.27 | 1d | 5 | 0.78mi |
| 125 Fawn Ln Temple, GA | 3.0 | 3.0 | 1234 | $1,649 | $1.34 | 44d | 1 | 0.82mi |
| 220 Hunt Club Cir Unit B Temple, GA | 2.0 | 1.0 | — | $1,550 | — | 44d | 1 | 0.83mi |
| 261 Stagecoach Pass Temple, GA | 3.0 | 2.0 | 2205 | $1,779 | $0.81 | 44d | 1 | 0.91mi |
| 269 Villa Rosa Way Temple, GA | 3.0 | 2.0 | 1664 | $1,925 | $1.16 | 2d | 1 | 1.00mi |
| 273 Patriot Dr Temple, GA | 3.0 | 2.0 | 1720 | $2,100 | $1.22 | 13d | 1 | 1.14mi |
| 514 Willow Creek Dr Temple, GA | 3.0 | 2.5 | 1284 | $1,625 | $1.27 | 13d | 1 | 1.22mi |
Listing history 18 events
-
2026-06-18days on market $825,000 Active 138 DOM
-
2026-06-17days on market $825,000 Active 137 DOM
-
2026-06-16days on market $825,000 Active 136 DOM
-
2026-06-15days on market $825,000 Active 135 DOM
-
2026-06-13days on market $825,000 Active 133 DOM
-
2026-06-09days on market $825,000 Active 129 DOM
-
2026-06-08days on market $825,000 Active 128 DOM
-
2026-06-07days on market $825,000 Active 127 DOM
-
2026-06-04days on market $825,000 Active 124 DOM
-
2026-06-03days on market $825,000 Active 123 DOM
-
2026-06-02days on market $825,000 Active 122 DOM
-
2026-06-01days on market $825,000 Active 121 DOM
-
2026-05-31days on market $825,000 Active 120 DOM
-
2026-01-31$825,000 New
-
2026-01-31historical
-
2025-09-12status Back On Market
-
2025-05-21status Under Contract
-
2025-04-13$850,000 New
ⓘ Source: listings_history table (triggers on properties + properties_extension) + one-shot
backfill from property_details.listing_events for pre-trigger history.
Climate risk First Street
- Flood 1/10 Low FEMA zone X (unshaded) · 0% chance over 30 yrs
- Wildfire 3/10 Moderate
- Heat 5/10 Major 7 d/yr ≥102°F today · 19 d/yr by 30 yrs out
- Wind 6/10 Major 27% chance of damaging wind over 30 yrs
- Air quality 3/10 Moderate 3 unhealthy d/yr today · 4 by 30 yrs out
Nearby sold comps map
Loading sold comps map…
Walkable amenities ~0.75 mi
Loading nearby amenities…
Taxation est. · year 1
- Rental income
- $121,272
- − Mortgage interest
- −$46,213
- − Property taxes
- −$12,375
- − Insurance
- −$4,125
- − Repairs & maintenance
- −$9,702
- − Management
- −$9,702
- − Depreciation
- −$24,000
- Taxable income
- $15,156
- Est. tax owed @ 24.0%
- −$3,637
- After-tax cash flow
- $23,751/yr
For passive investors: Depreciation is non-cash, so a rental often shows a tax loss while cash-flowing — sheltering income. Rental losses are passive: they offset passive income freely, and up to $25,000/yr can offset ordinary (W-2) income if you actively participate and your MAGI is under $100k (phasing out to $0 by $150k); unused losses carry forward. On sale, claimed depreciation is recaptured at up to 25%, and gains may owe capital-gains tax (a 1031 exchange can defer both). Figures are a year-1 estimate at your 24.0% rate — not tax advice; consult a CPA.
Condition & rehab AI · 8 photos
This multi-family property offers a good investment opportunity with 6 occupied units. The exteriors and interiors are in good condition, but some updates could significantly enhance its value.
Value-add opportunities
- Both Paint exterior and interior — Enhances curb appeal and interior aesthetics
- Both Replace carpet with hardwood or tile — Improves durability and resale value
- Both Upgrade kitchen appliances — Enhances functionality and appeal
Renovation cost estimate screening
Value-add ROI direction
- Both Paint exterior and interior — Enhances curb appeal and interior aesthetics ↑
- Both Replace carpet with hardwood or tile — Improves durability and resale value ↑
- Both Upgrade kitchen appliances — Enhances functionality and appeal ↑
ⓘ Cost ranges are severity-bucket heuristics (US national rule-of-thumb). Get contractor quotes + a written scope before underwriting a rehab budget.
Schools (NCES district)
- District
- Carroll County
- NCES district ID
- 1300840
- Math proficiency
- 42% ▼ -7.00%
- Reading proficiency
- 41% ▼ -8.00%
- Median HH income
- $48,692
- Composite
- 35.62/100
- National rank
- #4888
- State rank
- #38 of 174 in GA
Livability — Temple
- Score
- 72/100
- State rank
- #60
- US rank
- #5802
Category grades
Schools grade is shown separately in the Schools card above.
Census & demographics
- Census place
- Temple, GA
- County
- Carroll County · 124,888 people
- City population
- 19,882
- Metro
- Atlanta-Sandy Springs-Alpharetta, GA
- Population (ZIP)
- 19,882
- Household income
- $76,571
- Rent vs Own
- Severe rent burden
- 396.0
Population outlook (Carroll County) Hauer SSP2
- Today (2025)
- 123,370 people
- By 2030
- 127,186 · +3.1%
- By 2040
- 133,534 · +8.2%
- By 2050
- 137,612 · +11.5%
- By 2075
- 142,892 · +15.8%
- By 2100
- 136,294 · +10.5%
Race, ethnicity, and origin ACS 2023
- Neighborhood character
- Predominantly White (77%)
- Race & ethnicity
- White 77% Black 15% Hispanic / Latino 5% Two or more races 4%
- Common ancestry
- Italian 1% Lithuanian 1% Serbian 1%
- Foreign-born
- 4% · Canada
- Languages at home
- 95% English-only · Spanish 4%
Political lean MEDSL · Carroll
- 2024 margin
- Solid R (+41.2) · D 29.1% · R 70.3%
- 2008→2024 swing
- -8.2pp toward R · 2008: -32.9pp · 2024: -41.2pp
- All cycles
- 2024: R+41.2 2020: R+39.0 2016: R+40.1 2012: R+37.7 2008: R+32.9
Not yet ingested
- Civics
- —
Market trends
- HPI YoY
- ▲ 27.16%
- Current HPI
- 435.3863
- Rent YoY
- —
- Metro
- Atlanta-Sandy Springs-Alpharetta, GA
- State GDP YoY
- ▲ 2.66%
- F500 in state
- 28
Industry mix (Fortune 500 HQ in GA)
| Industry | F500 HQs | Revenue |
|---|---|---|
| Paper / Packaging | 2 | $29B |
|
||
| Retail | 1 | $160B |
|
||
| Transportation / Logistics | 1 | $91B |
|
||
| Airlines | 1 | $62B |
|
||
| Consumer Goods | 1 | $47B |
|
||
| Utilities | 1 | $25B |
|
||
Price history
-2.9% since first listed5 events — show timeline
- 2026-01-31 Listing Removed — GAMLS
- 2026-01-31 Listed $825,000 GAMLS
- 2025-09-12 Relisted — GAMLS
- 2025-05-21 Pending — GAMLS
- 2025-04-13 Listed $850,000 GAMLS
Cash-flow waterfall
monthlySold comps — $/sqft
last 12 mo · ≤1 miLoading sold comps…