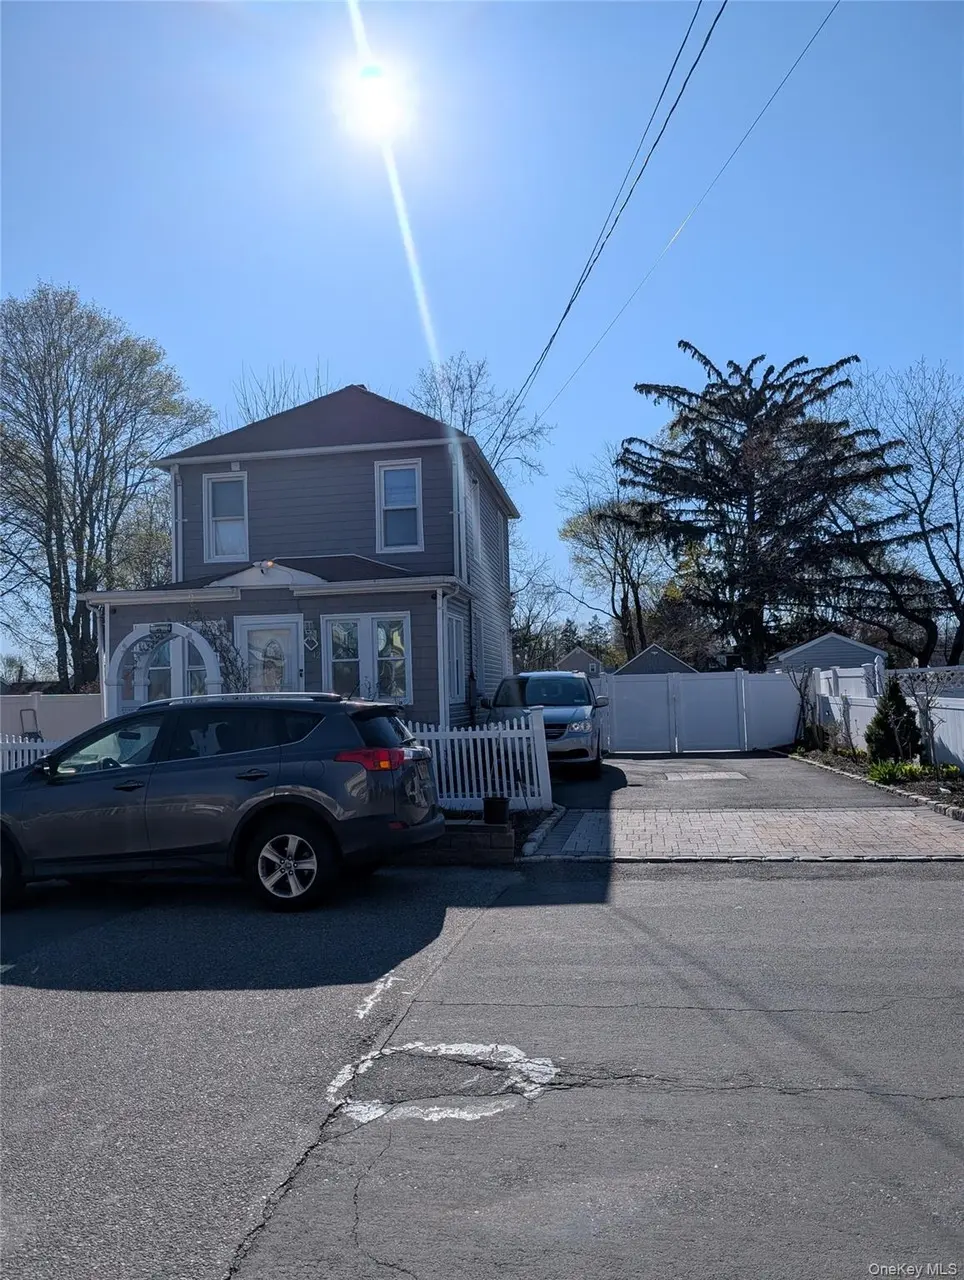
42 3rd Ave · Huntington Station, NY
Flood risk 1/10 · Minimal
- FEMA flood zone
- X (unshaded)
- Chance of flooding over 30 yrs
- 0.0%
- Est. flood insurance / yr
- $473 – $860
Fire risk 1/10 · Minimal
- Est. fire insurance / yr
- $691 – $1,283
Heat risk 5/10 · Moderate
- Hot days now (above 97°F)
- 7 days/yr
- Hot days in 30 yrs
- 15 days/yr
Wind risk 7/10 · Major
- Chance of severe wind over 30 yrs
- 78.0%
Air-quality risk 4/10 · Minor
- Unhealthy air days now
- 4 days/yr
- Unhealthy air days in 30 yrs
- 5 days/yr
Risk factors via First Street. Map © Google.
Why this score? — see what drove the D grade
The composite is a weighted blend of 9 inputs, each scored 0–100. Each bar is that input's sub-score; the figure is the points it added to the 100-point composite (weight × sub-score).
- Cash flow +12.9/30.0
- ARV discount +10.1/15.0
- Schools +4.6/10.0
- Livability +4.0/5.0
- DSCR +3.9/10.0
- Rent growth +3.6/5.0
- 1% rule +2.7/10.0
- Condition / age +2.5/5.0
- Appreciation +0.0/10.0
$630,000
🖨 Deal sheet 📄 Offer letter ✓ Due diligence
Listing remarks MLS
Big Piece Of Property, This Sale Is Subject To A 3rd Party Approval, Perfect House For A 1st Started
Key facts
- Oversized lot
- Pristine curb appeal
- 0.25 acre lot
Tags
Property features AI
Exterior
- Parking: Private driveway; Garage (1 space)
- Utilities: Electric service by PSEG; Cesspool sewer; Natural gas available and connected
- Home design: Single-family residence; Updated/remodeled; Measured living area
- Construction: Frame construction
- Exterior features: Frame construction; Not waterfront
Interior
- Kitchen: Cooktop; Refrigerator
- Bedrooms: 7 total rooms (includes bedroom on first floor)
- Flooring: Ceramic tile; Wood
- Bathrooms: 2 full bathrooms
- Heating & cooling: Natural gas heating; Wall/window air conditioning units
- Interior features: First-floor bedroom; First-floor full bath; Kitchen island; Marble counters; Natural woodwork; Open kitchen; Dining area
- Laundry & utility: Basement access (Bilco door(s))
Neighborhood map
What this means for you Summary
Snapshot
- This is a 4-bed/2.0-bath single-family listed at $630k.
Deal economics
- At list price, monthly cash flow is $-42 ($-499/yr) — negative.
- To cash-flow at today's rent, offer at most $623k (1.2% below list).
- To meet the 1% rule (rent ≥ 1% of price), the offer needs to be $483k (23.3% below list).
- Recommended offer: $483k (23.3% below list) — sets the bar for 1% rule.
- Cap rate 6.2% vs local median 4.1% in Huntington Station — top-decile yield for the area; either an underpriced asset or a hidden risk that comps aren't pricing in. Stress-test before assuming the spread holds.
Location & tenants
- Location reads 79/100 on livability (#126 in NY, #2,028 nationally) — a middle-class / working-renter tenant base. Strengths: commute A+, employment A+, housing A+; Watch: schools D+, amenities D, cost of living F.
- Huntington Union Free School District (suburban): math 45% / reading 52% proficiency, ranked #328 of 590 in NY (top 56%) — families likely to look elsewhere, expect single-tenant / working-renter base with shorter leases.
- Market conditions: Rents rising fast (+4.5%/yr); 308 active listings in the ZIP; 2 comparable units currently listed for rent nearby; high-income renter base; 1,366 units permitted in Suffolk County in 2024 (216 in 5+ unit buildings).
- This rent runs 35% of the median local income ($165k/yr) — at the standard rent-burdened threshold; future hikes will face affordability resistance.
Forward outlook
- Local home prices are declining (-3.0%/yr); year-one equity from $4k of loan paydown is wiped out by about $19k of value loss. Plan a longer hold.
- Suffolk County population projected to shrink 5% by 2050 — rents likely to lag national; underwrite the cash flow, not the appreciation.
Negotiation context
- It's been on market 30 days — a 2% lower offer ($621k) is reasonable based on typical stale-listing flexibility.
- 6 sale attempts since 14y ago; this cycle's ask is 9% above the opening price — seller raised mid-cycle; expect resistance to lowballs.
- Current owner paid $175k; list at $630k implies a 259% gain — meaningful room to come down on a strong offer.
Risks & watch-outs
- Watch-outs: built in 1940 — expect roof / HVAC / electrical / plumbing capex.
- Climate carrying-cost: major wind risk, 78% chance of damaging wind over 30y; extreme-heat days projected 7→15/yr by 2055 (HVAC capex compounding) — expect insurance premiums to compound above CPI over the hold.
Questions for the listing agent
- What do current leases actually rent for vs. the listed asking? Can we see a recent rent roll and the last 12 months of T-12 income?
- Built in 1940 — when were the roof, HVAC, electrical panel, plumbing, and water heater last replaced?
- Is there a deadline driving the sale (1031 exchange, divorce, estate, relocation)? That informs how much negotiation room exists.
- Schools are D-rated, which usually means shorter tenancies and higher turnover. Who's the typical renter profile here, and what's been the actual vacancy rate?
- The area grade is low — what's the realistic commute time and amenity access for the typical tenant pool here? Any planned neighborhood developments (good or bad) we should know about?
- What's the average days-on-market for RENTAL listings here right now (not sales)? A rising rental-DOM trend means longer vacancies and softer asking-rent achievability than the comps imply.
- What's the recent tenant-quality profile in this submarket — average credit score on applications, eviction rate, late-payment / NSF rate, and stable-employment percentage? A property-management company in the area should have these aggregated.
- How much new for-sale + rental construction is in the pipeline within 1–3 miles? Heavy new supply typically softens prices + rents 12–24 months out; constrained supply supports both.
Investment metrics
- 1% rule
- 0.77% ✗
- Cap rate
- 6.21%
- Cash-on-cash
- -0.28%
- DSCR
- 0.99
- GRM
- 10.9
CMA / ARV
- ARV (on-the-fly)
- $668,800
- Comps found
- 12
Show comp detail 12 sales within ~0.75 mi
| Address | Dist | Beds/Ba | Sqft | Sold | Price | $/sf | Match |
|---|---|---|---|---|---|---|---|
| 22 W 12th St | 0.16mi | 3/1.0 (-1) | 1,500 (-6%) | 1mo | $530,000 | $353 | 72 |
| 107 E 9th St | 0.58mi | 3/2.0 (-1) | 1,578 (-1%) | 1mo | $575,000 | $364 | 65 |
| 54 E 15th St | 0.43mi | 4/2.0 | 1,460 (-9%) | 5mo | $615,000 | $421 | 61 |
| 43 Columbia St | 0.56mi | 3/2.0 (-1) | 1,540 (-4%) | 3mo | $455,700 | $296 | 60 |
| 92 Columbia St | 0.49mi | 4/2.5 | 1,500 (-6%) | 6mo | $690,000 | $460 | 60 |
| 57 E Pulaski | 0.38mi | 3/2.0 (-1) | 1,400 (-12%) | 4mo | $475,000 | $339 | 54 |
| 36 W 19th St | 0.73mi | 5/3.0 (+1) | 1,650 (+3%) | 3mo | $689,000 | $418 | 49 |
| 9 Lynch St | 0.54mi | 3/2.0 (-1) | 1,400 (-12%) | 1mo | $650,000 | $464 | 48 |
| 46 Crestwood Dr | 0.65mi | 3/2.0 (-1) | 1,800 (+12%) | 3mo | $743,000 | $413 | 42 |
| 205 Lenox Rd | 0.73mi | 3/2.0 (-1) | 1,800 (+12%) | 2mo | $665,000 | $369 | 38 |
| 128 Winding St | 0.58mi | 3/1.0 (-1) | 1,398 (-13%) | 6mo | $635,000 | $454 | 37 |
| 119 E 13th St | 0.72mi | 3/1.0 (-1) | 1,400 (-12%) | 0mo | $650,000 | $464 | 36 |
Match score weights: distance 35% · size 25% · config 20% · recency 20%. Top-matched comps best support the ARV.
Projected returns pro-forma
-3.0% appreciation · 4.54% rent growth · sell at horizon
- IRR
- -15.3%
- Equity multiple
- 0.45×
- Total profit
- $-97,370
- Equity at exit
- $93,935
- IRR
- -4.6%
- Equity multiple
- 0.68×
- Total profit
- $-56,971
- Equity at exit
- $54,471
Cash invested: $176,400 (down + closing). Projections, not guarantees.
Landlord ↔ Tenant lean methodology
- Overall (STATE)
- 15 Strongly Tenant-Friendly
- State New York
- 15 Strongly Tenant-Friendly · D+10
- County
- — inherits STATE
- City
- — inherits STATE
ZIP-level market 11746
- Rents YoY
- 4.5%
- Active inventory
- 308
- Price-to-rent
- 10.9×
Monthly cashflow live
- Estimated rent
- $4,829 medium interval (Pro) →
- Mortgage (P&I)
- −$3,304
- Tax from tax record
- −$291 /mo · $3,486/yr
- Insurance
- −$262
- HOA
- −$0
- Vacancy / Maint / Mgmt
- −$1,014
- Net cashflow
- $-42
Break-even live
UW: 25.0% down · 7.5% · 30yr · 1.5% tax · 5.0% vac · 8.0% maint · 8.0% mgmt
Financing live
Cash to close
- Down payment
- $157,500
- Closing costs
- $18,900
- Reserves months
- —
- Total cash needed
- —
Loan-product check · same deal, 3 products live
Conventional
25% down · 7.5% · 30yr
- Down + closing
- —
- Monthly P&I
- —
- Monthly cashflow
- —
- DSCR
- —
- Eligible?
- —
Personal DTI + credit; lowest rate.
DSCR
20% down · 8.5% · 30yr
- Down + closing
- —
- Monthly P&I
- —
- Monthly cashflow
- —
- DSCR
- —
- Eligible?
- —
No personal income docs; deal must DSCR.
Hard money
10% down · 12.0% · 12mo
- Down + closing
- —
- Monthly P&I
- —
- Monthly cashflow
- —
- DSCR
- —
- Eligible?
- —
Short-term bridge; refi at stabilization.
Rent comps 2 comps
| Address | Beds | Baths | Sqft | Rent | $/sqft | DOM | Units | Dist |
|---|---|---|---|---|---|---|---|---|
| 1700 E 5th St Huntington Station, NY | 1.0–3.0 | 1.0–2.0 | 1277 | $5,037 | $3.94 | 1d | 1 | 1.06mi |
| 21A Thorney Ave Huntington Station, NY | 4.0 | 2.0 | 1512 | $4,500 | $2.98 | 21d | 1 | 1.18mi |
Listing history 31 events
-
2026-06-18days on market $630,000 Active 30 DOM
-
2026-06-17pricedays on market $630,000 Active 29 DOM
-
2026-06-16days on market $575,977 Active 28 DOM
-
2026-06-15days on market $575,977 Active 27 DOM
-
2026-06-13days on market $575,977 Active 25 DOM
-
2026-06-13days on market $575,977 Active 24 DOM
-
2026-06-09days on market $575,977 Active 21 DOM
-
2026-06-08days on market $575,977 Active 20 DOM
-
2026-06-07days on market $575,977 Active 19 DOM
-
2026-06-04days on market $575,977 Active 16 DOM
-
2026-06-03days on market $575,977 Active 15 DOM
-
2026-06-02days on market $575,977 Active 14 DOM
-
2026-06-01days on market $575,977 Active 13 DOM
-
2026-05-31days on market $575,977 Active 12 DOM
-
2026-04-15$575,977 Active
-
2014-02-19soldstatus $175,300
-
2014-01-29soldstatus $175,300 Closed 100-char remark
Show marketing remark (194 chars)
Big Piece Of Property, This Sale Is Subject To A 3rd Party Approval, Perfect House For A 1st Started, Additional information: Appearance:Good,Interior Features:Lr/Dr,Separate Hotwater Heater:Yes
-
2014-01-29soldstatus $175,300 194-char remark
Show marketing remark (194 chars)
Big Piece Of Property, This Sale Is Subject To A 3rd Party Approval, Perfect House For A 1st Started, Additional information: Appearance:Good,Interior Features:Lr/Dr,Separate Hotwater Heater:Yes
-
2014-01-29soldstatus $175,300
Show marketing remark (194 chars)
Big Piece Of Property, This Sale Is Subject To A 3rd Party Approval, Perfect House For A 1st Started, Additional information: Appearance:Good,Interior Features:Lr/Dr,Separate Hotwater Heater:Yes
-
2014-01-29soldstatus $175,300 Closed
Show marketing remark (194 chars)
Big Piece Of Property, This Sale Is Subject To A 3rd Party Approval, Perfect House For A 1st Started, Additional information: Appearance:Good,Interior Features:Lr/Dr,Separate Hotwater Heater:Yes
-
2014-01-02historical 100-char remark
Show marketing remark (100 chars)
Big Piece Of Property, This Sale Is Subject To A 3rd Party Approval, Perfect House For A 1st Started
-
2013-09-28historical
-
2013-09-17$175,000 New 100-char remark
Show marketing remark (100 chars)
Big Piece Of Property, This Sale Is Subject To A 3rd Party Approval, Perfect House For A 1st Started
-
2013-06-27historical
-
2013-06-20$175,000 New
-
2013-03-27$175,000 194-char remark
Show marketing remark (194 chars)
Big Piece Of Property, This Sale Is Subject To A 3rd Party Approval, Perfect House For A 1st Started, Additional information: Appearance:Good,Interior Features:Lr/Dr,Separate Hotwater Heater:Yes
-
2012-09-27$175,000
-
2012-09-27$149,977
-
2003-09-12soldstatus $212,000
-
1984-09-13soldstatus $62,000
-
1980-09-30soldstatus $29,000
ⓘ Source: listings_history table (triggers on properties + properties_extension) + one-shot
backfill from property_details.listing_events for pre-trigger history.
Tax reassessment forecast NY · Partial reset (capped growth)
- Current annual tax
- $3,486 · $291/mo
- Projected year-2 tax
- $7,067 · $589/mo
- Expected delta
- +$3,580/yr (+$298/mo · 102.7%)
ⓘ Screening estimate from a state-policy table — verify with the county assessor before closing.
Climate risk First Street
- Flood 1/10 Low FEMA zone X (unshaded) · 0% chance over 30 yrs
- Wildfire 1/10 Low
- Heat 5/10 Major 7 d/yr ≥97°F today · 15 d/yr by 30 yrs out
- Wind 7/10 Severe 78% chance of damaging wind over 30 yrs
- Air quality 4/10 Moderate 4 unhealthy d/yr today · 5 by 30 yrs out
Nearby sold comps map
Loading sold comps map…
Walkable amenities ~0.75 mi
Loading nearby amenities…
Taxation est. · year 1
- Rental income
- $57,953
- − Mortgage interest
- −$35,290
- − Property taxes
- −$3,486
- − Insurance
- −$3,150
- − Repairs & maintenance
- −$4,636
- − Management
- −$4,636
- − Depreciation
- −$18,327
- Taxable loss
- −$11,573
- Est. tax savings @ 24.0%
- +$2,778
- After-tax cash flow
- $2,279/yr
For passive investors: Depreciation is non-cash, so a rental often shows a tax loss while cash-flowing — sheltering income. Rental losses are passive: they offset passive income freely, and up to $25,000/yr can offset ordinary (W-2) income if you actively participate and your MAGI is under $100k (phasing out to $0 by $150k); unused losses carry forward. On sale, claimed depreciation is recaptured at up to 25%, and gains may owe capital-gains tax (a 1031 exchange can defer both). Figures are a year-1 estimate at your 24.0% rate — not tax advice; consult a CPA.
Schools (NCES district)
- District
- Huntington Union Free School District
- NCES district ID
- 3615090
- Math proficiency
- 45% ▼ -8.00%
- Reading proficiency
- 52% ▼ -1.00%
- Median HH income
- $93,547
- Composite
- 45.68/100
- National rank
- #2578
- State rank
- #328 of 590 in NY
Livability — Huntington Station
- Score
- 79/100
- State rank
- #126
- US rank
- #2028
Category grades
Schools grade is shown separately in the Schools card above.
Census & demographics
- Census place
- Huntington Station, NY
- County
- Suffolk County · 679,920 people
- Metro
- New York-Newark-Jersey City, NY-NJ-PA
- Population (ZIP)
- 65,747
- Household income
- $164,589
- Rent vs Own
- Severe rent burden
- 627.0
Population outlook (Suffolk County) Hauer SSP2
- Today (2025)
- 1,505,262 people
- By 2030
- 1,498,318 · -0.5%
- By 2040
- 1,471,101 · -2.3%
- By 2050
- 1,424,848 · -5.3%
- By 2075
- 1,337,157 · -11.2%
- By 2100
- 1,217,720 · -19.1%
Race, ethnicity, and origin ACS 2023
- Neighborhood character
- Diverse neighborhood (Simpson 0.58)
- Race & ethnicity
- White 61% Hispanic / Latino 19% Two or more races 10% Asian 8% Black 7% Native American 1%
- Hispanic origin (detail)
- Mexican 2% Puerto Rican 2%
- Common ancestry
- Romanian 5% Scotch-Irish 3% Italian 1%
- Foreign-born
- 20% · Canada, China, Jamaica
- Languages at home
- 70% English-only · Spanish 15% Other Indo-European 6% Chinese 2%
Political lean MEDSL · Suffolk
- 2024 margin
- Lean R (+10.0) · D 45.0% · R 55.0%
- 2008→2024 swing
- -16.0pp toward R · 2008: 6.0pp · 2024: -10.0pp
- All cycles
- 2024: R+10.0 2020: R+0.0 2016: R+8.2 2012: D+2.9 2008: D+6.0
Not yet ingested
- Civics
- —
Market trends
- HPI YoY
- ▼ -715.60%
- Current HPI
- 317.5657
- Rent YoY
- ▲ 4.54%
- Metro
- New York-Newark-Jersey City, NY-NJ-PA
- State GDP YoY
- ▲ 2.60%
- F500 in state
- 92
Industry mix (Fortune 500 HQ in NY)
| Industry | F500 HQs | Revenue |
|---|---|---|
| Financial Services | 10 | $950B |
|
||
| Consumer Goods | 9 | $162B |
|
||
| Insurance | 4 | $225B |
|
||
| Telecommunications | 2 | $144B |
|
||
| Pharmaceuticals | 2 | $112B |
|
||
| Media / Entertainment | 2 | $69B |
|
||
Price history
+1886.1% since first listed17 events — show timeline
- 2026-04-15 Listed $575,977 OneKey® MLS as Distributed by MLS Grid
- 2014-02-19 Sold (Public Records) $175,300 Public Records
- 2014-01-29 Sold (MLS) $175,300 MLSLI
- 2014-01-29 Sold (MLS) $175,300 OneKey® MLS as Distributed by MLS Grid
- 2014-01-29 Sold (MLS) $175,300 OneKey® MLS as Distributed by MLS Grid
- 2014-01-29 Sold (MLS) $175,300 MLSLI
- 2014-01-02 Delisted — MLSLI
- 2013-09-28 Delisted — MLSLI
- 2013-09-17 Listed $175,000 MLSLI
- 2013-06-27 Listing Removed — OneKey® MLS as Distributed by MLS Grid
- 2013-06-20 Listed $175,000 MLSLI
- 2013-03-27 Listed $175,000 OneKey® MLS as Distributed by MLS Grid
- 2012-09-27 Listed $149,977 OneKey® MLS as Distributed by MLS Grid
- 2012-09-27 Listed $175,000 OneKey® MLS as Distributed by MLS Grid
- 2003-09-12 Sold (Public Records) $212,000 Public Records
- 1984-09-13 Sold (Public Records) $62,000 Public Records
- 1980-09-30 Sold (Public Records) $29,000 Public Records
Property tax history
+0.6%/yrLatest (2025): $3,486 · +0.0% YoY. Source: county tax records.
Cash-flow waterfall
monthlySold comps — $/sqft
last 12 mo · ≤1 miLoading sold comps…