 5-Plex
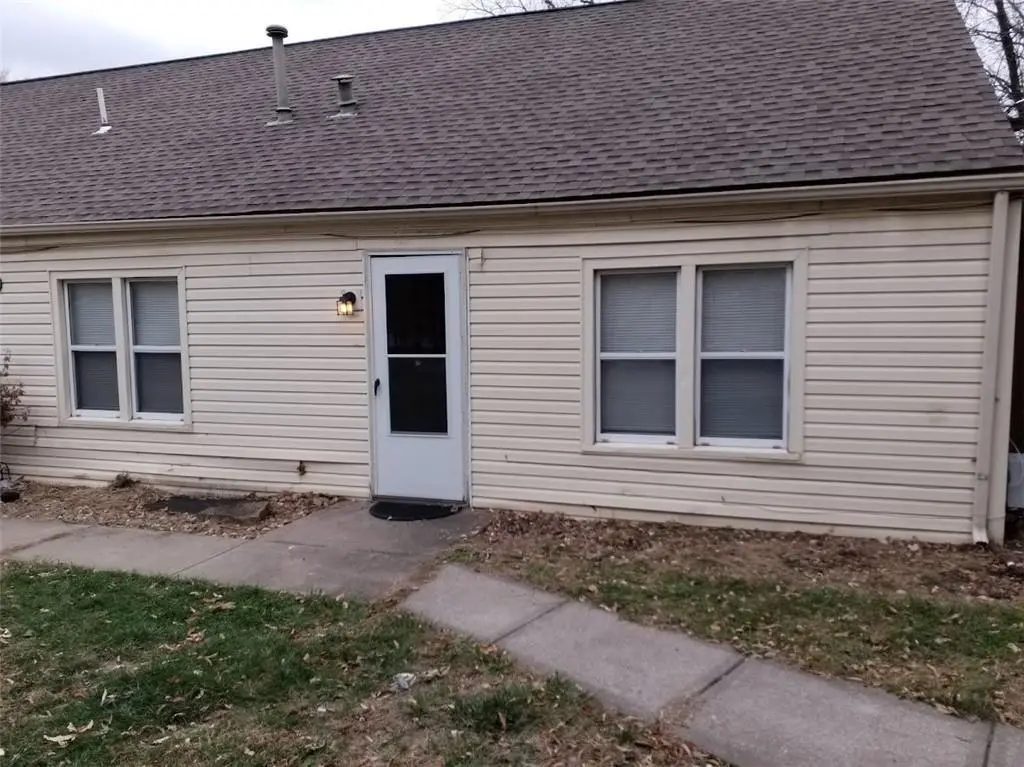
8828 N Main St · Kansas City, MO
Flood risk 1/10 · Minimal
- FEMA flood zone
- X (unshaded)
- Chance of flooding over 30 yrs
- 0.0%
- Est. flood insurance / yr
- $507 – $1,088
Fire risk 2/10 · Minimal
- Est. fire insurance / yr
- $1,054 – $1,958
Heat risk 4/10 · Minor
- Hot days now (above 106°F)
- 7 days/yr
- Hot days in 30 yrs
- 17 days/yr
Wind risk 2/10 · Minimal
- Chance of severe wind over 30 yrs
- —
Air-quality risk 2/10 · Minimal
- Unhealthy air days now
- 2 days/yr
- Unhealthy air days in 30 yrs
- 2 days/yr
Risk factors via First Street. Map © Google.
Why this score? — see what drove the B grade
The composite is a weighted blend of 9 inputs, each scored 0–100. Each bar is that input's sub-score; the figure is the points it added to the 100-point composite (weight × sub-score).
- Cash flow +30.0/30.0
- DSCR +10.0/10.0
- 1% rule +9.8/10.0
- ARV discount +9.6/15.0
- Rent growth +4.2/5.0
- Livability +3.9/5.0
- Schools +3.8/10.0
- Condition / age +2.5/5.0
- Appreciation +0.0/10.0
$450,000
🖨 Deal sheet 📄 Offer letter ✓ Due diligence
Multi-family units
County records classify this as Multi-Family (5+ Unit). Listing-text estimate: 5 units. confirmed
5+ unit building — per-unit beds/baths from public records are typically unavailable; the breakdown below (if shown) is an estimate from the listing text.
Listing remarks MLS
SELLER IS OFFERING A SIGNIFICANT RATE BUY DOWN TO QUALIFIED BUYERS. REACH OUT TO LISTING AGENT TO LEARN MORE. THIS OFFER IS OPEN TO HOMEOWNERS AND INVESTORS. Calling all investors! Commercial 5 plex up north great investment in a great area with NEW Septic in 2025. 2 studio apartments. 1 bath. 2, 1 bedroom. 1bath. 1, 2 bedroom. 2 bath. Close to shopping area, off-street concrete parking, some storage, separate electric meters and has a Huge Green Space. Great 1031 exchange property. Unit 1a. 800 rented annual lease Unit 2b 700 rented annual lease unit 3c rented 700 annual lease Unit 4d rented at 725 Unit 5E 2 bed unit 1,000 annual lease $47,100 gross rental income Seller is a licensed salesperson in Missouri.
Key facts
- New septic
- Huge green space
- 0.88 acre lot
Tags
Neighborhood map
What this means for you Summary
Snapshot
- This is a 3×1bd/1ba + 2×2bd/2ba units multifamily listed at $450k.
Deal economics
- At list price, monthly cash flow is $2k ($28k/yr) — positive. Per door: $473/mo.
- The deal already cash-flows at list — no discount required.
- Meets the 1% rule at list price ($7k rent vs $450k).
- Recommended offer: $396k (12.0% below list) — sets the bar for market timing.
- Cap rate 12.6% vs local median 3.9% in Kansas City — top-decile yield for the area; either an underpriced asset or a hidden risk that comps aren't pricing in. Stress-test before assuming the spread holds.
Location & tenants
- Location reads 78/100 on livability (#28 in MO, #2,671 nationally) — a middle-class / working-renter tenant base. Strengths: amenities A+, commute A+, cost of living A+; Watch: schools C-, crime F.
- North Kansas City 74 (urban): math 38% / reading 49% proficiency, ranked #98 of 324 in MO (top 30%) — families likely to look elsewhere, expect single-tenant / working-renter base with shorter leases.
- Market conditions: Rents rising fast (+6.9%/yr); 248 active listings in the ZIP; solid renter incomes; 341 units permitted in Clay County in 2024 (40 in 5+ unit buildings).
- At $6,652/mo this rent would consume 82% of the median local household income ($97k/yr) (locally 635% of renters already pay >50% of income on rent) — very limited rent-growth headroom before tenants either downsize or default.
Forward outlook
- Local home prices are declining (-3.0%/yr); year-one equity from $3k of loan paydown is wiped out by about $14k of value loss. Plan a longer hold.
- Clay County population projected at +24% by 2050 — long-run rental-demand tailwind backs the buy-and-hold thesis.
- At projected returns (-3.0% appreciation + 6.9% rent growth), your $126k cash investment doubles in ~5 years — after that, you're playing with house money.
Negotiation context
- It's been on market 386 days — a 12% lower offer ($396k) is reasonable based on typical stale-listing flexibility.
- 6 sale attempts since 20y ago with the ask held roughly flat each time — persistent listings suggest the price (not the market) is what's stuck; bring a comps-based counter.
Questions for the listing agent
- It's been on market 386 days. Have you received any prior offers? Is the seller open to a 12% concession, seller financing, or rate buy-down credit?
- Can we see the unit-by-unit rent roll, current vacancy, and any below-market leases? What's the average tenancy length?
- What capital expenditures (roof, boiler, parking lot, exteriors) have been made in the last 5 years, and what's planned in the next 2?
- Why hasn't it sold? Are there any deal-killer items the seller is aware of (foundation, flood, title, zoning, code violations)?
- Is there a deadline driving the sale (1031 exchange, divorce, estate, relocation)? That informs how much negotiation room exists.
- Crime grade is F in this area — have there been break-ins, vandalism, or insurance claims at this property in the last 3 years? What carrier currently insures it and at what premium?
- What's the average days-on-market for RENTAL listings here right now (not sales)? A rising rental-DOM trend means longer vacancies and softer asking-rent achievability than the comps imply.
- What's the recent tenant-quality profile in this submarket — average credit score on applications, eviction rate, late-payment / NSF rate, and stable-employment percentage? A property-management company in the area should have these aggregated.
- How much new apartment / multifamily construction is in the pipeline within 1–3 miles? Heavy new supply (>2% of stock underway) typically softens rents 12–24 months out; light construction supports rent growth.
Investment metrics
- 1% rule
- 1.48% ✓
- Cap rate
- 12.59%
- Cash-on-cash
- 22.50%
- DSCR
- 2.00
- GRM
- 5.6
CMA / ARV
- ARV (median comp)
- $471,595
- List price
- $450,000
- Delta
- -4.58%
- Verdict
- FAIR
- Comps
- 3 within 2.0 mi
Projected returns pro-forma
-3.0% appreciation · 6.92% rent growth · sell at horizon
- IRR
- 19.5%
- Equity multiple
- 1.83×
- Total profit
- $104,787
- Equity at exit
- $67,096
- IRR
- 30.3%
- Equity multiple
- 4.22×
- Total profit
- $406,190
- Equity at exit
- $38,908
Cash invested: $126,000 (down + closing). Projections, not guarantees.
Landlord ↔ Tenant lean methodology
- Overall (STATE)
- 81 Strongly Landlord-Friendly
- State Missouri
- 81 Strongly Landlord-Friendly · R+10
- County
- — inherits STATE
- City
- — inherits STATE
ZIP-level market 64155
- Rents YoY
- 6.9%
- Active inventory
- 248
- Price-to-rent
- 33.7×
Monthly cashflow live
- Estimated rent
- $6,652 high interval (Pro) →
- Mortgage (P&I)
- −$2,360
- Tax from tax record
- −$345 /mo · $4,143/yr
- Insurance
- −$188
- HOA
- −$0
- Vacancy / Maint / Mgmt
- −$1,397
- Net cashflow
- $2,363
Break-even live
5-unit breakdown (identical units grouped — click to expand)
| Units | Beds | Baths | Est. rent |
|---|---|---|---|
| 3× units | 1 | 1 | $3,342 |
| #1 | 1 | 1 | $1,114 |
| #2 | 1 | 1 | $1,114 |
| #3 | 1 | 1 | $1,114 |
| 2× units | 2 | 2 | $3,310 |
| #4 | 2 | 2 | $1,655 |
| #5 | 2 | 2 | $1,655 |
| Total (5 units) | $6,652 | ||
UW: 25.0% down · 7.5% · 30yr · 1.5% tax · 5.0% vac · 8.0% maint · 8.0% mgmt
Financing live
Cash to close
- Down payment
- $112,500
- Closing costs
- $13,500
- Reserves months
- —
- Total cash needed
- —
Loan-product check · same deal, 3 products live
Conventional
25% down · 7.5% · 30yr
- Down + closing
- —
- Monthly P&I
- —
- Monthly cashflow
- —
- DSCR
- —
- Eligible?
- —
Personal DTI + credit; lowest rate.
DSCR
20% down · 8.5% · 30yr
- Down + closing
- —
- Monthly P&I
- —
- Monthly cashflow
- —
- DSCR
- —
- Eligible?
- —
No personal income docs; deal must DSCR.
Hard money
10% down · 12.0% · 12mo
- Down + closing
- —
- Monthly P&I
- —
- Monthly cashflow
- —
- DSCR
- —
- Eligible?
- —
Short-term bridge; refi at stabilization.
Listing history 36 events
-
2026-06-18days on market $450,000 Active 386 DOM
-
2026-06-17days on market $450,000 Active 385 DOM
-
2026-06-16days on market $450,000 Active 384 DOM
-
2026-06-15days on market $450,000 Active 383 DOM
-
2026-06-13days on market $450,000 Active 381 DOM
-
2026-06-13days on market $450,000 Active 380 DOM
-
2026-06-09days on market $450,000 Active 377 DOM
-
2026-06-08days on market $450,000 Active 376 DOM
-
2026-06-07days on market $450,000 Active 375 DOM
-
2026-06-05days on market $450,000 Active 372 DOM
-
2026-06-03days on market $450,000 Active 371 DOM
-
2026-06-02days on market $450,000 Active 370 DOM
-
2026-06-01days on market $450,000 Active 369 DOM
-
2026-05-31days on market $450,000 Active 368 DOM
-
2025-05-28$450,000 Active 723-char remark
Show marketing remark (723 chars)
SELLER IS OFFERING A SIGNIFICANT RATE BUY DOWN TO QUALIFIED BUYERS. REACH OUT TO LISTING AGENT TO LEARN MORE. THIS OFFER IS OPEN TO HOMEOWNERS AND INVESTORS. Calling all investors! Commercial 5 plex up north great investment in a great area with NEW Septic in 2025. 2 studio apartments. 1 bath. 2, 1 bedroom. 1bath. 1, 2 bedroom. 2 bath. Close to shopping area, off-street concrete parking, some storage, separate electric meters and has a Huge Green Space. Great 1031 exchange property. Unit 1a. 800 rented annual lease Unit 2b 700 rented annual lease unit 3c rented 700 annual lease Unit 4d rented at 725 Unit 5E 2 bed unit 1,000 annual lease $47,100 gross rental income Seller is a licensed salesperson in Missouri.
-
2025-04-30historical
-
2025-03-12price $475,000
-
2025-01-03price $479,900
-
2024-07-24price $485,000
-
2024-06-27status Active
-
2024-05-31historical
-
2024-05-01price $490,000
-
2024-04-10price $500,000
-
2024-04-03price $515,000
-
2024-03-07price $520,000
-
2024-02-05price $533,000
-
2024-01-31price $535,000
-
2024-01-15price $540,000
-
2023-12-29$550,000 Active
-
2020-11-19soldstatus
-
2020-10-27soldstatus
-
2015-01-05$209,999
-
2014-03-12$219,999
-
2006-08-11soldstatus
-
2006-08-11soldstatus
-
2006-01-12$210,000
ⓘ Source: listings_history table (triggers on properties + properties_extension) + one-shot
backfill from property_details.listing_events for pre-trigger history.
Tax reassessment forecast MO · Resets to sale price
- Current annual tax
- $4,143 · $345/mo
- Projected year-2 tax
- $4,365 · $364/mo
- Expected delta
- +$222/yr (+$19/mo · 5.4%)
ⓘ Screening estimate from a state-policy table — verify with the county assessor before closing.
Climate risk First Street
- Flood 1/10 Low FEMA zone X (unshaded) · 0% chance over 30 yrs
- Wildfire 2/10 Low
- Heat 4/10 Moderate 7 d/yr ≥106°F today · 17 d/yr by 30 yrs out
- Wind 2/10 Low
- Air quality 2/10 Low 2 unhealthy d/yr today · 2 by 30 yrs out
Nearby sold comps map
Loading sold comps map…
Walkable amenities ~0.75 mi
Loading nearby amenities…
Taxation est. · year 1
- Rental income
- $79,824
- − Mortgage interest
- −$25,207
- − Property taxes
- −$4,143
- − Insurance
- −$2,250
- − Repairs & maintenance
- −$6,386
- − Management
- −$6,386
- − Depreciation
- −$13,091
- Taxable income
- $22,362
- Est. tax owed @ 24.0%
- −$5,367
- After-tax cash flow
- $22,983/yr
For passive investors: Depreciation is non-cash, so a rental often shows a tax loss while cash-flowing — sheltering income. Rental losses are passive: they offset passive income freely, and up to $25,000/yr can offset ordinary (W-2) income if you actively participate and your MAGI is under $100k (phasing out to $0 by $150k); unused losses carry forward. On sale, claimed depreciation is recaptured at up to 25%, and gains may owe capital-gains tax (a 1031 exchange can defer both). Figures are a year-1 estimate at your 24.0% rate — not tax advice; consult a CPA.
Schools (NCES district)
- District
- North Kansas City 74
- NCES district ID
- 2922800
- Math proficiency
- 38% ▼ -11.00%
- Reading proficiency
- 49% ▼ -3.00%
- Median HH income
- $55,444
- Composite
- 37.88/100
- National rank
- #4321
- State rank
- #98 of 324 in MO
Livability — Kansas City
- Score
- 78/100
- State rank
- #28
- US rank
- #2671
Category grades
Schools grade is shown separately in the Schools card above.
Census & demographics
- Census place
- Kansas City, MO
- County
- Clay County · 220,651 people
- City population
- 439,467
- Metro
- Kansas City, MO-KS
- Population (ZIP)
- 28,824
- Household income
- $97,471
- Rent vs Own
- Severe rent burden
- 635.0
Population outlook (Clay County) Hauer SSP2
- Today (2025)
- 266,022 people
- By 2030
- 280,057 · +5.3%
- By 2040
- 306,153 · +15.1%
- By 2050
- 328,630 · +23.5%
- By 2075
- 375,182 · +41.0%
- By 2100
- 392,861 · +47.7%
Race, ethnicity, and origin ACS 2023
- Neighborhood character
- Predominantly White (75%)
- Race & ethnicity
- White 75% Hispanic / Latino 10% Black 8% Two or more races 8% Asian 2%
- Hispanic origin (detail)
- Mexican 6%
- Common ancestry
- Italian 4% Lithuanian 3% Iranian 2%
- Foreign-born
- 6% · Canada, Vietnam
- Languages at home
- 93% English-only · Spanish 3% Vietnamese 1% Other Indo-European 1%
Political lean MEDSL · Clay
- 2024 margin
- Lean R (+5.6) · D 46.4% · R 52.0% · Other 1.6%
- 2008→2024 swing
- -4.9pp toward R · 2008: -0.7pp · 2024: -5.6pp
- All cycles
- 2024: R+5.6 2020: R+4.1 2016: R+11.1 2012: R+8.4 2008: R+0.7
Not yet ingested
- Civics
- —
Market trends
- HPI YoY
- ▼ -234.09%
- Current HPI
- 219.9706
- Rent YoY
- ▲ 6.92%
- Metro
- Kansas City, MO-KS
- State GDP YoY
- ▲ 1.84%
- F500 in state
- 20
Industry mix (Fortune 500 HQ in MO)
| Industry | F500 HQs | Revenue |
|---|---|---|
| Healthcare | 1 | $163B |
|
||
| Insurance | 1 | $21B |
|
||
| Industrial Technology | 1 | $17B |
|
||
| Retail | 1 | $16B |
|
||
| Industrial Distribution | 1 | $10B |
|
||
| Utilities | 1 | $9B |
|
||
Price history
+114.3% since first listed22 events — show timeline
- 2025-05-28 Listed $450,000 Heartland MLS as Distributed by MLS Grid
- 2025-04-30 Listing Removed — Heartland MLS as Distributed by MLS Grid
- 2025-03-12 Price Changed $475,000 Heartland MLS as Distributed by MLS Grid
- 2025-01-03 Price Changed $479,900 Heartland MLS as Distributed by MLS Grid
- 2024-07-24 Price Changed $485,000 Heartland MLS as Distributed by MLS Grid
- 2024-06-27 Relisted — Heartland MLS as Distributed by MLS Grid
- 2024-05-31 Listing Removed — Heartland MLS as Distributed by MLS Grid
- 2024-05-01 Price Changed $490,000 Heartland MLS as Distributed by MLS Grid
- 2024-04-10 Price Changed $500,000 Heartland MLS as Distributed by MLS Grid
- 2024-04-03 Price Changed $515,000 Heartland MLS as Distributed by MLS Grid
- 2024-03-07 Price Changed $520,000 Heartland MLS as Distributed by MLS Grid
- 2024-02-05 Price Changed $533,000 Heartland MLS as Distributed by MLS Grid
- 2024-01-31 Price Changed $535,000 Heartland MLS as Distributed by MLS Grid
- 2024-01-15 Price Changed $540,000 Heartland MLS as Distributed by MLS Grid
- 2023-12-29 Listed $550,000 Heartland MLS as Distributed by MLS Grid
- 2020-11-19 Sold (Public Records) — Public Records
- 2020-10-27 Sold (Public Records) — Public Records
- 2015-01-05 Listed $209,999 Heartland MLS as Distributed by MLS Grid
- 2014-03-12 Listed $219,999 Heartland MLS as Distributed by MLS Grid
- 2006-08-11 Sold (Public Records) — Public Records
- 2006-08-11 Sold (MLS) — Heartland MLS as Distributed by MLS Grid
- 2006-01-12 Listed $210,000 Heartland MLS as Distributed by MLS Grid
Property tax history
+8.2%/yrLatest (2025): $4,143 · +29.9% YoY. Source: county tax records.
Cash-flow waterfall
monthlySold comps — $/sqft
last 12 mo · ≤1 miLoading sold comps…