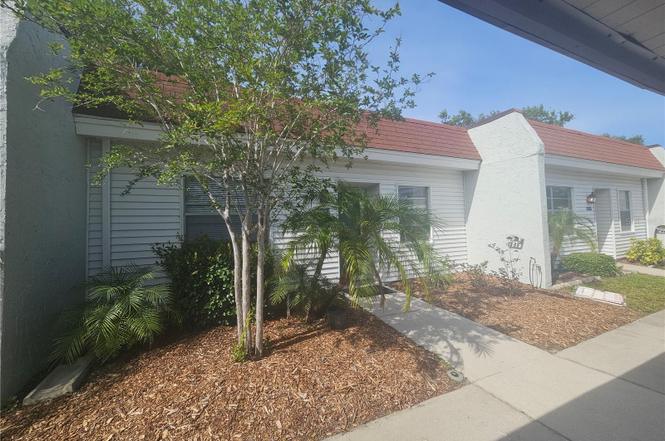
13813 Mission Oaks Blvd · Seminole, FL
Flood risk 1/10 · Minimal
- FEMA flood zone
- X (unshaded)
- Chance of flooding over 30 yrs
- 0.0%
- Est. flood insurance / yr
- $507 – $1,088
Fire risk 1/10 · Minimal
- Est. fire insurance / yr
- $947 – $1,759
Heat risk 10/10 · Severe
- Hot days now (above 107°F)
- 7 days/yr
- Hot days in 30 yrs
- 28 days/yr
Wind risk 10/10 · Severe
- Chance of severe wind over 30 yrs
- 99.0%
Air-quality risk 3/10 · Minor
- Unhealthy air days now
- 2 days/yr
- Unhealthy air days in 30 yrs
- 3 days/yr
Risk factors via First Street. Map © Google.
Why this score? — see what drove the D+ grade
The composite is a weighted blend of 9 inputs, each scored 0–100. Each bar is that input's sub-score; the figure is the points it added to the 100-point composite (weight × sub-score).
- Cash flow +14.1/30.0
- 1% rule +10.0/10.0
- ARV discount +7.5/15.0
- Livability +4.4/5.0
- DSCR +4.3/10.0
- Schools +4.3/10.0
- Rent growth +2.5/5.0
- Condition / age +2.5/5.0
- Appreciation +0.0/10.0
$109,900
🖨 Deal sheet (PDF) 📄 Offer letter ✓ Due diligence
Listing remarks
Now Offered at $109,900, Incredible Opportunity in the Heart of Seminole! This well maintained 2 bedroom, 2 bath condo is located in a desirable 55 plus community and offers comfort, convenience, and exceptional value in one of Seminole’s most peaceful and centrally located areas. Featuring a spacious split bedroom layout, this condo is designed for both privacy and functionality. The primary suite includes a walk in shower and generous closet space with built-in organizers, while the guest bath features a tub for added convenience. Natural light fills the living areas, creating a bright and welcoming atmosphere throughout the home. The kitchen offers ample cabinetry, a breakfast bar,
Key facts
- Private backyard
- Split floor plan
- Non-flood zone
Tags
Property features AI
Finance
- Other: Association contact: Robert Shipman
- Financial info: Total monthly fees: $855; Total annual fees: $10,260; Lease restrictions apply
- HOA & community: Monthly condo fee of $855 (includes cable TV, internet, insurance, pool, sewer, water, trash, common area taxes, maintenance of structure and grounds, recreational facilities, escrow reserves fund); Association approval required; Association amenities: laundry, maintenance, shuffleboard court; Community features: clubhouse, community mailbox, deed restrictions, reclaimed water irrigation, pool, sidewalks, no truck/RV/motorcycle parking; Senior community; Pets not allowed
Exterior
- Parking: Covered parking; 1-car carport; Guest parking available
- Utilities: Public water; Public sewer; Electricity available; Water connected; Sewer connected
- Home design: Residential condominium; Attached unit; Single-story; Faces south
- Construction: Block and frame construction; Shingle roof; Other foundation
- Exterior features: Patio; Rear porch; Sidewalks; Landscaped grounds; Paved surfaces
Interior
- Kitchen: Cooktop; Dishwasher; Exhaust fan; Microwave; Freezer; Refrigerator; Electric water heater
- Bedrooms: 2 bedrooms
- Flooring: Ceramic tile; Tile flooring
- Bathrooms: 2 full bathrooms
- Heating & cooling: Central heating (electric); Central air conditioning
- Interior features: Ceiling fans; Split bedroom floor plan; Programmable thermostat; Window shades
- Laundry & utility: Washer hookup; Laundry closet; Common area laundry
Neighborhood map
What this means for you Summary
Snapshot
- This is a 2-bed/2.0-bath condo listed at $110k.
Deal economics
- At list price, monthly cash flow is $17 ($204/yr) — positive.
- The deal already cash-flows at list — no discount required.
- Meets the 1% rule at list price ($2k rent vs $110k).
- Recommended offer: $97k (12.0% below list) — sets the bar for market timing.
- Cap rate 6.5% vs local median 3.8% in Seminole — top-decile yield for the area; either an underpriced asset or a hidden risk that comps aren't pricing in. Stress-test before assuming the spread holds.
Location & tenants
- Location reads 88/100 on livability (#5 in FL, #174 nationally) — a professional / high-income tenant draw. Strengths: commute A+, housing A+, health & safety A+.
- Pinellas (suburban): math 51% / reading 51% proficiency, ranked #31 of 73 in FL (top 42%) — acceptable for families but not a draw, mixed tenant base, ~2y average lease.
- Market conditions: 146 active listings in the ZIP; 12 comparable units currently listed for rent nearby; rentals at typical pace (median 21d on market — plan ~3-4 weeks tenant-placement turnaround); 2,676 units permitted in Pinellas County in 2024 (1,422 in 5+ unit buildings).
Forward outlook
- Local home prices are declining (-3.0%/yr); year-one equity from $760 of loan paydown is wiped out by about $3k of value loss. Plan a longer hold.
- Pinellas County population projected at +14% by 2050 — modest demand growth; plan on rents tracking national, not racing it.
Negotiation context
- It's been on market 431 days — a 12% lower offer ($97k) is reasonable based on typical stale-listing flexibility.
- 6 sale attempts since 21y ago; this cycle's ask is 4895% above the opening price — seller raised mid-cycle; expect resistance to lowballs.
- Current owner paid $75k; 47% above their basis — modest negotiation headroom, anchor on the comps not their cost.
Risks & watch-outs
- Watch-outs: HOA is 42% of rent.
- Climate carrying-cost: severe wind risk, 99% chance of damaging wind over 30y; extreme-heat days projected 7→28/yr by 2055 (HVAC capex compounding) — expect insurance premiums to compound above CPI over the hold.
Questions for the listing agent
- It's been on market 431 days. Have you received any prior offers? Is the seller open to a 12% concession, seller financing, or rate buy-down credit?
- Built in 1974 — when were the roof, HVAC, electrical panel, plumbing, and water heater last replaced?
- What does the HOA fee cover, when was the last increase, and are there any pending special assessments or reserve-fund shortfalls?
- Any open or pending special assessments — roof, HVAC, plumbing, elevator, façade? What's the per-unit balance and payoff schedule, and is the seller paying it off at close or rolling it to the buyer?
- Why hasn't it sold? Are there any deal-killer items the seller is aware of (foundation, flood, title, zoning, code violations)?
- Is there a deadline driving the sale (1031 exchange, divorce, estate, relocation)? That informs how much negotiation room exists.
- Schools are B-rated — typically a magnet for longer-tenancy family renters. What's the average tenant stay here, and is there a school-zone premium baked into asking?
- The area grade is low — what's the realistic commute time and amenity access for the typical tenant pool here? Any planned neighborhood developments (good or bad) we should know about?
- What's the average days-on-market for RENTAL listings here right now (not sales)? A rising rental-DOM trend means longer vacancies and softer asking-rent achievability than the comps imply.
- What's the recent tenant-quality profile in this submarket — average credit score on applications, eviction rate, late-payment / NSF rate, and stable-employment percentage? A property-management company in the area should have these aggregated.
- How much new apartment / multifamily construction is in the pipeline within 1–3 miles? Heavy new supply (>2% of stock underway) typically softens rents 12–24 months out; light construction supports rent growth.
Investment metrics
- 1% rule
- 1.87% ✓
- Cap rate
- 6.48%
- Cash-on-cash
- 0.66%
- DSCR
- 1.03
- GRM
- 4.5
CMA / ARV
No comps found within radius.
Projected returns pro-forma
-3.0% appreciation · 3.0% rent growth · sell at horizon
- IRR
- -14.6%
- Equity multiple
- 0.47×
- Total profit
- $-16,172
- Equity at exit
- $16,386
- IRR
- -5.1%
- Equity multiple
- 0.66×
- Total profit
- $-10,446
- Equity at exit
- $9,502
Cash invested: $30,772 (down + closing). Projections, not guarantees.
Landlord ↔ Tenant lean methodology
- Overall (STATE)
- 87 Strongly Landlord-Friendly
- State Florida
- 87 Strongly Landlord-Friendly · R+3
- County
- — inherits STATE
- City
- — inherits STATE
ZIP-level market 33776
- Active inventory
- 146
- Price-to-rent
- 4.5×
Monthly cashflow live
- Estimated rent
- $2,054 high interval (Pro) →
- Mortgage (P&I)
- −$576
- Tax from tax record
- −$129 /mo · $1,545/yr
- Insurance
- −$46
- HOA
- −$855
- Vacancy / Maint / Mgmt
- −$431
- Net cashflow
- $17
Break-even live
Sensitivity live
| Price | -10% $79 | -5% $48 | +0% $17 | +5% $-14 | +10% $-45 |
|---|---|---|---|---|---|
| Rent | -10% $-145 | -5% $-64 | +0% $17 | +5% $98 | +10% $179 |
| Rate | -1.0pp $72 | -0.5pp $45 | base $17 | +0.5pp $-11 | +1.0pp $-40 |
UW: 25.0% down · 7.5% · 30yr · 1.5% tax · 5.0% vac · 8.0% maint · 8.0% mgmt
Financing live
Cash to close
- Down payment
- $27,475
- Closing costs
- $3,297
- Reserves months
- —
- Total cash needed
- —
Loan-product check · same deal, 3 products live
Conventional
25% down · 7.5% · 30yr
- Down + closing
- —
- Monthly P&I
- —
- Monthly cashflow
- —
- DSCR
- —
- Eligible?
- —
Personal DTI + credit; lowest rate.
DSCR
20% down · 8.5% · 30yr
- Down + closing
- —
- Monthly P&I
- —
- Monthly cashflow
- —
- DSCR
- —
- Eligible?
- —
No personal income docs; deal must DSCR.
Hard money
10% down · 12.0% · 12mo
- Down + closing
- —
- Monthly P&I
- —
- Monthly cashflow
- —
- DSCR
- —
- Eligible?
- —
Short-term bridge; refi at stabilization.
Rent comps 12 comps
| Address | Beds | Baths | Sqft | Rent | $/sqft | DOM | Units | Dist |
|---|---|---|---|---|---|---|---|---|
| 13850 Oakwood Ln Seminole, FL | 2.0 | 1.0 | 805 | $1,400 | $1.74 | 3d | 1 | 0.03mi |
| 9224 Mission Oaks Blvd Seminole, FL | 2.0 | 1.5 | 805 | $1,800 | $2.24 | 25d | 1 | 0.03mi |
| 13827 Mission Oaks Blvd Seminole, FL | 2.0 | 2.0 | 865 | $2,400 | $2.77 | 25d | 1 | 0.03mi |
| 13870 Oakwood Ln Seminole, FL | 2.0 | 2.0 | 865 | $2,600 | $3.01 | 4d | 1 | 0.08mi |
| 13925 Mission Oaks Blvd #13714 Seminole, FL | 2.0 | 2.0 | 865 | $2,200 | $2.54 | 25d | 1 | 0.12mi |
| 19451 Gulf Blvd #604 Indian Shores, FL | 1.0 | 1.0 | 725 | $2,000 | $2.76 | 5d | 1 | 0.78mi |
| 19610 Gulf Blvd #101 Indian Shores, FL | 2.0 | 2.0 | 1100 | $3,000 | $2.73 | 25d | 1 | 0.90mi |
| 10215 Regal Dr #4 Largo, FL | 2.0 | 2.0 | 1105 | $2,300 | $2.08 | 5d | 1 | 1.02mi |
| 10350 Imperial Point Dr W #8 Largo, FL | 1.0 | 1.5 | 860 | $1,675 | $1.95 | 25d | 1 | 1.02mi |
| 10350 Imperial Point Dr W #10 Largo, FL | 1.0 | 1.0 | 815 | $1,550 | $1.90 | 3d | 1 | 1.02mi |
| 10351 Regal Dr Largo, FL | 1.0 | 1.0–1.5 | 837 | $1,700 | $2.03 | 20d | 2 | 1.05mi |
| 10216 Regal Dr #201 Largo, FL | 2.0 | 2.0 | 1100 | $2,000 | $1.82 | 15d | 1 | 1.07mi |
HOA detail condo
- Monthly dues
- $855 · $10,260/yr
- Assessments
- None detected in remarks — confirm with the listing agent.
Listing history 32 events
-
2026-06-18days on market $109,900 Active 431 DOM
-
2026-06-17days on market $109,900 Active 430 DOM
-
2026-06-16days on market $109,900 Active 429 DOM
-
2026-06-15days on market $109,900 Active 428 DOM
-
2026-06-13days on market $109,900 Active 426 DOM
-
2026-06-09days on market $109,900 Active 422 DOM
-
2026-06-08days on market $109,900 Active 421 DOM
-
2026-06-07days on market $109,900 Active 420 DOM
-
2026-06-04days on market $109,900 Active 417 DOM
-
2026-06-03days on market $109,900 Active 416 DOM
-
2026-06-01days on market $109,900 Active 414 DOM
-
2026-05-31days on market $109,900 Active 413 DOM
-
2026-04-08historical $2,000
-
2026-03-25price $109,900
-
2026-02-12price $119,900
-
2026-02-02price $149,900
-
2026-01-08price $2,000
-
2026-01-04status Active
-
2026-01-04price $154,900
-
2025-12-31historical
-
2025-10-10$2,200
-
2025-04-09$159,900 Active
-
2023-04-06historical
-
2023-02-25$184,900 Active
-
2016-02-18historical
-
2016-02-03$51,900 Active
-
2005-04-26soldstatus $75,000
-
2005-04-21soldstatus $75,000
-
2005-03-08$75,000
-
1990-05-17soldstatus $45,000
-
1983-11-01soldstatus $41,000
-
1982-01-01soldstatus $45,900
ⓘ Source: listings_history table (triggers on properties + properties_extension) + one-shot
backfill from property_details.listing_events for pre-trigger history.
Tax reassessment forecast FL · Resets to sale price
- Current annual tax
- $1,545 · $129/mo
- Projected year-2 tax
- $1,545 · $129/mo
- Expected delta
- $0/yr ($0/mo · 0.0%)
ⓘ Screening estimate from a state-policy table — verify with the county assessor before closing.
Climate risk First Street
- Flood 1/10 Low FEMA zone X (unshaded) · 0% chance over 30 yrs
- Wildfire 1/10 Low
- Heat 10/10 Extreme 7 d/yr ≥107°F today · 28 d/yr by 30 yrs out
- Wind 10/10 Extreme 99% chance of damaging wind over 30 yrs
- Air quality 3/10 Moderate 2 unhealthy d/yr today · 3 by 30 yrs out
Nearby sold comps map
Loading sold comps map…
Walkable amenities ~0.75 mi
Loading nearby amenities…
Taxation est. · year 1
- Rental income
- $24,651
- − Mortgage interest
- −$6,156
- − Property taxes
- −$1,545
- − Insurance
- −$550
- − Repairs & maintenance
- −$1,972
- − Management
- −$1,972
- − HOA
- −$10,260
- − Depreciation
- −$3,197
- Taxable loss
- −$1,000
- Est. tax savings @ 24.0%
- +$240
- After-tax cash flow
- $445/yr
For passive investors: Depreciation is non-cash, so a rental often shows a tax loss while cash-flowing — sheltering income. Rental losses are passive: they offset passive income freely, and up to $25,000/yr can offset ordinary (W-2) income if you actively participate and your MAGI is under $100k (phasing out to $0 by $150k); unused losses carry forward. On sale, claimed depreciation is recaptured at up to 25%, and gains may owe capital-gains tax (a 1031 exchange can defer both). Figures are a year-1 estimate at your 24.0% rate — not tax advice; consult a CPA.
Schools (NCES district)
- District
- Pinellas
- NCES district ID
- 1201560
- Math proficiency
- 51% ▼ -5.00%
- Reading proficiency
- 51% ▼ -3.00%
- Median HH income
- $46,270
- Composite
- 43.27/100
- National rank
- #3046
- State rank
- #31 of 73 in FL
Livability — Seminole
- Score
- 88/100
- State rank
- #5
- US rank
- #174
Category grades
Schools grade is shown separately in the Schools card above.
Census & demographics
- City population
- 42,315
- Population (ZIP)
- 12,711
Population outlook (Pinellas County) Hauer SSP2
- Today (2025)
- 1,027,532 people
- By 2030
- 1,063,586 · +3.5%
- By 2040
- 1,125,020 · +9.5%
- By 2050
- 1,168,637 · +13.7%
- By 2075
- 1,265,188 · +23.1%
- By 2100
- 1,260,357 · +22.7%
Race, ethnicity, and origin ACS 2023
- Neighborhood character
- Predominantly White (84%)
- Race & ethnicity
- White 84% Hispanic / Latino 7% Two or more races 7% Asian 2% Black 2%
- Hispanic origin (detail)
- Mexican 3%
- Common ancestry
- Romanian 7% Lithuanian 3% Slovak 1%
- Foreign-born
- 9% · Canada, Jamaica
- Languages at home
- 89% English-only · Other Indo-European 4% Russian/Polish/Slavic 3% Spanish 2%
Political lean MEDSL · Pinellas
- 2024 margin
- Lean R (+5.2) · D 46.9% · R 52.1%
- 2008→2024 swing
- -13.5pp toward R · 2008: 8.3pp · 2024: -5.2pp
- All cycles
- 2024: R+5.2 2020: D+0.2 2016: R+1.1 2012: D+5.6 2008: D+8.3
Not yet ingested
- Civics
- —
Market trends
- HPI YoY
- ▼ -455.42%
- Current HPI
- 337.3149
- Rent YoY
- —
- Metro
- —
- State GDP YoY
- ▲ 3.28%
- F500 in state
- 36
Industry mix (Fortune 500 HQ in FL)
| Industry | F500 HQs | Revenue |
|---|---|---|
| Industrial Technology | 2 | $29B |
|
||
| Insurance | 2 | $17B |
|
||
| Retail | 1 | $60B |
|
||
| Technology Distribution | 1 | $58B |
|
||
| Homebuilding | 1 | $35B |
|
||
| Technology Manufacturing | 1 | $35B |
|
||
Price history
-95.6% since first listed20 events — show timeline
- 2026-04-08 Rental Removed $2,000 STELLARMLS
- 2026-03-25 Price Changed $109,900 Stellar MLS as Distributed by MLS Grid
- 2026-02-12 Price Changed $119,900 Stellar MLS as Distributed by MLS Grid
- 2026-02-02 Price Changed $149,900 Stellar MLS as Distributed by MLS Grid
- 2026-01-08 Price Changed $2,000 STELLARMLS
- 2026-01-04 Relisted — Stellar MLS as Distributed by MLS Grid
- 2026-01-04 Price Changed $154,900 Stellar MLS as Distributed by MLS Grid
- 2025-12-31 Listing Removed — Stellar MLS as Distributed by MLS Grid
- 2025-10-10 Listed for Rent $2,200 STELLARMLS
- 2025-04-09 Listed $159,900 Stellar MLS as Distributed by MLS Grid
- 2023-04-06 Listing Removed — Stellar MLS as Distributed by MLS Grid
- 2023-02-25 Listed $184,900 Stellar MLS as Distributed by MLS Grid
- 2016-02-18 Listing Removed — Stellar MLS as Distributed by MLS Grid
- 2016-02-03 Listed $51,900 Stellar MLS as Distributed by MLS Grid
- 2005-04-26 Sold (Public Records) $75,000 Public Records
- 2005-04-21 Sold (MLS) $75,000 Stellar MLS as Distributed by MLS Grid
- 2005-03-08 Listed $75,000 Stellar MLS as Distributed by MLS Grid
- 1990-05-17 Sold (Public Records) $45,000 Public Records
- 1983-11-01 Sold (Public Records) $41,000 Public Records
- 1982-01-01 Sold (Public Records) $45,900 Public Records
Property tax history
+7.0%/yrLatest (2025): $1,545 · -9.2% YoY. Source: county tax records.
Cash-flow waterfall
monthlySold comps — $/sqft
last 12 mo · ≤1 miLoading sold comps…