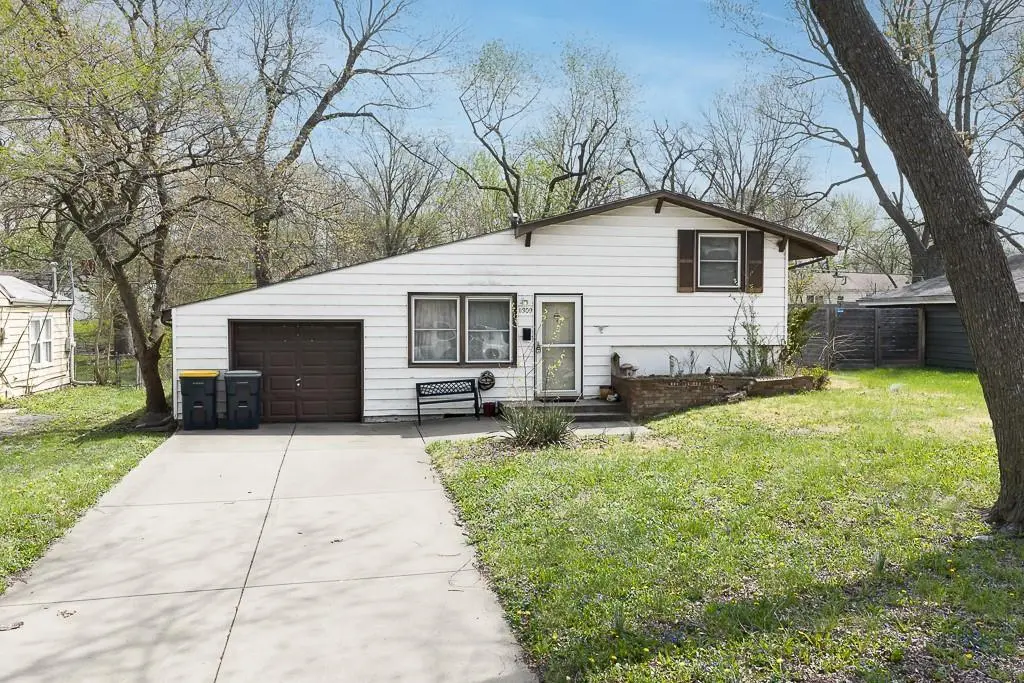
11309 Marsh Ave · Kansas City, MO
Flood risk 1/10 · Minimal
- FEMA flood zone
- X (unshaded)
- Chance of flooding over 30 yrs
- 0.0%
- Est. flood insurance / yr
- $473 – $860
Fire risk 1/10 · Minimal
- Est. fire insurance / yr
- $1,054 – $1,958
Heat risk 3/10 · Minor
- Hot days now (above 107°F)
- 7 days/yr
- Hot days in 30 yrs
- 16 days/yr
Wind risk 2/10 · Minimal
- Chance of severe wind over 30 yrs
- —
Air-quality risk 3/10 · Minor
- Unhealthy air days now
- 3 days/yr
- Unhealthy air days in 30 yrs
- 3 days/yr
Risk factors via First Street. Map © Google.
Why this score? — see what drove the C+ grade
The composite is a weighted blend of 9 inputs, each scored 0–100. Each bar is that input's sub-score; the figure is the points it added to the 100-point composite (weight × sub-score).
- Cash flow +26.1/30.0
- DSCR +8.8/10.0
- ARV discount +8.2/15.0
- 1% rule +6.3/10.0
- Rent growth +4.2/5.0
- Livability +3.9/5.0
- Condition / age +2.5/5.0
- Schools +1.1/10.0
- Appreciation +0.0/10.0
$139,950
🖨 Deal sheet (PDF) 📄 Offer letter ✓ Due diligence
Listing remarks MLS
AFFORDABLE OPPORTUNITY WITH GREAT POTENTIAL IN A CONVENIENT LOCATION! This 3 bedroom, 2 full bath side-to-side split entry home with a 1 car garage is perfect for buyers looking to build equity and make it their own. The layout offers comfortable living space with room to update and add value, making it an ideal option for first-time buyers or investors. Step outside to a fenced backyard that’s great for pets, play, or outdoor gatherings. With a little TLC, this home could truly shine. Located in a great area close to shopping, dining, and everyday amenities, this is a chance you don’t want to miss!
Key facts
- 8,468 sq ft lot
- Garage
- Built 1958
Neighborhood map
What this means for you Summary
Snapshot
- This is a 3-bed/1.0-bath single-family listed at $140k.
Deal economics
- At list price, monthly cash flow is $354 ($4k/yr) — positive.
- The deal already cash-flows at list — no discount required.
- Meets the 1% rule at list price ($2k rent vs $140k).
- Cap rate 9.3% vs local median 3.9% in Kansas City — top-decile yield for the area; either an underpriced asset or a hidden risk that comps aren't pricing in. Stress-test before assuming the spread holds.
Location & tenants
- Location reads 78/100 on livability (#28 in MO, #2,671 nationally) — a middle-class / working-renter tenant base. Strengths: amenities A+, commute A+, cost of living A+; Watch: crime F.
- Hickman Mills C-1 (urban): math 8% / reading 18% proficiency, ranked #314 of 324 in MO (top 97%) — low school quality limits family demand, transient renter base, plan for 1-2y turnover; 78% free/reduced lunch — lower-income household profile, screen leases tightly.
- Zoned schools: Ervin Elementary School (math 8% / reading 12%, grade F, #1,037 of 1,115 statewide, top 94%, 629 students, 100% FRL); Smith-Hale Middle (math 7% / reading 19%, grade F, #368 of 391 statewide, top 94%, 770 students, 100% FRL); Ruskin High School (math 8% / reading 47%, grade F, #416 of 521 statewide, top 80%, 1,273 students, 100% FRL) — zoned schools average 100% FRL vs 78% district-wide (22 pts higher); higher-poverty schools than district average — tighter screening recommended.
- Market conditions: Rents rising fast (+6.7%/yr); 147 active listings in the ZIP; 40 comparable units currently listed for rent nearby; rentals at typical pace (median 22d on market — plan ~3-4 weeks tenant-placement turnaround); 4,002 units permitted in Jackson County in 2024 (2,271 in 5+ unit buildings).
- This rent runs 33% of the median local income ($58k/yr) — at the standard rent-burdened threshold; future hikes will face affordability resistance.
Forward outlook
- Local home prices are declining (-3.0%/yr); year-one equity from $968 of loan paydown is wiped out by about $4k of value loss. Plan a longer hold.
- Jackson County population projected at +4% by 2050 — modest demand growth; plan on rents tracking national, not racing it.
- At projected returns (-3.0% appreciation + 6.7% rent growth), your $39k cash investment doubles in ~8 years — after that, you're playing with house money.
Negotiation context
- Only 9 days on market — expect competitive offers; lowballing is unlikely to land.
Risks & watch-outs
- Watch-outs: built in 1958 — expect roof / HVAC / electrical / plumbing capex.
Questions for the listing agent
- Built in 1958 — when were the roof, HVAC, electrical panel, plumbing, and water heater last replaced?
- What does the HOA fee cover, when was the last increase, and are there any pending special assessments or reserve-fund shortfalls?
- Is there a deadline driving the sale (1031 exchange, divorce, estate, relocation)? That informs how much negotiation room exists.
- Crime grade is F in this area — have there been break-ins, vandalism, or insurance claims at this property in the last 3 years? What carrier currently insures it and at what premium?
- What's the average days-on-market for RENTAL listings here right now (not sales)? A rising rental-DOM trend means longer vacancies and softer asking-rent achievability than the comps imply.
- What's the recent tenant-quality profile in this submarket — average credit score on applications, eviction rate, late-payment / NSF rate, and stable-employment percentage? A property-management company in the area should have these aggregated.
- How much new for-sale + rental construction is in the pipeline within 1–3 miles? Heavy new supply typically softens prices + rents 12–24 months out; constrained supply supports both.
Investment metrics
- 1% rule
- 1.13% ✓
- Cap rate
- 9.33%
- Cash-on-cash
- 10.83%
- DSCR
- 1.48
- GRM
- 7.4
CMA / ARV
- ARV (median comp)
- $142,203
- List price
- $139,950
- Delta
- -1.58%
- Verdict
- FAIR
- Comps
- 20 within 1.0 mi
Show comp detail 12 sales within ~0.75 mi
| Address | Dist | Beds/Ba | Sqft | Sold | Price | $/sf | Match |
|---|---|---|---|---|---|---|---|
| 11309 Marsh Ave | 0.00mi | 3/2.0 | 1,016 (0%) | 1mo | $139,950 | $138 | 95 |
| 8601 E 114th Ter | 0.22mi | 3/1.0 | 1,036 (+2%) | 0mo | $144,500 | $139 | 86 |
| 11318 Marsh St | 0.06mi | 3/1.0 | 912 (-10%) | 0mo | $125,000 | $137 | 80 |
| 11346 Sycamore Ter | 0.16mi | 3/1.0 | 912 (-10%) | 0mo | $139,900 | $153 | 75 |
| 8201 E 110th St | 0.43mi | 3/1.0 | 960 (-6%) | 1mo | $153,700 | $160 | 70 |
| 8300 E 110th St | 0.46mi | 3/1.0 | 1,062 (+4%) | 2mo | $174,950 | $165 | 69 |
| 11017 Booth Ave | 0.44mi | 3/1.5 | 912 (-10%) | 2mo | $95,000 | $104 | 59 |
| 11504 Manchester Ave | 0.42mi | 3/2.0 | 1,126 (+11%) | 1mo | $174,900 | $155 | 57 |
| 8303 E 110th Ter | 0.36mi | 4/2.0 (+1) | 1,119 (+10%) | 2mo | $190,000 | $170 | 55 |
| 11220 Corrington Ave | 0.58mi | 3/1.0 | 912 (-10%) | 2mo | $150,000 | $164 | 54 |
| 7119 E 111th Ter | 0.66mi | 3/1.0 | 912 (-10%) | 2mo | $160,000 | $175 | 50 |
| 7905 E 112th St | 0.58mi | 3/1.0 | 864 (-15%) | 2mo | $120,000 | $139 | 47 |
Match score weights: distance 35% · size 25% · config 20% · recency 20%. Top-matched comps best support the ARV.
Projected returns pro-forma
-3.0% appreciation · 6.73% rent growth · sell at horizon
- IRR
- 3.8%
- Equity multiple
- 1.15×
- Total profit
- $5,985
- Equity at exit
- $20,867
- IRR
- 16.4%
- Equity multiple
- 2.57×
- Total profit
- $61,424
- Equity at exit
- $12,100
Cash invested: $39,186 (down + closing). Projections, not guarantees.
Landlord ↔ Tenant lean methodology
- Overall (STATE)
- 81 Strongly Landlord-Friendly
- State Missouri
- 81 Strongly Landlord-Friendly · R+10
- County
- — inherits STATE
- City
- — inherits STATE
ZIP-level market 64134
- Rents YoY
- 6.7%
- Active inventory
- 147
- Price-to-rent
- 7.4×
Monthly cashflow live
- Estimated rent
- $1,582 high interval (Pro) →
- Mortgage (P&I)
- −$734
- Tax from tax record
- −$101 /mo · $1,208/yr
- Insurance
- −$58
- HOA
- −$3
- Vacancy / Maint / Mgmt
- −$332
- Net cashflow
- $354
Break-even live
Sensitivity live
| Price | -10% $433 | -5% $393 | +0% $354 | +5% $314 | +10% $274 |
|---|---|---|---|---|---|
| Rent | -10% $229 | -5% $291 | +0% $354 | +5% $416 | +10% $479 |
| Rate | -1.0pp $424 | -0.5pp $389 | base $354 | +0.5pp $317 | +1.0pp $280 |
UW: 25.0% down · 7.5% · 30yr · 1.5% tax · 5.0% vac · 8.0% maint · 8.0% mgmt
Financing live
Cash to close
- Down payment
- $34,988
- Closing costs
- $4,198
- Reserves months
- —
- Total cash needed
- —
Loan-product check · same deal, 3 products live
Conventional
25% down · 7.5% · 30yr
- Down + closing
- —
- Monthly P&I
- —
- Monthly cashflow
- —
- DSCR
- —
- Eligible?
- —
Personal DTI + credit; lowest rate.
DSCR
20% down · 8.5% · 30yr
- Down + closing
- —
- Monthly P&I
- —
- Monthly cashflow
- —
- DSCR
- —
- Eligible?
- —
No personal income docs; deal must DSCR.
Hard money
10% down · 12.0% · 12mo
- Down + closing
- —
- Monthly P&I
- —
- Monthly cashflow
- —
- DSCR
- —
- Eligible?
- —
Short-term bridge; refi at stabilization.
Rent comps 40 comps
| Address | Beds | Baths | Sqft | Rent | $/sqft | DOM | Units | Dist |
|---|---|---|---|---|---|---|---|---|
| 11316 Donnelly Ave Kansas City, MO | 3.0 | 1.0 | 1000 | $1,475 | $1.48 | 45d | 1 | 0.06mi |
| 11208 Marsh Ave Kansas City, MO | 3.0 | 1.0 | 912 | $1,395 | $1.53 | 4d | 1 | 0.11mi |
| 8410 Ruskin Way Kansas City, MO | 4.0 | 1.0 | 1176 | $1,850 | $1.57 | 17d | 1 | 0.14mi |
| 11354 Sycamore Ter Kansas City, MO | 4.0 | 1.0 | 1176 | $1,850 | $1.57 | 3d | 1 | 0.15mi |
| 11210 Manchester Ave Kansas City, MO | 4.0 | 1.0 | 1200 | $1,395 | $1.16 | 25d | 1 | 0.21mi |
| 11406 Sycamore Ter Kansas City, MO | 3.0 | 1.0 | 912 | $1,450 | $1.59 | 17d | 1 | 0.22mi |
| 8310 E 111th Ter Kansas City, MO | 3.0 | 1.0 | 912 | $950 | $1.04 | 17d | 1 | 0.24mi |
| 11316 Lewis Ave Unit 1 Kansas City, MO | 4.0 | 2.0 | 1176 | $1,850 | $1.57 | 3d | 1 | 0.25mi |
| 11308 McKinley Ave Kansas City, MO | 3.0 | 1.0 | 1272 | $1,345 | $1.06 | 25d | 1 | 0.30mi |
| 8517 E 110th Ter Kansas City, MO | 3.0 | 2.0 | 1095 | $1,450 | $1.32 | 45d | 1 | 0.31mi |
| 7801 E 113th St Kansas City, MO | 3.0 | 1.0 | 1341 | $1,450 | $1.08 | 17d | 1 | 0.34mi |
| 11410 Palmer Ave Kansas City, MO | 4.0 | 2.0 | 936 | $1,300 | $1.39 | 45d | 1 | 0.36mi |
| 11421 Manchester Ave Kansas City, MO | 4.0 | 1.0 | 1176 | $1,550 | $1.32 | 5d | 1 | 0.37mi |
| 8304 E 110 Ter Kansas City, MO | 3.0 | 1.0 | 912 | $1,450 | $1.59 | 45d | 1 | 0.37mi |
| 7610 E 113th St Kansas City, MO | 4.0 | 2.0 | 1176 | $1,700 | $1.45 | 45d | 1 | 0.41mi |
| 8600 E 110th St Kansas City, MO | 4.0 | 2.0 | 1290 | $1,602 | $1.24 | 17d | 1 | 0.46mi |
| 11513 Richmond Ave Kansas City, MO | 3.0 | 1.5 | 1114 | $1,450 | $1.30 | 16d | 1 | 0.51mi |
| 11206 Corrington Ave Kansas City, MO | 4.0 | 1.5 | 1176 | $1,595 | $1.36 | 25d | 1 | 0.53mi |
| 11116 Bristol Ter Kansas City, MO | 3.0 | 1.0 | 956 | $1,390 | $1.45 | 25d | 1 | 0.53mi |
| 7800 E 112th St Kansas City, MO | 3.0 | 1.0 | 900 | $1,600 | $1.78 | 25d | 1 | 0.55mi |
| 7405 E 112th St Kansas City, MO | 4.0 | 1.0 | 936 | $1,850 | $1.98 | 45d | 1 | 0.55mi |
| 7605 E 111th Ter Kansas City, MO | 3.0 | 1.0 | 1176 | $1,050 | $0.89 | 3d | 1 | 0.56mi |
| 7305 E 111th Ter Kansas City, MO | 4.0 | 1.0 | 1100 | $1,345 | $1.22 | 16d | 1 | 0.61mi |
| 7415 E 110th St Kansas City, MO | 3.0 | 1.0 | 1176 | $1,385 | $1.18 | 3d | 1 | 0.62mi |
| 8622 E 108th Ter Kansas City, MO | 3.0 | 1.0 | 993 | $1,995 | $2.01 | 5d | 1 | 0.65mi |
| 7119 E 111th Ter Kansas City, MO | 3.0 | 1.0 | 912 | $1,349 | $1.48 | 45d | 1 | 0.66mi |
| 7114 E 112th St Kansas City, MO | 4.0 | 1.0 | 936 | $1,850 | $1.98 | 25d | 1 | 0.68mi |
| 8006 E 118th Ter Kansas City, MO | 3.0 | 1.5 | 1132 | $1,450 | $1.28 | 21d | 1 | 0.70mi |
| 10719 Bristol Ter Kansas City, MO | 3.0 | 2.0 | 1096 | $1,456 | $1.33 | 25d | 1 | 0.71mi |
| 7104 Longview Rd Kansas City, MO | 3.0 | 1.0 | 912 | $1,275 | $1.40 | 16d | 1 | 0.72mi |
| 11407 Winchester Ave Kansas City, MO | 3.0 | 1.0 | 936 | $1,360 | $1.45 | 4d | 1 | 0.77mi |
| 6905 E 112th St Kansas City, MO | 3.0 | 1.0 | 972 | $1,550 | $1.59 | 45d | 1 | 0.78mi |
| 11127 Blue Ridge Blvd Kansas City, MO | 3.0 | 1.0 | 1000 | $1,599 | $1.60 | 45d | 1 | 0.80mi |
| 6904 Longview Rd Kansas City, MO | 4.0 | 1.0 | 900 | $1,850 | $2.06 | 3d | 1 | 0.85mi |
| 11923 Manchester Ave Grandview, MO | 3.0 | 2.0 | 1407 | $1,815 | $1.29 | 45d | 1 | 0.87mi |
| 11934 Sycamore Ave Grandview, MO | 3.0 | 2.0 | 1414 | $1,806 | $1.28 | 45d | 1 | 0.91mi |
| 11009 Ewing Ave Kansas City, MO | 4.0 | 1.0 | 1416 | $1,595 | $1.13 | 45d | 1 | 0.98mi |
| 11803 Holiday Dr #5 Kansas City, MO | 1.0–3.0 | 1.0 | 1016 | $1,130 | $1.11 | 3d | 1 | 0.99mi |
| 10607 Richmond Ave Kansas City, MO | 3.0 | 1.0 | 912 | $1,499 | $1.64 | 17d | 1 | 1.00mi |
| 10919 Ewing Ave Kansas City, MO | 3.0 | 1.0 | 840 | $1,850 | $2.20 | 5d | 1 | 1.00mi |
HOA detail
- Monthly dues
- $3 · $36/yr
Listing history 5 events
-
2026-05-10status Pending 618-char remark
Show marketing remark (618 chars)
AFFORDABLE OPPORTUNITY WITH GREAT POTENTIAL IN A CONVENIENT LOCATION! This 3 bedroom, 2 full bath side-to-side split entry home with a 1 car garage is perfect for buyers looking to build equity and make it their own. The layout offers comfortable living space with room to update and add value, making it an ideal option for first-time buyers or investors. Step outside to a fenced backyard that’s great for pets, play, or outdoor gatherings. With a little TLC, this home could truly shine. Located in a great area close to shopping, dining, and everyday amenities, this is a chance you don’t want to miss!
-
2026-05-10price $139,950 618-char remark
Show marketing remark (618 chars)
AFFORDABLE OPPORTUNITY WITH GREAT POTENTIAL IN A CONVENIENT LOCATION! This 3 bedroom, 2 full bath side-to-side split entry home with a 1 car garage is perfect for buyers looking to build equity and make it their own. The layout offers comfortable living space with room to update and add value, making it an ideal option for first-time buyers or investors. Step outside to a fenced backyard that’s great for pets, play, or outdoor gatherings. With a little TLC, this home could truly shine. Located in a great area close to shopping, dining, and everyday amenities, this is a chance you don’t want to miss!
-
2026-05-01$149,950 Active 618-char remark
Show marketing remark (618 chars)
AFFORDABLE OPPORTUNITY WITH GREAT POTENTIAL IN A CONVENIENT LOCATION! This 3 bedroom, 2 full bath side-to-side split entry home with a 1 car garage is perfect for buyers looking to build equity and make it their own. The layout offers comfortable living space with room to update and add value, making it an ideal option for first-time buyers or investors. Step outside to a fenced backyard that’s great for pets, play, or outdoor gatherings. With a little TLC, this home could truly shine. Located in a great area close to shopping, dining, and everyday amenities, this is a chance you don’t want to miss!
-
2026-04-07historical $149,950 618-char remark
Show marketing remark (618 chars)
AFFORDABLE OPPORTUNITY WITH GREAT POTENTIAL IN A CONVENIENT LOCATION! This 3 bedroom, 2 full bath side-to-side split entry home with a 1 car garage is perfect for buyers looking to build equity and make it their own. The layout offers comfortable living space with room to update and add value, making it an ideal option for first-time buyers or investors. Step outside to a fenced backyard that’s great for pets, play, or outdoor gatherings. With a little TLC, this home could truly shine. Located in a great area close to shopping, dining, and everyday amenities, this is a chance you don’t want to miss!
-
1996-04-30soldstatus
ⓘ Source: listings_history table (triggers on properties + properties_extension) + one-shot
backfill from property_details.listing_events for pre-trigger history.
Tax reassessment forecast MO · Resets to sale price
- Current annual tax
- $1,208 · $101/mo
- Projected year-2 tax
- $1,358 · $113/mo
- Expected delta
- +$150/yr (+$12/mo · 12.4%)
ⓘ Screening estimate from a state-policy table — verify with the county assessor before closing.
Climate risk First Street
- Flood 1/10 Low FEMA zone X (unshaded) · 0% chance over 30 yrs
- Wildfire 1/10 Low
- Heat 3/10 Moderate 7 d/yr ≥107°F today · 16 d/yr by 30 yrs out
- Wind 2/10 Low
- Air quality 3/10 Moderate 3 unhealthy d/yr today · 3 by 30 yrs out
Nearby sold comps map
Loading sold comps map…
Walkable amenities ~0.75 mi
Loading nearby amenities…
Taxation est. · year 1
- Rental income
- $18,980
- − Mortgage interest
- −$7,839
- − Property taxes
- −$1,208
- − Insurance
- −$700
- − Repairs & maintenance
- −$1,518
- − Management
- −$1,518
- − HOA
- −$36
- − Depreciation
- −$4,071
- Taxable income
- $2,089
- Est. tax owed @ 24.0%
- −$501
- After-tax cash flow
- $3,742/yr
For passive investors: Depreciation is non-cash, so a rental often shows a tax loss while cash-flowing — sheltering income. Rental losses are passive: they offset passive income freely, and up to $25,000/yr can offset ordinary (W-2) income if you actively participate and your MAGI is under $100k (phasing out to $0 by $150k); unused losses carry forward. On sale, claimed depreciation is recaptured at up to 25%, and gains may owe capital-gains tax (a 1031 exchange can defer both). Figures are a year-1 estimate at your 24.0% rate — not tax advice; consult a CPA.
Schools (NCES district)
- District
- Hickman Mills C-1
- NCES district ID
- 2914340
- Math proficiency
- 8% ▼ -8.00%
- Reading proficiency
- 18% ▼ -4.00%
- Median HH income
- $40,908
- Composite
- 11.2/100
- National rank
- #9725
- State rank
- #314 of 324 in MO
Livability — Kansas City
- Score
- 78/100
- State rank
- #28
- US rank
- #2671
Category grades
Schools grade is shown separately in the Schools card above.
Census & demographics
- Census place
- Kansas City, MO
- County
- Jackson County · 687,798 people
- City population
- 439,467
- Metro
- Kansas City, MO-KS
- Population (ZIP)
- 22,964
- Household income
- $58,170
- Rent vs Own
- Severe rent burden
- 718.0
Population outlook (Jackson County) Hauer SSP2
- Today (2025)
- 719,589 people
- By 2030
- 731,456 · +1.6%
- By 2040
- 746,689 · +3.8%
- By 2050
- 749,289 · +4.1%
- By 2075
- 736,227 · +2.3%
- By 2100
- 668,210 · -7.1%
Race, ethnicity, and origin ACS 2023
- Neighborhood character
- Diverse neighborhood (Simpson 0.58)
- Race & ethnicity
- Black 58% White 28% Hispanic / Latino 10% Two or more races 6%
- Hispanic origin (detail)
- Mexican 6%
- Common ancestry
- Italian 2% Lithuanian 1% Romanian 1%
- Foreign-born
- 4% · Canada
- Languages at home
- 93% English-only · Spanish 5% Arabic 1%
Political lean MEDSL · Jackson
- 2024 margin
- D (+19.3) · D 58.9% · R 39.5% · Other 1.6%
- 2008→2024 swing
- -6.1pp toward R · 2008: 25.4pp · 2024: 19.3pp
- All cycles
- 2024: D+19.3 2020: D+22.0 2016: D+16.6 2012: D+19.0 2008: D+25.4
Not yet ingested
- Civics
- —
Market trends
- HPI YoY
- ▼ -157.94%
- Current HPI
- 277.895
- Rent YoY
- ▲ 6.73%
- Metro
- Kansas City, MO-KS
- State GDP YoY
- ▲ 1.84%
- F500 in state
- 20
Industry mix (Fortune 500 HQ in MO)
| Industry | F500 HQs | Revenue |
|---|---|---|
| Healthcare | 1 | $163B |
|
||
| Insurance | 1 | $21B |
|
||
| Industrial Technology | 1 | $17B |
|
||
| Retail | 1 | $16B |
|
||
| Industrial Distribution | 1 | $10B |
|
||
| Utilities | 1 | $9B |
|
||
Price history
-6.7% since first listed5 events — show timeline
- 2026-05-10 Pending — Heartland MLS as Distributed by MLS Grid
- 2026-05-10 Price Changed $139,950 Heartland MLS as Distributed by MLS Grid
- 2026-05-01 Listed $149,950 Heartland MLS as Distributed by MLS Grid
- 2026-04-07 Coming Soon $149,950 Heartland MLS as Distributed by MLS Grid
- 1996-04-30 Sold (Public Records) — Public Records
Property tax history
+9.4%/yrLatest (2025): $1,208 · +4.1% YoY. Source: county tax records.
Cash-flow waterfall
monthlySold comps — $/sqft
last 12 mo · ≤1 miLoading sold comps…