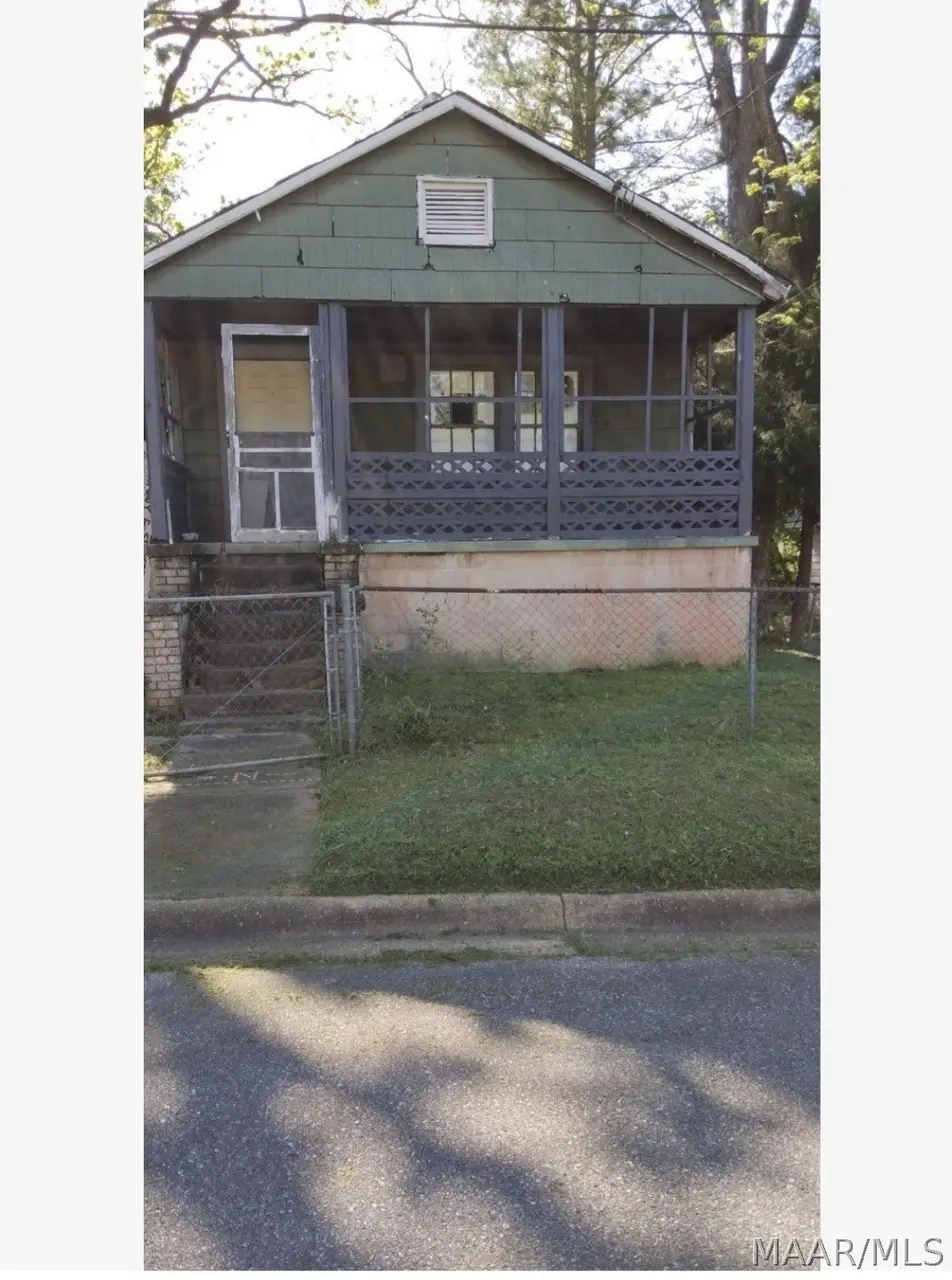
1320 Maple St · Montgomery, AL
Flood risk 1/10 · Minimal
- FEMA flood zone
- X (unshaded)
- Chance of flooding over 30 yrs
- 0.0%
- Est. flood insurance / yr
- $507 – $1,088
Fire risk 1/10 · Minimal
- Est. fire insurance / yr
- $916 – $1,700
Heat risk 7/10 · Major
- Hot days now (above 107°F)
- 7 days/yr
- Hot days in 30 yrs
- 19 days/yr
Wind risk 8/10 · Major
- Chance of severe wind over 30 yrs
- 80.0%
Air-quality risk 3/10 · Minor
- Unhealthy air days now
- 4 days/yr
- Unhealthy air days in 30 yrs
- 4 days/yr
Risk factors via First Street. Map © Google.
Why this score? — see what drove the D+ grade
The composite is a weighted blend of 9 inputs, each scored 0–100. Each bar is that input's sub-score; the figure is the points it added to the 100-point composite (weight × sub-score).
- Cash flow +15.0/30.0
- ARV discount +7.5/15.0
- Appreciation +6.4/10.0
- 1% rule +5.0/10.0
- DSCR +5.0/10.0
- Livability +3.2/5.0
- Rent growth +2.5/5.0
- Condition / age +2.5/5.0
- Schools +1.7/10.0
$10,000
🖨 Deal sheet (PDF) 📄 Offer letter ✓ Due diligence
Listing remarks MLS
Sold as is, but has great potential. Located on a quiet street where the neighbors take pride in their property. Previously served as rental property. Owner has no knowledge of condition of systems. No Warranties implied or expressed .
Key facts
- 4,791 sq ft lot
- Parking
- Built 1950
Property features AI
Exterior
- Parking: Driveway with one parking pad
- Utilities: Public sewer; Community/Co-op water; Utilities: Unknown
- Home design: Single-story house; HardiPlank exterior
- Construction: HardiPlank-type siding
- Exterior features: Front porch
Interior
- Flooring: Wood
- Bathrooms: 1 full bathroom
- Interior features: Wood flooring; Porch (listed under exterior features but provides indoor/outdoor transition)
- Laundry & utility: Water heater
Neighborhood map
What this means for you Summary
Snapshot
- This is a 2-bed/1.0-bath single-family listed at $10k.
Deal economics
- At list price, monthly cash flow is $694 ($8k/yr) — positive.
- The deal already cash-flows at list — no discount required.
- Meets the 1% rule at list price ($956 rent vs $10k).
- Recommended offer: $10k (1.5% below list) — sets the bar for market timing.
Location & tenants
- Location reads 65/100 on livability (#138 in AL) — a middle-class / working-renter tenant base. Strengths: cost of living A+, housing A+; Watch: employment D, crime F, amenities D-.
- Montgomery County (urban): math 9% / reading 31% proficiency, ranked #106 of 129 in AL (top 82%) — low school quality limits family demand, transient renter base, plan for 1-2y turnover; 70% free/reduced lunch — lower-income household profile, screen leases tightly.
- Zoned schools: Nixon Elementary School (math 2% / reading 8%, grade F, #618 of 627 statewide, top 100%, 441 students, 97% FRL, charter); Bellingrath Middle School (math 0% / reading 12%, grade F, #252 of 257 statewide, top 98%, 607 students, 96% FRL, charter); Carver Senior High School (math 2% / reading 12%, grade F, #265 of 305 statewide, top 89%, 902 students, 89% FRL) — zoned schools average 94% FRL vs 70% district-wide (24 pts higher); higher-poverty schools than district average — tighter screening recommended.
- Zoned-school proficiency averages 6% at this address vs 20% district-wide (-14 pts) — the specific schools serving this property underperform the Montgomery County average; the district grade overstates school quality for this exact location.
- Market conditions: 65 active listings in the ZIP; 16 comparable units currently listed for rent nearby; rentals at typical pace (median 23d on market — plan ~3-4 weeks tenant-placement turnaround); 44% of comp listings sitting > 30 days — soft ceiling on asking rent; 460 units permitted in Montgomery County in 2024 (37 in 5+ unit buildings).
Forward outlook
- In year one you build about $340 of equity ($69 loan paydown + $271 appreciation (2.7% local appreciation)).
- Montgomery County population projected to shrink 8% by 2050 — rents likely to lag national; underwrite the cash flow, not the appreciation.
- At projected returns (2.7% appreciation + 3.0% rent growth), your $3k cash investment doubles in ~1 year — after that, you're playing with house money.
Negotiation context
- It's been on market 23 days — a 2% lower offer ($10k) is reasonable based on typical stale-listing flexibility.
- 3 sale attempts since 21y ago; this cycle's ask has dropped $6k (37%) from the opening price — seller is motivated, your offer sets the floor, not the list.
- Current owner paid $8k; 33% above their basis — modest negotiation headroom, anchor on the comps not their cost.
Risks & watch-outs
- Watch-outs: built in 1950 — expect roof / HVAC / electrical / plumbing capex.
- Climate carrying-cost: severe wind risk, 80% chance of damaging wind over 30y; extreme-heat days projected 7→19/yr by 2055 (HVAC capex compounding) — expect insurance premiums to compound above CPI over the hold.
Questions for the listing agent
- Built in 1950 — when were the roof, HVAC, electrical panel, plumbing, and water heater last replaced?
- Is there a deadline driving the sale (1031 exchange, divorce, estate, relocation)? That informs how much negotiation room exists.
- Crime grade is F in this area — have there been break-ins, vandalism, or insurance claims at this property in the last 3 years? What carrier currently insures it and at what premium?
- The area grade is low — what's the realistic commute time and amenity access for the typical tenant pool here? Any planned neighborhood developments (good or bad) we should know about?
- What's the average days-on-market for RENTAL listings here right now (not sales)? A rising rental-DOM trend means longer vacancies and softer asking-rent achievability than the comps imply.
- What's the recent tenant-quality profile in this submarket — average credit score on applications, eviction rate, late-payment / NSF rate, and stable-employment percentage? A property-management company in the area should have these aggregated.
- How much new for-sale + rental construction is in the pipeline within 1–3 miles? Heavy new supply typically softens prices + rents 12–24 months out; constrained supply supports both.
Investment metrics
- 1% rule
- 9.56% ✓
- Cap rate
- 89.55%
- Cash-on-cash
- 297.34%
- DSCR
- 14.23
- GRM
- 0.9
CMA / ARV
- ARV (on-the-fly)
- $32,683
- Comps found
- 8
Show comp detail 8 sales within ~0.75 mi
| Address | Dist | Beds/Ba | Sqft | Sold | Price | $/sf | Match |
|---|---|---|---|---|---|---|---|
| 2128 Early St | 0.03mi | 2/1.0 | 1,119 (-1%) | 10mo | $30,000 | $27 | 89 |
| 2112 Stella St | 0.16mi | 2/1.0 | 1,061 (-6%) | 18mo | $20,000 | $19 | 67 |
| 1555 Sierra St | 0.33mi | 3/1.0 (+1) | 1,151 (+2%) | 21mo | $42,700 | $37 | 58 |
| 1402 Bragg St | 0.29mi | 3/1.0 (+1) | 1,232 (+9%) | 18mo | $52,000 | $42 | 51 |
| 1374 Bragg St | 0.29mi | 3/1.0 (+1) | 988 (-12%) | 13mo | $12,000 | $12 | 50 |
| 840 Hill St | 0.46mi | 3/1.0 (+1) | 1,188 (+5%) | 21mo | $35,000 | $29 | 47 |
| 317 Georgia St | 0.74mi | 2/1.0 | 1,232 (+9%) | 4mo | $16,000 | $13 | 47 |
| 812 Alma Dr | 0.65mi | 3/1.5 (+1) | 1,040 (-8%) | 17mo | $70,000 | $67 | 36 |
Match score weights: distance 35% · size 25% · config 20% · recency 20%. Top-matched comps best support the ARV.
Projected returns pro-forma
2.71% appreciation · 3.0% rent growth · sell at horizon
- IRR
- —
- Equity multiple
- 17.16×
- Total profit
- $45,249
- Equity at exit
- $4,332
- IRR
- —
- Equity multiple
- 36.49×
- Total profit
- $99,362
- Equity at exit
- $6,551
Cash invested: $2,800 (down + closing). Projections, not guarantees.
Landlord ↔ Tenant lean methodology
- Overall (STATE)
- 90 Strongly Landlord-Friendly
- State Alabama
- 90 Strongly Landlord-Friendly · R+15
- County
- — inherits STATE
- City
- — inherits STATE
ZIP-level market 36108
- Home prices YoY
- 2.9%
- Active inventory
- 65
- Price-to-rent
- 0.9×
Monthly cashflow live
- Estimated rent
- $956 high interval (Pro) →
- Mortgage (P&I)
- −$52
- Tax from tax record
- −$5 /mo · $61/yr
- Insurance
- −$4
- HOA
- −$0
- Vacancy / Maint / Mgmt
- −$201
- Net cashflow
- $694
Break-even live
Sensitivity live
| Price | -10% $699 | -5% $697 | +0% $694 | +5% $691 | +10% $688 |
|---|---|---|---|---|---|
| Rent | -10% $618 | -5% $656 | +0% $694 | +5% $732 | +10% $769 |
| Rate | -1.0pp $699 | -0.5pp $696 | base $694 | +0.5pp $691 | +1.0pp $689 |
UW: 25.0% down · 7.5% · 30yr · 1.5% tax · 5.0% vac · 8.0% maint · 8.0% mgmt
Financing live
Cash to close
- Down payment
- $2,500
- Closing costs
- $300
- Reserves months
- —
- Total cash needed
- —
Loan-product check · same deal, 3 products live
Conventional
25% down · 7.5% · 30yr
- Down + closing
- —
- Monthly P&I
- —
- Monthly cashflow
- —
- DSCR
- —
- Eligible?
- —
Personal DTI + credit; lowest rate.
DSCR
20% down · 8.5% · 30yr
- Down + closing
- —
- Monthly P&I
- —
- Monthly cashflow
- —
- DSCR
- —
- Eligible?
- —
No personal income docs; deal must DSCR.
Hard money
10% down · 12.0% · 12mo
- Down + closing
- —
- Monthly P&I
- —
- Monthly cashflow
- —
- DSCR
- —
- Eligible?
- —
Short-term bridge; refi at stabilization.
Rent comps 16 comps
| Address | Beds | Baths | Sqft | Rent | $/sqft | DOM | Units | Dist |
|---|---|---|---|---|---|---|---|---|
| 3225 McElvy St Montgomery, AL | 3.0 | 2.0 | 1258 | $1,350 | $1.07 | 15d | 1 | 0.75mi |
| 2654 Rutland St Montgomery, AL | 3.0 | 1.0 | 1176 | $1,075 | $0.91 | 23d | 1 | 0.89mi |
| 3220 Doris Cir Montgomery, AL | 3.0 | 1.0 | 1139 | $1,100 | $0.97 | 46d | 1 | 0.93mi |
| 24 Flood St Montgomery, AL | 2.0 | 1.0 | 1140 | $1,000 | $0.88 | 23d | 1 | 1.09mi |
| 718 W Edgemont Ave Unit B Montgomery, AL | 2.0 | 1.0 | 875 | $800 | $0.91 | 23d | 1 | 1.12mi |
| 718 W Edgemont Ave Unit A Montgomery, AL | 3.0 | 1.0 | 875 | $875 | $1.00 | 46d | 1 | 1.12mi |
| 1301 S Perry St Unit A Montgomery, AL | 2.0 | 1.0 | 1100 | $950 | $0.86 | 15d | 1 | 1.26mi |
| 545 Clay St Montgomery, AL | 2.0 | 2.0 | 1104 | $1,050 | $0.95 | 46d | 1 | 1.32mi |
| 3577 Whiting Ave Montgomery, AL | 3.0 | 1.0 | 1269 | $1,150 | $0.91 | 46d | 1 | 1.35mi |
| 605 Maxwell Blvd Montgomery, AL | 1.0–2.0 | 1.0–2.0 | 971 | $1,943 | $2.00 | 15d | 11 | 1.37mi |
| 105 Arlington Rd Unit B Montgomery, AL | 2.0 | 1.0 | 1100 | $925 | $0.84 | 46d | 1 | 1.38mi |
| 671 S Perry St Montgomery, AL | 2.0 | 1.0–2.0 | 525 | $1,725 | $3.29 | 23d | 1 | 1.41mi |
| 1314 S Hull St Unit 1316B Montgomery, AL | 1.0 | 1.0 | 866 | $700 | $0.81 | 46d | 1 | 1.45mi |
| 1316 S Hull St Unit B Montgomery, AL | 1.0 | 1.0 | 866 | $700 | $0.81 | 46d | 1 | 1.45mi |
| 23 Elcar Cir Montgomery, AL | 2.0 | 1.0 | 720 | $395 | $0.55 | 23d | 1 | 1.47mi |
| 57 Polaris Dr Montgomery, AL | 3.0 | 1.0 | 840 | $395 | $0.47 | 23d | 1 | 1.48mi |
Listing history 18 events
-
2026-06-21days on market $10,000 Active 23 DOM
-
2026-06-18days on market $10,000 Active 20 DOM
-
2026-06-17days on market $10,000 Active 19 DOM
-
2026-06-16days on market $10,000 Active 18 DOM
-
2026-06-15days on market $10,000 Active 17 DOM
-
2026-06-14days on market $10,000 Active 15 DOM
-
2026-06-13days on market $10,000 Active 14 DOM
-
2026-06-10days on market $10,000 Active 12 DOM
-
2026-06-09days on market $10,000 Active 11 DOM
-
2026-06-09price $10,000 Active 10 DOM
-
2026-06-08days on market $15,999 Active 10 DOM
-
2026-06-07days on market $15,999 Active 9 DOM
-
2026-06-03days on market $15,999 Active 5 DOM
-
2026-06-02days on market $15,999 Active 4 DOM
-
2026-06-01days on market $15,999 Active 3 DOM
-
2026-05-31days on market $15,999 Active 2 DOM
-
2026-05-30remarks 58-char remark
-
2026-05-30$15,999 Active 1 DOM
ⓘ Source: listings_history table (triggers on properties + properties_extension) + one-shot
backfill from property_details.listing_events for pre-trigger history.
Tax reassessment forecast AL · Resets to sale price
- Current annual tax
- $61 · $5/mo
- Projected year-2 tax
- $61 · $5/mo
- Expected delta
- $0/yr ($0/mo · 0.0%)
ⓘ Screening estimate from a state-policy table — verify with the county assessor before closing.
Climate risk First Street
- Flood 1/10 Low FEMA zone X (unshaded) · 0% chance over 30 yrs
- Wildfire 1/10 Low
- Heat 7/10 Severe 7 d/yr ≥107°F today · 19 d/yr by 30 yrs out
- Wind 8/10 Severe 80% chance of damaging wind over 30 yrs
- Air quality 3/10 Moderate 4 unhealthy d/yr today · 4 by 30 yrs out
Nearby sold comps map
Loading sold comps map…
Walkable amenities ~0.75 mi
Loading nearby amenities…
Taxation est. · year 1
- Rental income
- $11,476
- − Mortgage interest
- −$560
- − Property taxes
- −$61
- − Insurance
- −$50
- − Repairs & maintenance
- −$918
- − Management
- −$918
- − Depreciation
- −$291
- Taxable income
- $8,678
- Est. tax owed @ 24.0%
- −$2,083
- After-tax cash flow
- $6,243/yr
For passive investors: Depreciation is non-cash, so a rental often shows a tax loss while cash-flowing — sheltering income. Rental losses are passive: they offset passive income freely, and up to $25,000/yr can offset ordinary (W-2) income if you actively participate and your MAGI is under $100k (phasing out to $0 by $150k); unused losses carry forward. On sale, claimed depreciation is recaptured at up to 25%, and gains may owe capital-gains tax (a 1031 exchange can defer both). Figures are a year-1 estimate at your 24.0% rate — not tax advice; consult a CPA.
Schools (NCES district)
- District
- Montgomery County
- NCES district ID
- 0102430
- Math proficiency
- 9% ▼ -21.00%
- Reading proficiency
- 31% ▼ -1.00%
- Median HH income
- $43,902
- Composite
- 17.24/100
- National rank
- #9093
- State rank
- #106 of 129 in AL
Livability — Montgomery
- Score
- 65/100
- State rank
- #138
- US rank
- #13416
Category grades
Schools grade is shown separately in the Schools card above.
Census & demographics
- Census place
- Montgomery, AL
- City population
- 175,913
- Population (ZIP)
- 15,549
Population outlook (Montgomery County) Hauer SSP2
- Today (2025)
- 224,008 people
- By 2030
- 221,460 · -1.1%
- By 2040
- 214,179 · -4.4%
- By 2050
- 204,912 · -8.5%
- By 2075
- 177,821 · -20.6%
- By 2100
- 145,134 · -35.2%
Race, ethnicity, and origin ACS 2023
- Neighborhood character
- Predominantly Black (82%)
- Race & ethnicity
- Black 82% White 10% Hispanic / Latino 6% Two or more races 2%
- Hispanic origin (detail)
- Mexican 4% Puerto Rican 1%
- Foreign-born
- 2% · Canada
- Languages at home
- 96% English-only · Spanish 3%
Political lean MEDSL · Montgomery
- 2024 margin
- Solid D (+30.7) · D 64.8% · R 34.1% · Other 1.1%
- 2008→2024 swing
- +11.5pp toward D · 2008: 19.2pp · 2024: 30.7pp
- All cycles
- 2024: D+30.7 2020: D+31.5 2016: D+26.2 2012: D+24.3 2008: D+19.2
Not yet ingested
- Civics
- —
Market trends
- HPI YoY
- ▲ 2.71%
- Current HPI
- 95.2405
- Rent YoY
- —
- Metro
- —
- State GDP YoY
- ▲ 2.94%
- F500 in state
- 4
Industry mix (Fortune 500 HQ in AL)
| Industry | F500 HQs | Revenue |
|---|---|---|
| Financial Services | 1 | $8B |
|
||
| Healthcare | 1 | $5B |
|
||
Price history
-20.0% since first listed4 events — show timeline
- 2026-05-29 Listed $15,999 MAAR
- 2019-11-01 Sold (MLS) $7,500 MAAR
- 2019-09-11 Listed $10,000 MAAR
- 2005-10-10 Listed $20,000 MAAR
Property tax history
-1.6%/yrLatest (2025): $61 · +6.8% YoY. Source: county tax records.
Cash-flow waterfall
monthlySold comps — $/sqft
last 12 mo · ≤1 miLoading sold comps…