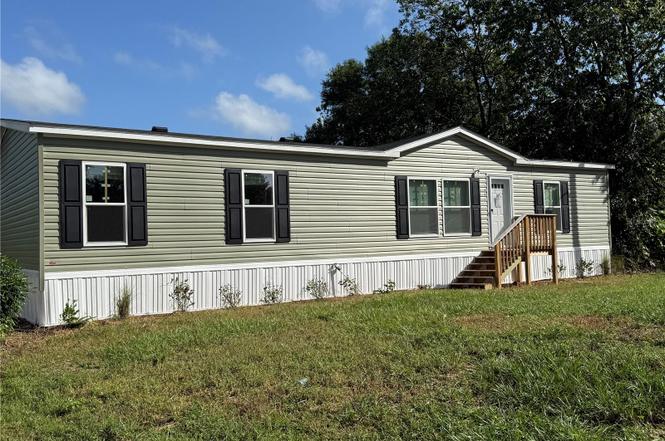
1561 Poe Rd · Dundee, FL
Flood risk 1/10 · Minimal
- FEMA flood zone
- A
- Chance of flooding over 30 yrs
- 0.0%
- Est. flood insurance / yr
- $1,009 – $1,996
Fire risk 6/10 · Moderate
- Est. fire insurance / yr
- $947 – $1,759
Heat risk 8/10 · Major
- Hot days now (above 108°F)
- 7 days/yr
- Hot days in 30 yrs
- 21 days/yr
Wind risk 9/10 · Severe
- Chance of severe wind over 30 yrs
- 99.0%
Air-quality risk 1/10 · Minimal
- Unhealthy air days now
- 0 days/yr
- Unhealthy air days in 30 yrs
- 0 days/yr
Risk factors via First Street. Map © Google.
Why this score? — see what drove the D- grade
The composite is a weighted blend of 9 inputs, each scored 0–100. Each bar is that input's sub-score; the figure is the points it added to the 100-point composite (weight × sub-score).
- Cash flow +11.5/30.0
- ARV discount +7.5/15.0
- Schools +3.5/10.0
- DSCR +3.4/10.0
- Livability +3.2/5.0
- 1% rule +2.7/10.0
- Rent growth +2.5/5.0
- Condition / age +2.5/5.0
- Appreciation +0.0/10.0
$239,900
🖨 Deal sheet (PDF) 📄 Offer letter ✓ Due diligence
Listing remarks MLS
3/2 mobile home on over acre. Covered decks, 3 storage buildings/workshops, MB has garden tub with separate shower dual vanity with walk in closets. Separate LR & GR, Kitchen has all appliances, island bar, a large pantry and lots of storage. Laundry roomhas mud sink with counter tops. All this in a fenced lot.
Key facts
- New black appliances
- Private 1 acre lot
- Open living area
Tags
Property features AI
Finance
- Other: Lot size about 1.1 acres
- Financial info: No lease restrictions reported
- HOA & community: No homeowners association reported; No association approval required
Exterior
- Utilities: Well water; Septic tank; Electricity connected
- Home design: Residential manufactured home (double wide); One story; Faces southwest; New construction; Completed condition; Model: SPRINTER
- Construction: Vinyl siding; Shingle roof; Crawlspace foundation; Living area approx. 1,456 (builder provided)
- Exterior features: Other exterior features; Paved road access
Interior
- Kitchen: Range; Refrigerator
- Bedrooms: 3 bedrooms
- Flooring: Carpet; Vinyl
- Bathrooms: 2 full bathrooms
- Heating & cooling: Central heating; Central air conditioning
- Interior features: Other interior features
- Laundry & utility: Laundry inside
Neighborhood map
What this means for you Summary
Snapshot
- This is a 3-bed/2.0-bath manufactured listed at $240k.
Deal economics
- At list price, monthly cash flow is $-206 ($-2k/yr) — negative.
- To cash-flow at today's rent, offer at most $204k (15.1% below list).
- To meet the 1% rule (rent ≥ 1% of price), the offer needs to be $186k (22.6% below list).
- Recommended offer: $186k (22.6% below list) — sets the bar for 1% rule.
Location & tenants
- Location reads 65/100 on livability (#638 in FL) — a middle-class / working-renter tenant base. Strengths: cost of living A+, housing A+, crime B+; Watch: employment D+, amenities F, commute F.
- Polk (suburban): math 39% / reading 43% proficiency, ranked #62 of 73 in FL (top 85%) — families likely to look elsewhere, expect single-tenant / working-renter base with shorter leases.
- Zoned schools: Sandhill Elementary School (math 21% / reading 37%, grade F, #1,932 of 2,144 statewide, top 91%, 991 students, 55% FRL); Mclaughlin Academy of Excellence (math 34% / reading 32%, grade F, #437 of 571 statewide, top 77%, 542 students, 68% FRL); Winter Haven Senior High School (math 26% / reading 38%, grade F, #415 of 667 statewide, top 63%, 2,467 students, 50% FRL) — zoned schools at 58% FRL track the district average.
- Market conditions: 501 active listings in the ZIP; 1 comparable units currently listed for rent nearby; 10,384 units permitted in Polk County in 2024 (1,716 in 5+ unit buildings).
- This rent runs 39% of the median local income ($57k/yr) — at the standard rent-burdened threshold; future hikes will face affordability resistance.
Forward outlook
- Local home prices are declining (-3.0%/yr); year-one equity from $2k of loan paydown is wiped out by about $7k of value loss. Plan a longer hold.
- Polk County population projected at +33% by 2050 — long-run rental-demand tailwind backs the buy-and-hold thesis.
Negotiation context
- It's been on market 255 days — a 12% lower offer ($211k) is reasonable based on typical stale-listing flexibility.
- 3 sale attempts since 12y ago; this cycle's ask has dropped $19k (7%) from the opening price — seller is motivated, your offer sets the floor, not the list.
- Current owner paid $33k; list at $240k implies a 629% gain — meaningful room to come down on a strong offer.
Risks & watch-outs
- Watch-outs: flood insurance adds $125/mo.
- Climate carrying-cost: in FEMA flood zone A (mandatory federal flood insurance); severe wind risk, 99% chance of damaging wind over 30y; major wildfire risk; extreme-heat days projected 7→21/yr by 2055 (HVAC capex compounding) — expect insurance premiums to compound above CPI over the hold.
Questions for the listing agent
- What do current leases actually rent for vs. the listed asking? Can we see a recent rent roll and the last 12 months of T-12 income?
- It's been on market 255 days. Have you received any prior offers? Is the seller open to a 23% concession, seller financing, or rate buy-down credit?
- What's the actual annual flood-insurance premium (NFIP or private), and is the property in a SFHA with mandatory coverage?
- Why hasn't it sold? Are there any deal-killer items the seller is aware of (foundation, flood, title, zoning, code violations)?
- Is there a deadline driving the sale (1031 exchange, divorce, estate, relocation)? That informs how much negotiation room exists.
- Schools are D-rated, which usually means shorter tenancies and higher turnover. Who's the typical renter profile here, and what's been the actual vacancy rate?
- The area grade is low — what's the realistic commute time and amenity access for the typical tenant pool here? Any planned neighborhood developments (good or bad) we should know about?
- What's the average days-on-market for RENTAL listings here right now (not sales)? A rising rental-DOM trend means longer vacancies and softer asking-rent achievability than the comps imply.
- What's the recent tenant-quality profile in this submarket — average credit score on applications, eviction rate, late-payment / NSF rate, and stable-employment percentage? A property-management company in the area should have these aggregated.
- How much new for-sale + rental construction is in the pipeline within 1–3 miles? Heavy new supply typically softens prices + rents 12–24 months out; constrained supply supports both.
Investment metrics
- 1% rule
- 0.77% ✗
- Cap rate
- 5.89%
- Cash-on-cash
- -1.43%
- DSCR
- 0.94
- GRM
- 10.8
CMA / ARV
No comps found within radius.
Projected returns pro-forma
-3.0% appreciation · 3.0% rent growth · sell at horizon
- IRR
- -22.4%
- Equity multiple
- 0.23×
- Total profit
- $-51,928
- Equity at exit
- $35,770
- IRR
- -16.6%
- Equity multiple
- 0.08×
- Total profit
- $-61,924
- Equity at exit
- $20,742
Cash invested: $67,172 (down + closing). Projections, not guarantees.
Landlord ↔ Tenant lean methodology
- Overall (STATE)
- 87 Strongly Landlord-Friendly
- State Florida
- 87 Strongly Landlord-Friendly · R+3
- County
- — inherits STATE
- City
- — inherits STATE
ZIP-level market 33898
- Home prices YoY
- -15.1%
- Active inventory
- 501
- Price-to-rent
- 10.8×
Monthly cashflow live
- Estimated rent
- $1,856 medium interval (Pro) →
- Mortgage (P&I)
- −$1,258
- Tax from tax record
- −$189 /mo · $2,266/yr
- Insurance
- −$100
- Flood insurance flood zone
- −$125 /mo · $1,502/yr
- HOA
- −$0
- Vacancy / Maint / Mgmt
- −$390
- Net cashflow
- $-206
Break-even live
Sensitivity live
| Price | -10% $-70 | -5% $-138 | +0% $-206 | +5% $-273 | +10% $-341 |
|---|---|---|---|---|---|
| Rent | -10% $-352 | -5% $-279 | +0% $-206 | +5% $-132 | +10% $-59 |
| Rate | -1.0pp $-85 | -0.5pp $-145 | base $-206 | +0.5pp $-268 | +1.0pp $-331 |
UW: 25.0% down · 7.5% · 30yr · 1.5% tax · 5.0% vac · 8.0% maint · 8.0% mgmt
Financing live
Cash to close
- Down payment
- $59,975
- Closing costs
- $7,197
- Reserves months
- —
- Total cash needed
- —
Loan-product check · same deal, 3 products live
Conventional
25% down · 7.5% · 30yr
- Down + closing
- —
- Monthly P&I
- —
- Monthly cashflow
- —
- DSCR
- —
- Eligible?
- —
Personal DTI + credit; lowest rate.
DSCR
20% down · 8.5% · 30yr
- Down + closing
- —
- Monthly P&I
- —
- Monthly cashflow
- —
- DSCR
- —
- Eligible?
- —
No personal income docs; deal must DSCR.
Hard money
10% down · 12.0% · 12mo
- Down + closing
- —
- Monthly P&I
- —
- Monthly cashflow
- —
- DSCR
- —
- Eligible?
- —
Short-term bridge; refi at stabilization.
Rent comps 1 comps
| Address | Beds | Baths | Sqft | Rent | $/sqft | DOM | Units | Dist |
|---|---|---|---|---|---|---|---|---|
| 6560 Timberlane Rd Lake Wales, FL | 3.0 | 2.0 | 1850 | $1,900 | $1.03 | 25d | 1 | 1.50mi |
Listing history 21 events
-
2026-06-22days on market $239,900 Active 255 DOM
-
2026-06-18days on market $239,900 Active 252 DOM
-
2026-06-17days on market $239,900 Active 251 DOM
-
2026-06-16days on market $239,900 Active 250 DOM
-
2026-06-15days on market $239,900 Active 249 DOM
-
2026-06-13days on market $239,900 Active 247 DOM
-
2026-06-10days on market $239,900 Active 244 DOM
-
2026-06-09days on market $239,900 Active 243 DOM
-
2026-06-08days on market $239,900 Active 242 DOM
-
2026-06-07days on market $239,900 Active 241 DOM
-
2026-06-05pricedays on market $239,900 Active 238 DOM
-
2026-06-03days on market $249,900 Active 236 DOM
-
2026-06-01days on market $249,900 Active 235 DOM
-
2026-05-31days on market $249,900 Active 234 DOM
-
2026-04-20price $249,900
-
2025-11-17price $254,000
-
2025-10-09$259,000 Active
-
2024-09-23historical
-
2024-06-04$149,900 Active
-
2014-03-05soldstatus $32,900 318-char remark
Show marketing remark (318 chars)
3/2 mobile home on over acre. Covered decks, 3 storage buildings/workshops, MB has garden tub with separate shower dual vanity with walk in closets. Separate LR & GR, Kitchen has all appliances, island bar, a large pantry and lots of storage. Laundry roomhas mud sink with counter tops. All this in a fenced lot.
-
2014-02-25$32,900 318-char remark
Show marketing remark (318 chars)
3/2 mobile home on over acre. Covered decks, 3 storage buildings/workshops, MB has garden tub with separate shower dual vanity with walk in closets. Separate LR & GR, Kitchen has all appliances, island bar, a large pantry and lots of storage. Laundry roomhas mud sink with counter tops. All this in a fenced lot.
ⓘ Source: listings_history table (triggers on properties + properties_extension) + one-shot
backfill from property_details.listing_events for pre-trigger history.
Tax reassessment forecast FL · Resets to sale price
- Current annual tax
- $2,266 · $189/mo
- Projected year-2 tax
- $2,266 · $189/mo
- Expected delta
- $0/yr ($0/mo · 0.0%)
ⓘ Screening estimate from a state-policy table — verify with the county assessor before closing.
Climate risk First Street
- Flood 1/10 Low FEMA zone A · 0% chance over 30 yrs
- Wildfire 6/10 Major
- Heat 8/10 Severe 7 d/yr ≥108°F today · 21 d/yr by 30 yrs out
- Wind 9/10 Extreme 99% chance of damaging wind over 30 yrs
- Air quality 1/10 Low 0 unhealthy d/yr today · 0 by 30 yrs out
Nearby sold comps map
Loading sold comps map…
Walkable amenities ~0.75 mi
Loading nearby amenities…
Taxation est. · year 1
- Rental income
- $22,277
- − Mortgage interest
- −$13,438
- − Property taxes
- −$2,266
- − Insurance
- −$2,702
- − Repairs & maintenance
- −$1,782
- − Management
- −$1,782
- − Depreciation
- −$6,979
- Taxable loss
- −$6,673
- Est. tax savings @ 24.0%
- +$1,601
- After-tax cash flow
- $-865/yr
For passive investors: Depreciation is non-cash, so a rental often shows a tax loss while cash-flowing — sheltering income. Rental losses are passive: they offset passive income freely, and up to $25,000/yr can offset ordinary (W-2) income if you actively participate and your MAGI is under $100k (phasing out to $0 by $150k); unused losses carry forward. On sale, claimed depreciation is recaptured at up to 25%, and gains may owe capital-gains tax (a 1031 exchange can defer both). Figures are a year-1 estimate at your 24.0% rate — not tax advice; consult a CPA.
Schools (NCES district)
- District
- Polk
- NCES district ID
- 1201590
- Math proficiency
- 39% ▼ -11.00%
- Reading proficiency
- 43% ▼ -4.00%
- Median HH income
- $43,979
- Composite
- 34.74/100
- National rank
- #5132
- State rank
- #62 of 73 in FL
Livability — Dundee
- Score
- 65/100
- State rank
- #638
- US rank
- #12542
Category grades
Schools grade is shown separately in the Schools card above.
Census & demographics
- County
- Polk County · 740,051 people
- City population
- 5,431
- Metro
- Lakeland-Winter Haven, FL
- Population (ZIP)
- 18,527
- Household income
- $57,224
- Rent vs Own
- Severe rent burden
- 148.0
Population outlook (Polk County) Hauer SSP2
- Today (2025)
- 752,975 people
- By 2030
- 804,621 · +6.9%
- By 2040
- 906,117 · +20.3%
- By 2050
- 1,000,476 · +32.9%
- By 2075
- 1,197,520 · +59.0%
- By 2100
- 1,271,518 · +68.9%
Race, ethnicity, and origin ACS 2023
- Neighborhood character
- Predominantly White (74%)
- Race & ethnicity
- White 74% Hispanic / Latino 17% Two or more races 10% Black 6%
- Hispanic origin (detail)
- Mexican 6% Puerto Rican 4% Cuban 3%
- Common ancestry
- Slovak 3% Lithuanian 2% Italian 2%
- Foreign-born
- 9% · Canada
- Languages at home
- 81% English-only · Spanish 17% French/Haitian/Cajun 1% Other Indo-European 1%
Political lean MEDSL · Polk
- 2024 margin
- Strong R (+20.7) · D 39.2% · R 59.9%
- 2008→2024 swing
- -14.6pp toward R · 2008: -6.1pp · 2024: -20.7pp
- All cycles
- 2024: R+20.7 2020: R+14.4 2016: R+14.1 2012: R+6.8 2008: R+6.1
Not yet ingested
- Civics
- —
Market trends
- HPI YoY
- ▼ -60.62%
- Current HPI
- 340.6056
- Rent YoY
- —
- Metro
- Lakeland-Winter Haven, FL
- State GDP YoY
- ▲ 3.28%
- F500 in state
- 36
Industry mix (Fortune 500 HQ in FL)
| Industry | F500 HQs | Revenue |
|---|---|---|
| Industrial Technology | 2 | $29B |
|
||
| Insurance | 2 | $17B |
|
||
| Retail | 1 | $60B |
|
||
| Technology Distribution | 1 | $58B |
|
||
| Homebuilding | 1 | $35B |
|
||
| Technology Manufacturing | 1 | $35B |
|
||
Price history
+659.6% since first listed7 events — show timeline
- 2026-04-20 Price Changed $249,900 Stellar MLS as Distributed by MLS Grid
- 2025-11-17 Price Changed $254,000 Stellar MLS as Distributed by MLS Grid
- 2025-10-09 Listed $259,000 Stellar MLS as Distributed by MLS Grid
- 2024-09-23 Listing Removed — Stellar MLS as Distributed by MLS Grid
- 2024-06-04 Listed $149,900 Stellar MLS as Distributed by MLS Grid
- 2014-03-05 Sold (MLS) $32,900 Stellar MLS as Distributed by MLS Grid
- 2014-02-25 Listed $32,900 Stellar MLS as Distributed by MLS Grid
Property tax history
+24.0%/yrLatest (2025): $2,266 · +6.5% YoY. Source: county tax records.
Cash-flow waterfall
monthlySold comps — $/sqft
last 12 mo · ≤1 miLoading sold comps…