 🏷️ Likely Rental
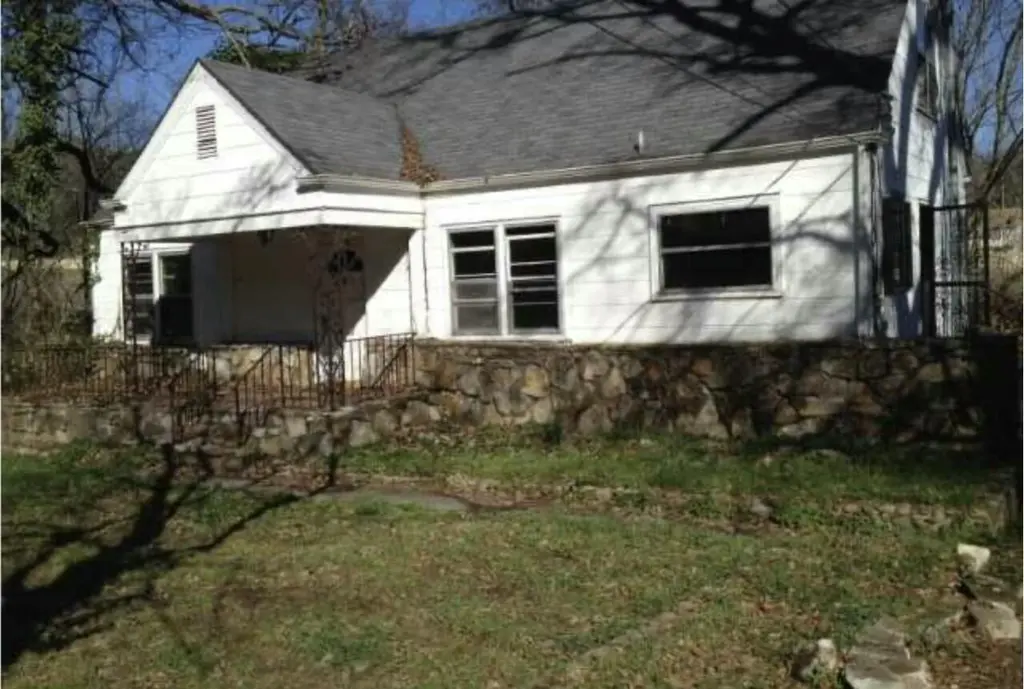
3727 Anderson Ave · Chattanooga, TN
Flood risk 8/10 · Major
- FEMA flood zone
- X (unshaded)
- Chance of flooding over 30 yrs
- 0.78%
- Est. flood insurance / yr
- $507 – $1,088
Fire risk 1/10 · Minimal
- Est. fire insurance / yr
- $949 – $1,763
Heat risk 6/10 · Moderate
- Hot days now (above 105°F)
- 7 days/yr
- Hot days in 30 yrs
- 19 days/yr
Wind risk 4/10 · Minor
- Chance of severe wind over 30 yrs
- 12.0%
Air-quality risk 3/10 · Minor
- Unhealthy air days now
- 2 days/yr
- Unhealthy air days in 30 yrs
- 2 days/yr
Risk factors via First Street. Map © Google.
Why this score? — see what drove the C grade
The composite is a weighted blend of 9 inputs, each scored 0–100. Each bar is that input's sub-score; the figure is the points it added to the 100-point composite (weight × sub-score).
- Cash flow +21.9/30.0
- ARV discount +15.0/15.0
- DSCR +7.0/10.0
- 1% rule +4.7/10.0
- Livability +3.9/5.0
- Schools +2.7/10.0
- Condition / age +2.5/5.0
- Rent growth +2.0/5.0
- Appreciation +0.0/10.0
$219,900
🖨 Deal sheet 📄 Offer letter ✓ Due diligence
Listing remarks
Do Not Disturb Tenants!!!!! Exclusive Value-Add Opportunity - 2,400 SQFT Income-Producing Asset in Prime Location An Investor's Dream! This expansive 2,400 sqft property presents a premier value-add and flip opportunity, offering immediate rental income with strong upside potential. Whether you're looking to hold for cash flow or renovate and resell for a profit, this asset is a standout in today's market. Located in a high-demand, centrally positioned area of East Ridge , it provides effortless access to major highways, shopping, dining, and public transit--ensuring sustained tenant demand and long-term appreciation. Investment Highlights: 2,400 SQFT of Opportunity - Generous space
Key facts
- Effortless access
- 7,696 sq ft lot
- Built 1947
Tags
Property features AI
Finance
- Other: Located in the Lerch Place subdivision
Exterior
- Parking: Driveway
- Utilities: Public water; Public sewer; Electricity connected
- Home design: Single-family residence; Residential property
- Construction: Wood siding exterior; Block foundation; Built area above grade listed as 2,400
- Exterior features: No notable exterior features listed
Interior
- Bathrooms: 2 full bathrooms
- Heating & cooling: Window Unit(s) cooling
- Interior features: Basement present; Window air conditioning units
Neighborhood map
What this means for you Summary
Snapshot
- This is a 3-bed/2.0-bath single-family listed at $220k.
Deal economics
- At list price, monthly cash flow is $278 ($3k/yr) — positive.
- The deal already cash-flows at list — no discount required.
- To meet the 1% rule (rent ≥ 1% of price), the offer needs to be $213k (3.3% below list).
- Recommended offer: $213k (3.3% below list) — sets the bar for 1% rule.
- Cap rate 8.2% vs local median 3.4% in Chattanooga — top-decile yield for the area; either an underpriced asset or a hidden risk that comps aren't pricing in. Stress-test before assuming the spread holds.
Location & tenants
- Location reads 78/100 on livability (#3 in TN, #2,582 nationally) — a middle-class / working-renter tenant base. Strengths: amenities A+, commute A+, cost of living A+; Watch: employment D+, crime F.
- Hamilton County (urban): math 31% / reading 31% proficiency, ranked #42 of 139 in TN (top 30%) — families likely to look elsewhere, expect single-tenant / working-renter base with shorter leases.
- Zoned schools: East Ridge Elementary (math 22% / reading 18%, grade F, #644 of 952 statewide, top 68%, 996 students, 0% FRL); East Ridge Middle School (math 12% / reading 14%, grade F, #237 of 333 statewide, top 72%, 701 students, 0% FRL); East Ridge High School (math 7% / reading 17%, grade F, #265 of 332 statewide, top 80%, 1,008 students, 0% FRL) — zoned schools average 0% FRL vs 52% district-wide (52 pts lower); this property's tenant base skews higher-income than the district average.
- Zoned-school proficiency averages 15% at this address vs 31% district-wide (-16 pts) — the specific schools serving this property underperform the Hamilton County average; the district grade overstates school quality for this exact location.
- Market conditions: Rents soft (-2.0%/yr); 157 active listings in the ZIP; 5 comparable units currently listed for rent nearby; rentals at typical pace (median 24d on market — plan ~3-4 weeks tenant-placement turnaround); 2,133 units permitted in Hamilton County in 2024 (405 in 5+ unit buildings).
- This rent runs 41% of the median local income ($63k/yr) — at the standard rent-burdened threshold; future hikes will face affordability resistance.
Forward outlook
- Local home prices are declining (-3.0%/yr); year-one equity from $2k of loan paydown is wiped out by about $7k of value loss. Plan a longer hold.
- Hamilton County population projected at +23% by 2050 — long-run rental-demand tailwind backs the buy-and-hold thesis.
Negotiation context
- It's been on market 38 days — a 3% lower offer ($213k) is reasonable based on typical stale-listing flexibility.
- Current owner paid $14k; list at $220k implies a 1471% gain — meaningful room to come down on a strong offer.
Risks & watch-outs
- Watch-outs: flood insurance adds $66/mo; built in 1947 — expect roof / HVAC / electrical / plumbing capex.
- Climate carrying-cost: severe flood risk; extreme-heat days projected 7→19/yr by 2055 (HVAC capex compounding) — expect insurance premiums to compound above CPI over the hold.
Questions for the listing agent
- It's been on market 38 days. Have you received any prior offers? Is the seller open to a 3% concession, seller financing, or rate buy-down credit?
- Built in 1947 — when were the roof, HVAC, electrical panel, plumbing, and water heater last replaced?
- What's the actual annual flood-insurance premium (NFIP or private), and is the property in a SFHA with mandatory coverage?
- Is there a deadline driving the sale (1031 exchange, divorce, estate, relocation)? That informs how much negotiation room exists.
- Schools are F-rated, which usually means shorter tenancies and higher turnover. Who's the typical renter profile here, and what's been the actual vacancy rate?
- Crime grade is F in this area — have there been break-ins, vandalism, or insurance claims at this property in the last 3 years? What carrier currently insures it and at what premium?
- What's the average days-on-market for RENTAL listings here right now (not sales)? A rising rental-DOM trend means longer vacancies and softer asking-rent achievability than the comps imply.
- What's the recent tenant-quality profile in this submarket — average credit score on applications, eviction rate, late-payment / NSF rate, and stable-employment percentage? A property-management company in the area should have these aggregated.
- How much new for-sale + rental construction is in the pipeline within 1–3 miles? Heavy new supply typically softens prices + rents 12–24 months out; constrained supply supports both.
Investment metrics
- 1% rule
- 0.97% ✗
- Cap rate
- 8.17%
- Cash-on-cash
- 6.72%
- DSCR
- 1.30
- GRM
- 8.6
CMA / ARV
- ARV (on-the-fly)
- $439,200
- Comps found
- 7
Show comp detail 7 sales within ~0.75 mi
| Address | Dist | Beds/Ba | Sqft | Sold | Price | $/sf | Match |
|---|---|---|---|---|---|---|---|
| 4101 Wiley Ave | 0.44mi | 3/2.0 | 2,318 (-3%) | 12mo | $425,000 | $183 | 64 |
| 400 Marlboro Ave | 0.59mi | 3/2.0 | 2,291 (-4%) | 3mo | $380,000 | $166 | 62 |
| 901 Belvoir Hills Dr | 0.63mi | 3/2.0 | 2,216 (-8%) | 5mo | $362,000 | $163 | 54 |
| 111 Belvoir Ave | 0.47mi | 3/2.5 | 2,644 (+10%) | 10mo | $505,000 | $191 | 51 |
| 914 Belvoir Hills Cir | 0.70mi | 4/3.0 (+1) | 2,415 (+1%) | 15mo | $335,000 | $139 | 44 |
| 103 S Sweetbriar Ave | 0.71mi | 3/2.0 | 2,045 (-15%) | 1mo | $425,000 | $208 | 42 |
| 3541 Dell Trl | 0.60mi | 4/2.5 (+1) | 2,595 (+8%) | 24mo | $475,000 | $183 | 32 |
Match score weights: distance 35% · size 25% · config 20% · recency 20%. Top-matched comps best support the ARV.
Projected returns pro-forma
-3.0% appreciation · 0.0% rent growth · sell at horizon
- IRR
- -11.1%
- Equity multiple
- 0.61×
- Total profit
- $-24,171
- Equity at exit
- $32,788
- IRR
- -6.5%
- Equity multiple
- 0.64×
- Total profit
- $-22,455
- Equity at exit
- $19,013
Cash invested: $61,572 (down + closing). Projections, not guarantees.
Landlord ↔ Tenant lean methodology
- Overall (STATE)
- 87 Strongly Landlord-Friendly
- State Tennessee
- 87 Strongly Landlord-Friendly · R+13
- County
- — inherits STATE
- City
- — inherits STATE
ZIP-level market 37412
- Home prices YoY
- -28.8%
- Rents YoY
- -2.0%
- Active inventory
- 157
- Price-to-rent
- 8.6×
Monthly cashflow live
- Estimated rent
- $2,126 medium interval (Pro) →
- Mortgage (P&I)
- −$1,153
- Tax from tax record
- −$90 /mo · $1,075/yr
- Insurance
- −$92
- Flood insurance flood zone
- −$66 /mo · $798/yr
- HOA
- −$0
- Vacancy / Maint / Mgmt
- −$446
- Net cashflow
- $278
Break-even live
UW: 25.0% down · 7.5% · 30yr · 1.5% tax · 5.0% vac · 8.0% maint · 8.0% mgmt
Financing live
Cash to close
- Down payment
- $54,975
- Closing costs
- $6,597
- Reserves months
- —
- Total cash needed
- —
Loan-product check · same deal, 3 products live
Conventional
25% down · 7.5% · 30yr
- Down + closing
- —
- Monthly P&I
- —
- Monthly cashflow
- —
- DSCR
- —
- Eligible?
- —
Personal DTI + credit; lowest rate.
DSCR
20% down · 8.5% · 30yr
- Down + closing
- —
- Monthly P&I
- —
- Monthly cashflow
- —
- DSCR
- —
- Eligible?
- —
No personal income docs; deal must DSCR.
Hard money
10% down · 12.0% · 12mo
- Down + closing
- —
- Monthly P&I
- —
- Monthly cashflow
- —
- DSCR
- —
- Eligible?
- —
Short-term bridge; refi at stabilization.
Rent comps 5 comps
| Address | Beds | Baths | Sqft | Rent | $/sqft | DOM | Units | Dist |
|---|---|---|---|---|---|---|---|---|
| 3229 Westonia Dr Chattanooga, TN | 4.0 | 2.0 | 2130 | $2,695 | $1.27 | 23d | 1 | 0.58mi |
| 3617 Monte Vista Dr Chattanooga, TN | 3.0 | 2.0 | 1628 | $1,823 | $1.12 | 13d | 1 | 0.60mi |
| 5314 Audreys Pl Chattanooga, TN | 4.0 | 2.5 | 1645 | $2,295 | $1.40 | 21d | 1 | 1.37mi |
| 4224 Victory St Chattanooga, TN | 3.0 | 2.0 | 1736 | $1,995 | $1.15 | 23d | 1 | 1.46mi |
| 3400 Betty Ln Unit 3403 East Ridge, TN | 3.0 | 2.5 | 2500 | $1,350 | $0.54 | 23d | 1 | 1.47mi |
Listing history 23 events
-
2026-06-18days on market $219,900 Active 38 DOM
-
2026-06-17days on market $219,900 Active 37 DOM
-
2026-06-16days on market $219,900 Active 36 DOM
-
2026-06-15days on market $219,900 Active 35 DOM
-
2026-06-14days on market $219,900 Active 33 DOM
-
2026-06-10days on market $219,900 Active 30 DOM
-
2026-06-09days on market $219,900 Active 29 DOM
-
2026-06-08days on market $219,900 Active 28 DOM
-
2026-06-07days on market $219,900 Active 27 DOM
-
2026-06-05days on market $219,900 Active 24 DOM
-
2026-06-03days on market $219,900 Active 23 DOM
-
2026-06-02days on market $219,900 Active 22 DOM
-
2026-06-01days on market $219,900 Active 21 DOM
-
2026-05-31days on market $219,900 Active 20 DOM
-
2026-05-30days on market $219,900 Active 19 DOM
-
2026-05-08$219,900 Active
-
2025-06-01price $239,900
-
2023-12-16price $249,000
-
2023-09-11price $219,000
-
2021-04-17price $134,900
-
2012-12-03soldstatus $14,000
-
2012-12-03soldstatus $17,500
-
2012-11-26soldstatus $14,000
ⓘ Source: listings_history table (triggers on properties + properties_extension) + one-shot
backfill from property_details.listing_events for pre-trigger history.
Tax reassessment forecast TN · Resets to sale price
- Current annual tax
- $1,075 · $90/mo
- Projected year-2 tax
- $1,561 · $130/mo
- Expected delta
- +$487/yr (+$41/mo · 45.3%)
ⓘ Screening estimate from a state-policy table — verify with the county assessor before closing.
Climate risk First Street
- Flood 8/10 Severe FEMA zone X (unshaded) · 78% chance over 30 yrs
- Wildfire 1/10 Low
- Heat 6/10 Major 7 d/yr ≥105°F today · 19 d/yr by 30 yrs out
- Wind 4/10 Moderate 12% chance of damaging wind over 30 yrs
- Air quality 3/10 Moderate 2 unhealthy d/yr today · 2 by 30 yrs out
Nearby sold comps map
Loading sold comps map…
Walkable amenities ~0.75 mi
Loading nearby amenities…
Taxation est. · year 1
- Rental income
- $25,507
- − Mortgage interest
- −$12,318
- − Property taxes
- −$1,075
- − Insurance
- −$1,897
- − Repairs & maintenance
- −$2,041
- − Management
- −$2,041
- − Depreciation
- −$6,397
- Taxable loss
- −$260
- Est. tax savings @ 24.0%
- +$62
- After-tax cash flow
- $3,403/yr
For passive investors: Depreciation is non-cash, so a rental often shows a tax loss while cash-flowing — sheltering income. Rental losses are passive: they offset passive income freely, and up to $25,000/yr can offset ordinary (W-2) income if you actively participate and your MAGI is under $100k (phasing out to $0 by $150k); unused losses carry forward. On sale, claimed depreciation is recaptured at up to 25%, and gains may owe capital-gains tax (a 1031 exchange can defer both). Figures are a year-1 estimate at your 24.0% rate — not tax advice; consult a CPA.
Schools (NCES district)
- District
- Hamilton County
- NCES district ID
- 4701590
- Math proficiency
- 31% ▼ -10.00%
- Reading proficiency
- 31% ▼ -3.00%
- Median HH income
- $47,456
- Composite
- 26.8/100
- National rank
- #7122
- State rank
- #42 of 139 in TN
Livability — Chattanooga
- Score
- 78/100
- State rank
- #3
- US rank
- #2582
Category grades
Schools grade is shown separately in the Schools card above.
Census & demographics
- Census place
- Chattanooga, TN
- County
- Hamilton County · 312,777 people
- City population
- 131,999
- Metro
- Chattanooga, TN-GA
- Population (ZIP)
- 21,864
- Household income
- $62,508
- Rent vs Own
- Severe rent burden
- 857.0
Population outlook (Hamilton County) Hauer SSP2
- Today (2025)
- 393,784 people
- By 2030
- 412,983 · +4.9%
- By 2040
- 449,502 · +14.1%
- By 2050
- 484,341 · +23.0%
- By 2075
- 565,746 · +43.7%
- By 2100
- 618,394 · +57.0%
Race, ethnicity, and origin ACS 2023
- Neighborhood character
- Predominantly White (69%)
- Race & ethnicity
- White 69% Hispanic / Latino 15% Black 11% Two or more races 5%
- Hispanic origin (detail)
- Mexican 9% Puerto Rican 2%
- Common ancestry
- Slovak 3% Italian 2% American 2%
- Foreign-born
- 9% · Canada, Dominican Republic
- Languages at home
- 85% English-only · Spanish 12% Russian/Polish/Slavic 1% Other Indo-European 1%
Political lean MEDSL · Hamilton
- 2024 margin
- R (+13.1) · D 42.7% · R 55.7% · Other 1.6%
- 2008→2024 swing
- -1.2pp toward R · 2008: -11.8pp · 2024: -13.1pp
- All cycles
- 2024: R+13.1 2020: R+9.7 2016: R+16.6 2012: R+14.8 2008: R+11.8
Not yet ingested
- Civics
- —
Market trends
- HPI YoY
- ▼ -109.86%
- Current HPI
- 271.4004
- Rent YoY
- ▼ -2.04%
- Metro
- Chattanooga, TN-GA
- State GDP YoY
- ▲ 2.78%
- F500 in state
- 22
Industry mix (Fortune 500 HQ in TN)
| Industry | F500 HQs | Revenue |
|---|---|---|
| Healthcare | 3 | $91B |
|
||
| Retail | 3 | $72B |
|
||
| Transportation / Logistics | 1 | $88B |
|
||
| Paper / Packaging | 1 | $19B |
|
||
| Insurance | 1 | $13B |
|
||
| Energy | 1 | $12B |
|
||
Price history
+1470.7% since first listed8 events — show timeline
- 2026-05-08 Listed $219,900 GCAR
- 2025-06-01 Price Changed $239,900 GCAR
- 2023-12-16 Price Changed $249,000 GCAR
- 2023-09-11 Price Changed $219,000 GCAR
- 2021-04-17 Price Changed $134,900 GCAR
- 2012-12-03 Sold (Public Records) $17,500 Public Records
- 2012-12-03 Sold (Public Records) $14,000 Public Records
- 2012-11-26 Sold (MLS) $14,000 GCAR
Property tax history
+11.9%/yrLatest (2025): $1,075 · +16.5% YoY. Source: county tax records.
Cash-flow waterfall
monthlySold comps — $/sqft
last 12 mo · ≤1 miLoading sold comps…