520 Annabelle Dr · Bolivar Peninsula, TX
Flood risk 9/10 · Severe
- FEMA flood zone
- VE
- Chance of flooding over 30 yrs
- 0.99%
- Est. flood insurance / yr
- $5,013 – $11,043
Fire risk 4/10 · Minor
- Est. fire insurance / yr
- $1,222 – $2,270
Heat risk 10/10 · Severe
- Hot days now (above 107°F)
- 7 days/yr
- Hot days in 30 yrs
- 27 days/yr
Wind risk 10/10 · Severe
- Chance of severe wind over 30 yrs
- 99.0%
Air-quality risk 2/10 · Minimal
- Unhealthy air days now
- 1 days/yr
- Unhealthy air days in 30 yrs
- 1 days/yr
Risk factors via First Street. Map © Google.
Why this score? — see what drove the B+ grade
The composite is a weighted blend of 9 inputs, each scored 0–100. Each bar is that input's sub-score; the figure is the points it added to the 100-point composite (weight × sub-score).
- Cash flow +30.0/30.0
- 1% rule +10.0/10.0
- DSCR +10.0/10.0
- ARV discount +7.5/15.0
- Schools +5.1/10.0
- Appreciation +5.0/10.0
- Condition / age +4.0/5.0
- Livability +3.2/5.0
- Rent growth +2.5/5.0
$150,000
🖨 Deal sheet 📄 Offer letter ✓ Due diligence
Listing remarks
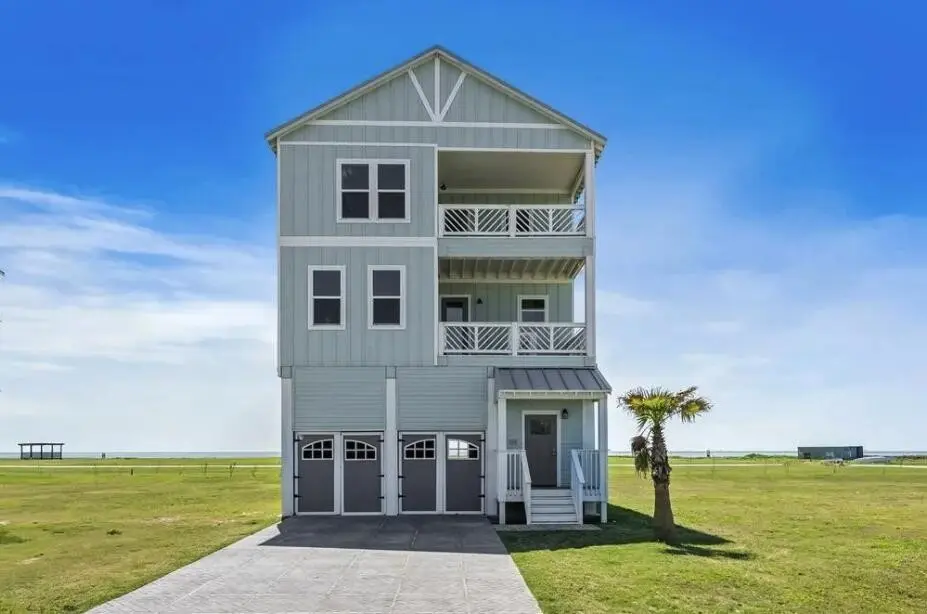
This is a 1/8th interest in the residential property. Stay when you want, rent it out with a professional management company when you aren't there! Located at 520 Annabelle Drive in the Aria subdivision of Gilchrist, Texas, this home (often marketed under names like "Ocean Paradise") is a high-end beachfront retreat designed specifically for large groups and multi-generational families.
Key facts
- 4,356 sq ft lot
- 2 parking spots
- Built 2024
Property features AI
Finance
- Other: Details not provided
- Financial info: Lease not considered
- HOA & community: Part of the Cory Morehead Subdivision association
Exterior
- Parking: Attached carport; Detached carport; Two carport spaces
- Security: Details not provided
- Utilities: Public sewer
- Home design: Residential property; Built in 2024
- Construction: Wood siding construction
- Exterior features: Corner lot; Ravine on the lot; Metal roof
Interior
- Kitchen: Details not provided
- Bedrooms: Details not provided
- Flooring: Details not provided
- Bathrooms: Five full bathrooms and one half bathroom
- Heating & cooling: Central heating (electric); Central air conditioning (electric)
- Interior features: Total of 5 rooms
- Laundry & utility: Details not provided
Neighborhood map
What this means for you Summary
Snapshot
- This is a 5-bed/5.5-bath single-family listed at $150k. Condition is rated good.
Deal economics
- At list price, monthly cash flow is $949 ($11k/yr) — positive.
- The deal already cash-flows at list — no discount required.
- Meets the 1% rule at list price ($4k rent vs $150k).
- Recommended offer: $146k (3.0% below list) — sets the bar for market timing.
- Cap rate 19.2% vs local median 2.1% in Bolivar Peninsula — top-decile yield for the area; either an underpriced asset or a hidden risk that comps aren't pricing in. Stress-test before assuming the spread holds.
Location & tenants
- Location reads 65/100 on livability (#719 in TX) — a middle-class / working-renter tenant base. Strengths: crime A+, cost of living A+, housing A+; Watch: schools D+, amenities F, commute F.
- High Island ISD (rural): math 65% / reading 50% proficiency, ranked #177 of 1,141 in TX (top 16%) — acceptable for families but not a draw, mixed tenant base, ~2y average lease.
- Market conditions: 227 active listings in the ZIP; 3,258 units permitted in Galveston County in 2024 (0 in 5+ unit buildings).
Forward outlook
- In year one you build about $6k of equity ($1k loan paydown + $4k appreciation (3.0% local appreciation)).
- Galveston County population projected at +43% by 2050 — long-run rental-demand tailwind backs the buy-and-hold thesis.
- At projected returns (3.0% appreciation + 3.0% rent growth), your $42k cash investment doubles in ~3 years — after that, you're playing with house money.
- By year 7, paydown + projected appreciation supports a ~$35k cash-out refi (75% LTV) — recoverable capital for the next deal without selling this one.
Negotiation context
- It's been on market 35 days — a 3% lower offer ($146k) is reasonable based on typical stale-listing flexibility.
- 5 sale attempts with the ask held roughly flat each time — persistent listings suggest the price (not the market) is what's stuck; bring a comps-based counter.
Risks & watch-outs
- Watch-outs: property tax is 3.7% of price; flood insurance adds $669/mo.
- Climate carrying-cost: in FEMA flood zone VE (mandatory federal flood insurance); severe wind risk, 99% chance of damaging wind over 30y; extreme-heat days projected 7→27/yr by 2055 (HVAC capex compounding) — expect insurance premiums to compound above CPI over the hold.
Questions for the listing agent
- It's been on market 35 days. Have you received any prior offers? Is the seller open to a 3% concession, seller financing, or rate buy-down credit?
- Property tax is high relative to price — has the assessment been appealed recently, and will the sale trigger a re-assessment?
- What's the actual annual flood-insurance premium (NFIP or private), and is the property in a SFHA with mandatory coverage?
- Is there a deadline driving the sale (1031 exchange, divorce, estate, relocation)? That informs how much negotiation room exists.
- Schools are D-rated, which usually means shorter tenancies and higher turnover. Who's the typical renter profile here, and what's been the actual vacancy rate?
- What's the average days-on-market for RENTAL listings here right now (not sales)? A rising rental-DOM trend means longer vacancies and softer asking-rent achievability than the comps imply.
- What's the recent tenant-quality profile in this submarket — average credit score on applications, eviction rate, late-payment / NSF rate, and stable-employment percentage? A property-management company in the area should have these aggregated.
- How much new for-sale + rental construction is in the pipeline within 1–3 miles? Heavy new supply typically softens prices + rents 12–24 months out; constrained supply supports both.
Investment metrics
- 1% rule
- 2.47% ✓
- Cap rate
- 19.24%
- Cash-on-cash
- 46.23%
- DSCR
- 3.06
- GRM
- 3.4
CMA / ARV
- ARV (on-the-fly)
- $1,103,478
- Comps found
- 1
Show comp detail 1 sale within ~0.75 mi
| Address | Dist | Beds/Ba | Sqft | Sold | Price | $/sf | Match |
|---|---|---|---|---|---|---|---|
| 768 Bolivar Dunes Blvd | 0.71mi | 4/3.0 (-1) | 2,300 (+9%) | 1mo | $1,199,000 | $521 | 36 |
Match score weights: distance 35% · size 25% · config 20% · recency 20%. Top-matched comps best support the ARV.
Projected returns pro-forma
3.0% appreciation · 3.0% rent growth · sell at horizon
- IRR
- 33.3%
- Equity multiple
- 2.88×
- Total profit
- $79,157
- Equity at exit
- $67,446
- IRR
- 33.7%
- Equity multiple
- 5.71×
- Total profit
- $197,968
- Equity at exit
- $103,943
Cash invested: $42,000 (down + closing). Projections, not guarantees.
Landlord ↔ Tenant lean methodology
- Overall (STATE)
- 87 Strongly Landlord-Friendly
- State Texas
- 87 Strongly Landlord-Friendly · R+5
- County
- — inherits STATE
- City
- — inherits STATE
ZIP-level market 77617
- Active inventory
- 227
- Price-to-rent
- 3.4×
Monthly cashflow live
- Estimated rent
- $3,708 medium interval (Pro) →
- Mortgage (P&I)
- −$787
- Tax from tax record
- −$462 /mo · $5,540/yr
- Insurance
- −$62
- Flood insurance flood zone
- −$669 /mo · $8,028/yr
- HOA
- −$0
- Vacancy / Maint / Mgmt
- −$779
- Net cashflow
- $949
Break-even live
UW: 25.0% down · 7.5% · 30yr · 1.5% tax · 5.0% vac · 8.0% maint · 8.0% mgmt
Financing live
Cash to close
- Down payment
- $37,500
- Closing costs
- $4,500
- Reserves months
- —
- Total cash needed
- —
Loan-product check · same deal, 3 products live
Conventional
25% down · 7.5% · 30yr
- Down + closing
- —
- Monthly P&I
- —
- Monthly cashflow
- —
- DSCR
- —
- Eligible?
- —
Personal DTI + credit; lowest rate.
DSCR
20% down · 8.5% · 30yr
- Down + closing
- —
- Monthly P&I
- —
- Monthly cashflow
- —
- DSCR
- —
- Eligible?
- —
No personal income docs; deal must DSCR.
Hard money
10% down · 12.0% · 12mo
- Down + closing
- —
- Monthly P&I
- —
- Monthly cashflow
- —
- DSCR
- —
- Eligible?
- —
Short-term bridge; refi at stabilization.
Listing history 29 events
-
2026-06-18days on market $150,000 Active 35 DOM
-
2026-06-17days on market $150,000 Active 34 DOM
-
2026-06-16days on market $150,000 Active 33 DOM
-
2026-06-15days on market $150,000 Active 32 DOM
-
2026-06-13days on market $150,000 Active 30 DOM
-
2026-06-12days on market $150,000 Active 29 DOM
-
2026-06-10days on market $150,000 Active 26 DOM
-
2026-06-08days on market $150,000 Active 25 DOM
-
2026-06-08days on market $150,000 Active 24 DOM
-
2026-06-07days on market $150,000 Active 23 DOM
-
2026-06-03days on market $150,000 Active 20 DOM
-
2026-06-02days on market $150,000 Active 19 DOM
-
2026-06-01days on market $150,000 Active 18 DOM
-
2026-05-31days on market $150,000 Active 17 DOM
-
2026-05-14$150,000 Active
-
2025-09-16historical
-
2025-08-15status Active
-
2025-08-15price $499,900
-
2025-08-15$499,900 Active
-
2025-07-31historical
-
2025-05-27price $549,900
-
2025-05-27price $549,900
-
2025-05-12price $559,900
-
2025-05-12price $559,900
-
2025-05-05price $569,900
-
2025-05-05price $569,900
-
2025-04-29$579,900 Active
-
2025-04-22$579,900 Active
-
2024-04-16soldstatus
ⓘ Source: listings_history table (triggers on properties + properties_extension) + one-shot
backfill from property_details.listing_events for pre-trigger history.
Tax reassessment forecast TX · Resets to sale price
- Current annual tax
- $5,540 · $462/mo
- Projected year-2 tax
- $5,540 · $462/mo
- Expected delta
- $0/yr ($0/mo · 0.0%)
ⓘ Screening estimate from a state-policy table — verify with the county assessor before closing.
Climate risk First Street
- Flood 9/10 Extreme FEMA zone VE · 99% chance over 30 yrs
- Wildfire 4/10 Moderate
- Heat 10/10 Extreme 7 d/yr ≥107°F today · 27 d/yr by 30 yrs out
- Wind 10/10 Extreme 99% chance of damaging wind over 30 yrs
- Air quality 2/10 Low 1 unhealthy d/yr today · 1 by 30 yrs out
Nearby sold comps map
Loading sold comps map…
Walkable amenities ~0.75 mi
Loading nearby amenities…
Taxation est. · year 1
- Rental income
- $44,491
- − Mortgage interest
- −$8,402
- − Property taxes
- −$5,540
- − Insurance
- −$8,778
- − Repairs & maintenance
- −$3,559
- − Management
- −$3,559
- − Depreciation
- −$4,364
- Taxable income
- $10,288
- Est. tax owed @ 24.0%
- −$2,469
- After-tax cash flow
- $8,921/yr
For passive investors: Depreciation is non-cash, so a rental often shows a tax loss while cash-flowing — sheltering income. Rental losses are passive: they offset passive income freely, and up to $25,000/yr can offset ordinary (W-2) income if you actively participate and your MAGI is under $100k (phasing out to $0 by $150k); unused losses carry forward. On sale, claimed depreciation is recaptured at up to 25%, and gains may owe capital-gains tax (a 1031 exchange can defer both). Figures are a year-1 estimate at your 24.0% rate — not tax advice; consult a CPA.
Condition & rehab AI · 12 photos
This well-maintained, high-end beachfront home is move-in ready and ideal for large groups and multi-generational families.
Value-add opportunities
- Both Landscaping improvements — Enhance curb appeal and attract more visitors
- Both Add smart home features — Improve convenience and attract tech-savvy buyers
- Both Install smart thermostat — Reduce energy costs and attract eco-conscious buyers
Renovation cost estimate screening
Value-add ROI direction
- Both Landscaping improvements — Enhance curb appeal and attract more visitors ↑
- Both Add smart home features — Improve convenience and attract tech-savvy buyers ↑
- Both Install smart thermostat — Reduce energy costs and attract eco-conscious buyers ↑
ⓘ Cost ranges are severity-bucket heuristics (US national rule-of-thumb). Get contractor quotes + a written scope before underwriting a rehab budget.
Schools (NCES district)
- District
- High Island ISD
- NCES district ID
- 4823160
- Math proficiency
- 65% ▲ 30.00%
- Reading proficiency
- 50% ▲ 15.00%
- Median HH income
- $49,447
- Composite
- 50.69/100
- National rank
- #3933
- State rank
- #177 of 1141 in TX
Livability — Bolivar Peninsula
- Score
- 65/100
- State rank
- #719
- US rank
- #13437
Category grades
Schools grade is shown separately in the Schools card above.
Census & demographics
- Census place
- Bolivar Peninsula, TX
- City population
- 2,957
- Population (ZIP)
- 38
Population outlook (Galveston County) Hauer SSP2
- Today (2025)
- 390,640 people
- By 2030
- 425,226 · +8.9%
- By 2040
- 493,765 · +26.4%
- By 2050
- 559,698 · +43.3%
- By 2075
- 719,260 · +84.1%
- By 2100
- 819,628 · +109.8%
Race, ethnicity, and origin ACS 2023
- Neighborhood character
- Predominantly White (100%)
- Race & ethnicity
- White 100%
- Common ancestry
- Lithuanian 18% Serbian 18%
- Languages at home
- 84% English-only · Spanish 16%
Political lean MEDSL · Galveston
- 2024 margin
- Strong R (+27.4) · D 35.7% · R 63.1% · Other 1.2%
- 2008→2024 swing
- -7.9pp toward R · 2008: -19.5pp · 2024: -27.4pp
- All cycles
- 2024: R+27.4 2020: R+22.6 2016: R+22.6 2012: R+26.9 2008: R+19.5
Not yet ingested
- Civics
- —
Market trends
- HPI YoY
- —
- Current HPI
- —
- Rent YoY
- —
- Metro
- —
- State GDP YoY
- ▲ 3.95%
- F500 in state
- 110
Industry mix (Fortune 500 HQ in TX)
| Industry | F500 HQs | Revenue |
|---|---|---|
| Energy | 16 | $1,198B |
|
||
| Technology | 5 | $198B |
|
||
| Engineering / Construction | 4 | $72B |
|
||
| Energy Services | 3 | $60B |
|
||
| Utilities | 3 | $41B |
|
||
| Healthcare | 2 | $330B |
|
||
Price history
-74.1% since first listed15 events — show timeline
- 2026-05-14 Listed $150,000 HARMLS
- 2025-09-16 Listing Removed — HARMLS
- 2025-08-15 Relisted — Deep East Texas MLS
- 2025-08-15 Price Changed $499,900 Deep East Texas MLS
- 2025-08-15 Listed $499,900 HARMLS
- 2025-07-31 Listing Removed — HARMLS
- 2025-05-27 Price Changed $549,900 HARMLS
- 2025-05-27 Price Changed $549,900 Deep East Texas MLS
- 2025-05-12 Price Changed $559,900 HARMLS
- 2025-05-12 Price Changed $559,900 Deep East Texas MLS
- 2025-05-05 Price Changed $569,900 HARMLS
- 2025-05-05 Price Changed $569,900 Deep East Texas MLS
- 2025-04-29 Listed $579,900 HARMLS
- 2025-04-22 Listed $579,900 Deep East Texas MLS
- 2024-04-16 Sold (Public Records) — Public Records
Property tax history
+50.7%/yrLatest (2025): $5,540 · +56.2% YoY. Source: county tax records.
Cash-flow waterfall
monthlySold comps — $/sqft
last 12 mo · ≤1 miLoading sold comps…