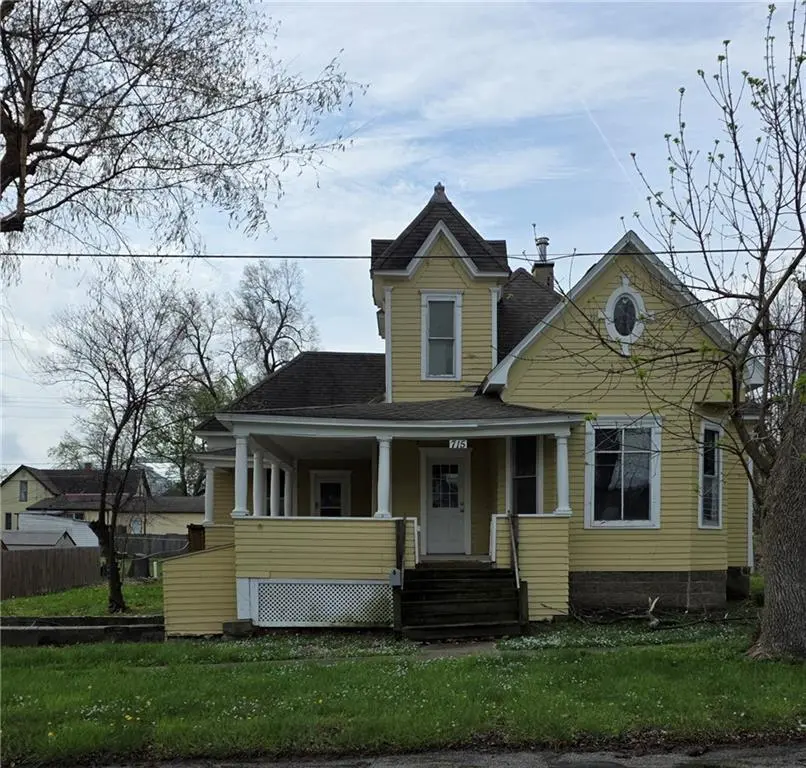
715 W 4th St · Cameron, MO
Flood risk 1/10 · Minimal
- FEMA flood zone
- X (unshaded)
- Chance of flooding over 30 yrs
- 0.0%
- Est. flood insurance / yr
- $473 – $860
Fire risk 4/10 · Minor
- Est. fire insurance / yr
- $1,054 – $1,958
Heat risk 4/10 · Minor
- Hot days now (above 105°F)
- 7 days/yr
- Hot days in 30 yrs
- 15 days/yr
Wind risk 2/10 · Minimal
- Chance of severe wind over 30 yrs
- —
Air-quality risk 2/10 · Minimal
- Unhealthy air days now
- 1 days/yr
- Unhealthy air days in 30 yrs
- 1 days/yr
Risk factors via First Street. Map © Google.
Why this score? — see what drove the B+ grade
The composite is a weighted blend of 9 inputs, each scored 0–100. Each bar is that input's sub-score; the figure is the points it added to the 100-point composite (weight × sub-score).
- Cash flow +30.0/30.0
- 1% rule +10.0/10.0
- DSCR +10.0/10.0
- Appreciation +10.0/10.0
- ARV discount +7.5/15.0
- Livability +3.8/5.0
- Schools +3.6/10.0
- Rent growth +2.5/5.0
- Condition / age +2.5/5.0
$75,000
🖨 Deal sheet (PDF) 📄 Offer letter ✓ Due diligence
Listing remarks MLS
What a home- offers incredible potential! Sweat equity bring great value~ Spacious older home with loads of natural light, solid construction and plenty of room for a growing family. Features high ceilings, stunning woodwork, and strong structural integrity. With some updates, maintenance, and personal touches- after being vacant for a period of time- it can truly shine. A great opportunity for the right buyer/investor to bring it back to life. The kitchen and bathroom have been updated prior to current owners. Newer roof, newer RRG natural gas water boiler and water heater. Buyer and buyer agent to verify all listing information including measurements and square footage.
Key facts
- Natural light
- Stunning woodwork
- Updated kitchen
Tags
Neighborhood map
What this means for you Summary
Snapshot
- This is a 3-bed/1.5-bath single-family listed at $75k.
Deal economics
- At list price, monthly cash flow is $573 ($7k/yr) — positive.
- The deal already cash-flows at list — no discount required.
- Meets the 1% rule at list price ($1k rent vs $75k).
- Recommended offer: $70k (6.0% below list) — sets the bar for market timing.
- Cap rate 15.5% vs local median 3.4% in Cameron — top-decile yield for the area; either an underpriced asset or a hidden risk that comps aren't pricing in. Stress-test before assuming the spread holds.
Location & tenants
- Location reads 75/100 on livability (#60 in MO, #4,301 nationally) — a middle-class / working-renter tenant base. Strengths: cost of living A+, housing A+, health & safety A+; Watch: crime D+, schools D-, amenities F.
- Cameron R-I (town): math 40% / reading 45% proficiency, ranked #117 of 324 in MO (top 36%) — families likely to look elsewhere, expect single-tenant / working-renter base with shorter leases.
- Market conditions: 62 active listings in the ZIP; 67 units permitted in Clinton County in 2024 (0 in 5+ unit buildings).
Forward outlook
- In year one you build about $8k of equity ($519 loan paydown + $8k appreciation (10.0% local appreciation)).
- Clinton County population projected to shrink 9% by 2050 — rents likely to lag national; underwrite the cash flow, not the appreciation.
- At projected returns (10.0% appreciation + 3.0% rent growth), your $21k cash investment doubles in ~2 years — after that, you're playing with house money.
- By year 5, paydown + projected appreciation supports a ~$37k cash-out refi (75% LTV) — recoverable capital for the next deal without selling this one.
Negotiation context
- It's been on market 68 days — a 6% lower offer ($70k) is reasonable based on typical stale-listing flexibility.
- 4 sale attempts since 9y ago; this cycle's ask has dropped $45k (38%) from the opening price — seller is motivated, your offer sets the floor, not the list.
Risks & watch-outs
- Watch-outs: built in 1923 — expect roof / HVAC / electrical / plumbing capex.
Questions for the listing agent
- It's been on market 68 days. Have you received any prior offers? Is the seller open to a 6% concession, seller financing, or rate buy-down credit?
- Built in 1923 — when were the roof, HVAC, electrical panel, plumbing, and water heater last replaced?
- Why hasn't it sold? Are there any deal-killer items the seller is aware of (foundation, flood, title, zoning, code violations)?
- Is there a deadline driving the sale (1031 exchange, divorce, estate, relocation)? That informs how much negotiation room exists.
- Schools are D-rated, which usually means shorter tenancies and higher turnover. Who's the typical renter profile here, and what's been the actual vacancy rate?
- Crime grade is D in this area — have there been break-ins, vandalism, or insurance claims at this property in the last 3 years? What carrier currently insures it and at what premium?
- What's the average days-on-market for RENTAL listings here right now (not sales)? A rising rental-DOM trend means longer vacancies and softer asking-rent achievability than the comps imply.
- What's the recent tenant-quality profile in this submarket — average credit score on applications, eviction rate, late-payment / NSF rate, and stable-employment percentage? A property-management company in the area should have these aggregated.
- How much new for-sale + rental construction is in the pipeline within 1–3 miles? Heavy new supply typically softens prices + rents 12–24 months out; constrained supply supports both.
Investment metrics
- 1% rule
- 1.81% ✓
- Cap rate
- 15.47%
- Cash-on-cash
- 32.76%
- DSCR
- 2.46
- GRM
- 4.6
CMA / ARV
- ARV (median comp)
- $215,742
- List price
- $75,000
- Delta
- -65.24%
- Verdict
- UNDERPRICED
- Comps
- 20 within 1.0 mi
Show comp detail 12 sales within ~0.75 mi
| Address | Dist | Beds/Ba | Sqft | Sold | Price | $/sf | Match |
|---|---|---|---|---|---|---|---|
| 306 W 4th St | 0.31mi | 3/2.5 | 2,232 (-4%) | 8mo | $260,000 | $116 | 69 |
| 516 W 8th St | 0.33mi | 4/2.0 (+1) | 2,265 (-2%) | 7mo | $249,900 | $110 | 68 |
| 723 N Godfrey St | 0.31mi | 4/3.0 (+1) | 2,200 (-5%) | 1mo | $299,000 | $136 | 65 |
| 216 S Nettleton St | 0.28mi | 3/2.5 | 2,116 (-9%) | 8mo | $230,000 | $109 | 62 |
| 507 W 3rd St | 0.18mi | 2/1.0 (-1) | 2,021 (-13%) | 3mo | $79,000 | $39 | 61 |
| 406 Lykins Ln | 0.46mi | 3/2.0 | 2,137 (-8%) | 8mo | $370,000 | $173 | 57 |
| 1003 Rosewood Dr | 0.70mi | 3/3.0 | 2,382 (+3%) | 1mo | $287,500 | $121 | 56 |
| 701 N Godfrey St | 0.26mi | 3/2.0 | 2,000 (-14%) | 9mo | $230,000 | $115 | 56 |
| 1001 Rosewood Dr | 0.69mi | 3/2.5 | 2,378 (+3%) | 6mo | $289,900 | $122 | 54 |
| 613 N Mead St | 0.20mi | 4/2.0 (+1) | 2,014 (-13%) | 10mo | $239,000 | $119 | 54 |
| 605 N Mead St | 0.18mi | 4/3.0 (+1) | 2,593 (+12%) | 11mo | $390,000 | $150 | 52 |
| 423 E 4th St | 0.74mi | 4/2.0 (+1) | 2,021 (-13%) | 4mo | $245,000 | $121 | 34 |
Match score weights: distance 35% · size 25% · config 20% · recency 20%. Top-matched comps best support the ARV.
Projected returns pro-forma
10.0% appreciation · 3.0% rent growth · sell at horizon
- IRR
- 49.3%
- Equity multiple
- 4.68×
- Total profit
- $77,371
- Equity at exit
- $67,566
- IRR
- 43.0%
- Equity multiple
- 10.48×
- Total profit
- $199,149
- Equity at exit
- $145,709
Cash invested: $21,000 (down + closing). Projections, not guarantees.
Landlord ↔ Tenant lean methodology
- Overall (STATE)
- 81 Strongly Landlord-Friendly
- State Missouri
- 81 Strongly Landlord-Friendly · R+10
- County
- — inherits STATE
- City
- — inherits STATE
ZIP-level market 64429
- Home prices YoY
- 7.7%
- Active inventory
- 62
- Price-to-rent
- 4.6×
Monthly cashflow live
- Estimated rent
- $1,359 medium interval (Pro) →
- Mortgage (P&I)
- −$393
- Tax from tax record
- −$76 /mo · $911/yr
- Insurance
- −$31
- HOA
- −$0
- Vacancy / Maint / Mgmt
- −$285
- Net cashflow
- $573
Break-even live
Sensitivity live
| Price | -10% $616 | -5% $595 | +0% $573 | +5% $552 | +10% $531 |
|---|---|---|---|---|---|
| Rent | -10% $466 | -5% $520 | +0% $573 | +5% $627 | +10% $681 |
| Rate | -1.0pp $611 | -0.5pp $592 | base $573 | +0.5pp $554 | +1.0pp $534 |
UW: 25.0% down · 7.5% · 30yr · 1.5% tax · 5.0% vac · 8.0% maint · 8.0% mgmt
Financing live
Cash to close
- Down payment
- $18,750
- Closing costs
- $2,250
- Reserves months
- —
- Total cash needed
- —
Loan-product check · same deal, 3 products live
Conventional
25% down · 7.5% · 30yr
- Down + closing
- —
- Monthly P&I
- —
- Monthly cashflow
- —
- DSCR
- —
- Eligible?
- —
Personal DTI + credit; lowest rate.
DSCR
20% down · 8.5% · 30yr
- Down + closing
- —
- Monthly P&I
- —
- Monthly cashflow
- —
- DSCR
- —
- Eligible?
- —
No personal income docs; deal must DSCR.
Hard money
10% down · 12.0% · 12mo
- Down + closing
- —
- Monthly P&I
- —
- Monthly cashflow
- —
- DSCR
- —
- Eligible?
- —
Short-term bridge; refi at stabilization.
Listing history 26 events
-
2026-06-21days on market $75,000 Active 68 DOM
-
2026-06-18days on market $75,000 Active 66 DOM
-
2026-06-17days on market $75,000 Active 65 DOM
-
2026-06-16days on market $75,000 Active 64 DOM
-
2026-06-15days on market $75,000 Active 63 DOM
-
2026-06-13days on market $75,000 Active 61 DOM
-
2026-06-12days on market $75,000 Active 60 DOM
-
2026-06-09days on market $75,000 Active 57 DOM
-
2026-06-08days on market $75,000 Active 56 DOM
-
2026-06-07days on market $75,000 Active 55 DOM
-
2026-06-07days on market $75,000 Active 54 DOM
-
2026-06-04days on market $75,000 Active 51 DOM
-
2026-06-02days on market $75,000 Active 50 DOM
-
2026-06-01days on market $75,000 Active 49 DOM
-
2026-05-31days on market $75,000 Active 48 DOM
-
2026-05-13price $95,000 680-char remark
Show marketing remark (680 chars)
What a home- offers incredible potential! Sweat equity bring great value~ Spacious older home with loads of natural light, solid construction and plenty of room for a growing family. Features high ceilings, stunning woodwork, and strong structural integrity. With some updates, maintenance, and personal touches- after being vacant for a period of time- it can truly shine. A great opportunity for the right buyer/investor to bring it back to life. The kitchen and bathroom have been updated prior to current owners. Newer roof, newer RRG natural gas water boiler and water heater. Buyer and buyer agent to verify all listing information including measurements and square footage.
-
2026-05-07price $105,000 680-char remark
Show marketing remark (680 chars)
What a home- offers incredible potential! Sweat equity bring great value~ Spacious older home with loads of natural light, solid construction and plenty of room for a growing family. Features high ceilings, stunning woodwork, and strong structural integrity. With some updates, maintenance, and personal touches- after being vacant for a period of time- it can truly shine. A great opportunity for the right buyer/investor to bring it back to life. The kitchen and bathroom have been updated prior to current owners. Newer roof, newer RRG natural gas water boiler and water heater. Buyer and buyer agent to verify all listing information including measurements and square footage.
-
2026-04-24price $110,000 680-char remark
Show marketing remark (680 chars)
What a home- offers incredible potential! Sweat equity bring great value~ Spacious older home with loads of natural light, solid construction and plenty of room for a growing family. Features high ceilings, stunning woodwork, and strong structural integrity. With some updates, maintenance, and personal touches- after being vacant for a period of time- it can truly shine. A great opportunity for the right buyer/investor to bring it back to life. The kitchen and bathroom have been updated prior to current owners. Newer roof, newer RRG natural gas water boiler and water heater. Buyer and buyer agent to verify all listing information including measurements and square footage.
-
2026-04-13$120,000 Active 680-char remark
Show marketing remark (680 chars)
What a home- offers incredible potential! Sweat equity bring great value~ Spacious older home with loads of natural light, solid construction and plenty of room for a growing family. Features high ceilings, stunning woodwork, and strong structural integrity. With some updates, maintenance, and personal touches- after being vacant for a period of time- it can truly shine. A great opportunity for the right buyer/investor to bring it back to life. The kitchen and bathroom have been updated prior to current owners. Newer roof, newer RRG natural gas water boiler and water heater. Buyer and buyer agent to verify all listing information including measurements and square footage.
-
2026-01-04historical
-
2025-10-23$130,000 Active
-
2022-04-28historical
-
2022-04-01$110,000 Active
-
2017-07-21soldstatus Sold
-
2017-07-12status Pending
-
2017-06-22$15,000 Active
ⓘ Source: listings_history table (triggers on properties + properties_extension) + one-shot
backfill from property_details.listing_events for pre-trigger history.
Tax reassessment forecast MO · Resets to sale price
- Current annual tax
- $911 · $76/mo
- Projected year-2 tax
- $911 · $76/mo
- Expected delta
- $0/yr ($0/mo · 0.0%)
ⓘ Screening estimate from a state-policy table — verify with the county assessor before closing.
Climate risk First Street
- Flood 1/10 Low FEMA zone X (unshaded) · 0% chance over 30 yrs
- Wildfire 4/10 Moderate
- Heat 4/10 Moderate 7 d/yr ≥105°F today · 15 d/yr by 30 yrs out
- Wind 2/10 Low
- Air quality 2/10 Low 1 unhealthy d/yr today · 1 by 30 yrs out
Nearby sold comps map
Loading sold comps map…
Walkable amenities ~0.75 mi
Loading nearby amenities…
Taxation est. · year 1
- Rental income
- $16,310
- − Mortgage interest
- −$4,201
- − Property taxes
- −$911
- − Insurance
- −$375
- − Repairs & maintenance
- −$1,305
- − Management
- −$1,305
- − Depreciation
- −$2,182
- Taxable income
- $6,032
- Est. tax owed @ 24.0%
- −$1,448
- After-tax cash flow
- $5,432/yr
For passive investors: Depreciation is non-cash, so a rental often shows a tax loss while cash-flowing — sheltering income. Rental losses are passive: they offset passive income freely, and up to $25,000/yr can offset ordinary (W-2) income if you actively participate and your MAGI is under $100k (phasing out to $0 by $150k); unused losses carry forward. On sale, claimed depreciation is recaptured at up to 25%, and gains may owe capital-gains tax (a 1031 exchange can defer both). Figures are a year-1 estimate at your 24.0% rate — not tax advice; consult a CPA.
Schools (NCES district)
- District
- Cameron R-I
- NCES district ID
- 2907020
- Math proficiency
- 40% ▼ -10.00%
- Reading proficiency
- 45% ▼ -9.00%
- Median HH income
- $44,979
- Composite
- 36.07/100
- National rank
- #4765
- State rank
- #117 of 324 in MO
Livability — Cameron
- Score
- 75/100
- State rank
- #60
- US rank
- #4301
Category grades
Schools grade is shown separately in the Schools card above.
Census & demographics
- Census place
- Cameron, MO
- City population
- 11,815
- Population (ZIP)
- 11,815
Population outlook (Clinton County) Hauer SSP2
- Today (2025)
- 20,532 people
- By 2030
- 20,365 · -0.8%
- By 2040
- 19,744 · -3.8%
- By 2050
- 18,659 · -9.1%
- By 2075
- 15,981 · -22.2%
- By 2100
- 11,916 · -42.0%
Race, ethnicity, and origin ACS 2023
- Neighborhood character
- Predominantly White (88%)
- Race & ethnicity
- White 88% Black 6% Two or more races 4% Hispanic / Latino 3%
- Common ancestry
- Slovak 4% Italian 1% Portuguese 1%
- Foreign-born
- 2% · Canada
- Languages at home
- 97% English-only · Spanish 2%
Political lean MEDSL · Clinton
- 2024 margin
- Solid R (+47.9) · D 25.4% · R 73.3% · Other 1.2%
- 2008→2024 swing
- -36.8pp toward R · 2008: -11.1pp · 2024: -47.9pp
- All cycles
- 2024: R+47.9 2020: R+45.0 2016: R+44.0 2012: R+22.6 2008: R+11.1
Not yet ingested
- Civics
- —
Market trends
- HPI YoY
- ▲ 18.70%
- Current HPI
- 261.2418
- Rent YoY
- —
- Metro
- —
- State GDP YoY
- ▲ 1.84%
- F500 in state
- 20
Industry mix (Fortune 500 HQ in MO)
| Industry | F500 HQs | Revenue |
|---|---|---|
| Healthcare | 1 | $163B |
|
||
| Insurance | 1 | $21B |
|
||
| Industrial Technology | 1 | $17B |
|
||
| Retail | 1 | $16B |
|
||
| Industrial Distribution | 1 | $10B |
|
||
| Utilities | 1 | $9B |
|
||
Price history
+533.3% since first listed11 events — show timeline
- 2026-05-13 Price Changed $95,000 Heartland MLS as Distributed by MLS Grid
- 2026-05-07 Price Changed $105,000 Heartland MLS as Distributed by MLS Grid
- 2026-04-24 Price Changed $110,000 Heartland MLS as Distributed by MLS Grid
- 2026-04-13 Listed $120,000 Heartland MLS as Distributed by MLS Grid
- 2026-01-04 Listing Removed — Heartland MLS as Distributed by MLS Grid
- 2025-10-23 Listed $130,000 Heartland MLS as Distributed by MLS Grid
- 2022-04-28 Listing Removed — Heartland MLS as Distributed by MLS Grid
- 2022-04-01 Listed $110,000 Heartland MLS as Distributed by MLS Grid
- 2017-07-21 Sold (MLS) — Heartland MLS as Distributed by MLS Grid
- 2017-07-12 Pending — Heartland MLS as Distributed by MLS Grid
- 2017-06-22 Listed $15,000 Heartland MLS as Distributed by MLS Grid
Property tax history
+3.7%/yrLatest (2025): $911 · +9.3% YoY. Source: county tax records.
Cash-flow waterfall
monthlySold comps — $/sqft
last 12 mo · ≤1 miLoading sold comps…