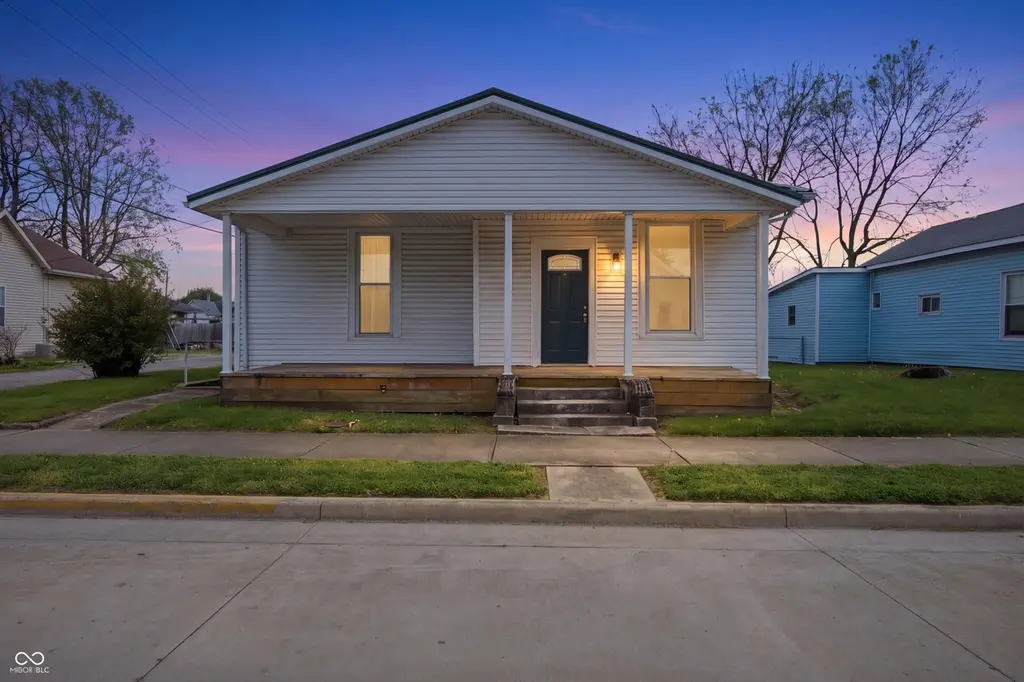
225 E Pennsylvania St · Shelbyville, IN
Flood risk 5/10 · Moderate
- FEMA flood zone
- X (unshaded)
- Chance of flooding over 30 yrs
- 0.62%
- Est. flood insurance / yr
- $473 – $860
Fire risk 1/10 · Minimal
- Est. fire insurance / yr
- $717 – $1,331
Heat risk 4/10 · Minor
- Hot days now (above 102°F)
- 7 days/yr
- Hot days in 30 yrs
- 19 days/yr
Wind risk 2/10 · Minimal
- Chance of severe wind over 30 yrs
- 1.0%
Air-quality risk 2/10 · Minimal
- Unhealthy air days now
- 1 days/yr
- Unhealthy air days in 30 yrs
- 2 days/yr
Risk factors via First Street. Map © Google.
Why this score? — see what drove the B grade
The composite is a weighted blend of 9 inputs, each scored 0–100. Each bar is that input's sub-score; the figure is the points it added to the 100-point composite (weight × sub-score).
- Cash flow +27.8/30.0
- ARV discount +15.0/15.0
- DSCR +9.8/10.0
- 1% rule +7.6/10.0
- Schools +3.4/10.0
- Livability +3.2/5.0
- Rent growth +2.5/5.0
- Condition / age +2.5/5.0
- Appreciation +0.0/10.0
$120,000
🖨 Deal sheet 📄 Offer letter ✓ Due diligence
Listing remarks MLS
Welcome home to this charming 3-bedroom, 1-bath property full of character and opportunity! Step inside to a spacious living room and dining room combo, perfect for everyday living or entertaining guests. You'll love the beautiful built-in cabinets that add both charm and functionality throughout the home. Enjoy relaxing mornings or evenings on the inviting covered front porch. This home offers the perfect chance to move right in while adding your own personal touches over time-ideal for buyers looking to make a space truly their own. The kitchen features a fun and functional built-in chalkboard, adding a unique touch for notes, menus, or family messages. This is a must-see property with endless potential-don't miss your chance to make it yours!
Key facts
- 6,901 sq ft lot
- 2 garage spots
- Built 1876
Neighborhood map
What this means for you Summary
Snapshot
- This is a 3-bed/1.0-bath single-family listed at $120k.
Deal economics
- At list price, monthly cash flow is $367 ($4k/yr) — positive.
- The deal already cash-flows at list — no discount required.
- Meets the 1% rule at list price ($2k rent vs $120k).
- Recommended offer: $116k (3.0% below list) — sets the bar for market timing.
- Cap rate 10.0% vs local median 4.3% in Shelbyville — top-decile yield for the area; either an underpriced asset or a hidden risk that comps aren't pricing in. Stress-test before assuming the spread holds.
Location & tenants
- Location reads 63/100 on livability (#450 in IN) — a middle-class / working-renter tenant base. Strengths: cost of living A+, housing A+, crime B; Watch: employment C-, schools D+, amenities F.
- Shelbyville Central Schools (town): math 40% / reading 39% proficiency, ranked #148 of 301 in IN (top 49%) — families likely to look elsewhere, expect single-tenant / working-renter base with shorter leases.
- Market conditions: 229 active listings in the ZIP; 5 comparable units currently listed for rent nearby; rentals leasing fast (median 11d on market — plan ~1-2 weeks tenant-placement turnaround); 285 units permitted in Shelby County in 2024 (147 in 5+ unit buildings).
Forward outlook
- Local home prices are declining (-3.0%/yr); year-one equity from $830 of loan paydown is wiped out by about $4k of value loss. Plan a longer hold.
- Shelby County population projected to shrink 6% by 2050 — rents likely to lag national; underwrite the cash flow, not the appreciation.
- At projected returns (-3.0% appreciation + 3.0% rent growth), your $34k cash investment doubles in ~9 years — after that, you're playing with house money.
Negotiation context
- It's been on market 49 days — a 3% lower offer ($116k) is reasonable based on typical stale-listing flexibility.
Risks & watch-outs
- Watch-outs: built in 1876 — expect roof / HVAC / electrical / plumbing capex.
- Climate carrying-cost: moderate flood risk — expect insurance premiums to compound above CPI over the hold.
Questions for the listing agent
- It's been on market 49 days. Have you received any prior offers? Is the seller open to a 3% concession, seller financing, or rate buy-down credit?
- Built in 1876 — when were the roof, HVAC, electrical panel, plumbing, and water heater last replaced?
- Is there a deadline driving the sale (1031 exchange, divorce, estate, relocation)? That informs how much negotiation room exists.
- Schools are D-rated, which usually means shorter tenancies and higher turnover. Who's the typical renter profile here, and what's been the actual vacancy rate?
- What's the average days-on-market for RENTAL listings here right now (not sales)? A rising rental-DOM trend means longer vacancies and softer asking-rent achievability than the comps imply.
- What's the recent tenant-quality profile in this submarket — average credit score on applications, eviction rate, late-payment / NSF rate, and stable-employment percentage? A property-management company in the area should have these aggregated.
- How much new for-sale + rental construction is in the pipeline within 1–3 miles? Heavy new supply typically softens prices + rents 12–24 months out; constrained supply supports both.
Investment metrics
- 1% rule
- 1.26% ✓
- Cap rate
- 9.96%
- Cash-on-cash
- 13.09%
- DSCR
- 1.58
- GRM
- 6.6
CMA / ARV
- ARV (median comp)
- $181,622
- List price
- $120,000
- Delta
- -33.93%
- Verdict
- UNDERPRICED
- Comps
- 20 within 1.0 mi
Show comp detail 12 sales within ~0.75 mi
| Address | Dist | Beds/Ba | Sqft | Sold | Price | $/sf | Match |
|---|---|---|---|---|---|---|---|
| 110 N Hamilton St | 0.13mi | 2/1.0 (-1) | 1,172 (-0%) | 6mo | $103,000 | $88 | 83 |
| 407 Alice St | 0.35mi | 3/2.0 | 1,203 (+2%) | 4mo | $183,000 | $152 | 72 |
| 238 E Franklin St | 0.10mi | 2/1.0 (-1) | 1,255 (+7%) | 15mo | $130,000 | $104 | 66 |
| 904 Hemlock St | 0.72mi | 3/1.5 | 1,160 (-1%) | 0mo | $217,000 | $187 | 62 |
| 718 Indiana Ave | 0.50mi | 3/1.0 | 1,200 (+2%) | 14mo | $169,900 | $142 | 61 |
| 619 Fair Ave | 0.41mi | 4/1.0 (+1) | 1,216 (+3%) | 11mo | $170,000 | $140 | 61 |
| 116 E South St | 0.49mi | 4/2.0 (+1) | 1,276 (+8%) | 1mo | $169,500 | $133 | 53 |
| 319 Roosevelt Dr | 0.57mi | 4/1.0 (+1) | 1,296 (+10%) | 4mo | $135,000 | $104 | 48 |
| 450 Howard St | 0.68mi | 3/1.5 | 1,152 (-2%) | 19mo | $169,900 | $147 | 47 |
| 510 Eberhart Dr | 0.67mi | 3/1.0 | 1,008 (-14%) | 11mo | $199,000 | $197 | 36 |
| 404 Howard St | 0.65mi | 3/1.0 | 1,307 (+11%) | 18mo | $168,500 | $129 | 36 |
| 844 Blanchard St | 0.73mi | 2/1.0 (-1) | 1,066 (-9%) | 12mo | $189,900 | $178 | 35 |
Match score weights: distance 35% · size 25% · config 20% · recency 20%. Top-matched comps best support the ARV.
Projected returns pro-forma
-3.0% appreciation · 3.0% rent growth · sell at horizon
- IRR
- 3.0%
- Equity multiple
- 1.12×
- Total profit
- $3,927
- Equity at exit
- $17,892
- IRR
- 12.6%
- Equity multiple
- 2.00×
- Total profit
- $33,574
- Equity at exit
- $10,375
Cash invested: $33,600 (down + closing). Projections, not guarantees.
Landlord ↔ Tenant lean methodology
- Overall (STATE)
- 90 Strongly Landlord-Friendly
- State Indiana
- 90 Strongly Landlord-Friendly · R+11
- County
- — inherits STATE
- City
- — inherits STATE
ZIP-level market 46176
- Home prices YoY
- -33.9%
- Active inventory
- 229
- Price-to-rent
- 6.6×
Monthly cashflow live
- Estimated rent
- $1,511 high interval (Pro) →
- Mortgage (P&I)
- −$629
- Tax from tax record
- −$147 /mo · $1,769/yr
- Insurance
- −$50
- HOA
- −$0
- Vacancy / Maint / Mgmt
- −$317
- Net cashflow
- $367
Break-even live
UW: 25.0% down · 7.5% · 30yr · 1.5% tax · 5.0% vac · 8.0% maint · 8.0% mgmt
Financing live
Cash to close
- Down payment
- $30,000
- Closing costs
- $3,600
- Reserves months
- —
- Total cash needed
- —
Loan-product check · same deal, 3 products live
Conventional
25% down · 7.5% · 30yr
- Down + closing
- —
- Monthly P&I
- —
- Monthly cashflow
- —
- DSCR
- —
- Eligible?
- —
Personal DTI + credit; lowest rate.
DSCR
20% down · 8.5% · 30yr
- Down + closing
- —
- Monthly P&I
- —
- Monthly cashflow
- —
- DSCR
- —
- Eligible?
- —
No personal income docs; deal must DSCR.
Hard money
10% down · 12.0% · 12mo
- Down + closing
- —
- Monthly P&I
- —
- Monthly cashflow
- —
- DSCR
- —
- Eligible?
- —
Short-term bridge; refi at stabilization.
Rent comps 5 comps
| Address | Beds | Baths | Sqft | Rent | $/sqft | DOM | Units | Dist |
|---|---|---|---|---|---|---|---|---|
| 348 E Franklin St Shelbyville, IN | 2.0 | 1.0 | 934 | $1,295 | $1.39 | 22d | 1 | 0.21mi |
| 425 N Harrison St Shelbyville, IN | 3.0 | 1.0–2.0 | 909 | $1,882 | $2.07 | 1d | 7 | 0.28mi |
| 713 Indiana Ave Shelbyville, IN | 2.0 | 1.0 | 1077 | $1,100 | $1.02 | 43d | 1 | 0.51mi |
| 809 Indiana Ave Unit 809 Shelbyville, IN | 2.0 | 2.0 | 1456 | $850 | $0.58 | 10d | 1 | 0.57mi |
| 1021 Amos Rd Shelbyville, IN | 3.0 | 1.5 | 1476 | $1,635 | $1.11 | 7d | 1 | 1.11mi |
Listing history 15 events
-
2026-06-18days on market $120,000 Active 49 DOM
-
2026-06-17days on market $120,000 Active 48 DOM
-
2026-06-16days on market $120,000 Active 47 DOM
-
2026-06-15days on market $120,000 Active 46 DOM
-
2026-06-13days on market $120,000 Active 44 DOM
-
2026-06-13days on market $120,000 Active 43 DOM
-
2026-06-09days on market $120,000 Active 40 DOM
-
2026-06-08days on market $120,000 Active 39 DOM
-
2026-06-07days on market $120,000 Active 38 DOM
-
2026-06-03days on market $120,000 Active 34 DOM
-
2026-06-02days on market $120,000 Active 33 DOM
-
2026-06-01days on market $120,000 Active 32 DOM
-
2026-06-01pricestatus $120,000 Active 31 DOM
-
2026-05-15status Pending 758-char remark
Show marketing remark (758 chars)
Welcome home to this charming 3-bedroom, 1-bath property full of character and opportunity! Step inside to a spacious living room and dining room combo, perfect for everyday living or entertaining guests. You'll love the beautiful built-in cabinets that add both charm and functionality throughout the home. Enjoy relaxing mornings or evenings on the inviting covered front porch. This home offers the perfect chance to move right in while adding your own personal touches over time-ideal for buyers looking to make a space truly their own. The kitchen features a fun and functional built-in chalkboard, adding a unique touch for notes, menus, or family messages. This is a must-see property with endless potential-don't miss your chance to make it yours!
-
2026-04-13$139,900 Active 758-char remark
Show marketing remark (758 chars)
Welcome home to this charming 3-bedroom, 1-bath property full of character and opportunity! Step inside to a spacious living room and dining room combo, perfect for everyday living or entertaining guests. You'll love the beautiful built-in cabinets that add both charm and functionality throughout the home. Enjoy relaxing mornings or evenings on the inviting covered front porch. This home offers the perfect chance to move right in while adding your own personal touches over time-ideal for buyers looking to make a space truly their own. The kitchen features a fun and functional built-in chalkboard, adding a unique touch for notes, menus, or family messages. This is a must-see property with endless potential-don't miss your chance to make it yours!
ⓘ Source: listings_history table (triggers on properties + properties_extension) + one-shot
backfill from property_details.listing_events for pre-trigger history.
Tax reassessment forecast IN · Partial reset (capped growth)
- Current annual tax
- $1,769 · $147/mo
- Projected year-2 tax
- $1,769 · $147/mo
- Expected delta
- $0/yr ($0/mo · 0.0%)
ⓘ Screening estimate from a state-policy table — verify with the county assessor before closing.
Climate risk First Street
- Flood 5/10 Major FEMA zone X (unshaded) · 62% chance over 30 yrs
- Wildfire 1/10 Low
- Heat 4/10 Moderate 7 d/yr ≥102°F today · 19 d/yr by 30 yrs out
- Wind 2/10 Low 100% chance of damaging wind over 30 yrs
- Air quality 2/10 Low 1 unhealthy d/yr today · 2 by 30 yrs out
Nearby sold comps map
Loading sold comps map…
Walkable amenities ~0.75 mi
Loading nearby amenities…
Taxation est. · year 1
- Rental income
- $18,126
- − Mortgage interest
- −$6,722
- − Property taxes
- −$1,769
- − Insurance
- −$600
- − Repairs & maintenance
- −$1,450
- − Management
- −$1,450
- − Depreciation
- −$3,491
- Taxable income
- $2,645
- Est. tax owed @ 24.0%
- −$635
- After-tax cash flow
- $3,765/yr
For passive investors: Depreciation is non-cash, so a rental often shows a tax loss while cash-flowing — sheltering income. Rental losses are passive: they offset passive income freely, and up to $25,000/yr can offset ordinary (W-2) income if you actively participate and your MAGI is under $100k (phasing out to $0 by $150k); unused losses carry forward. On sale, claimed depreciation is recaptured at up to 25%, and gains may owe capital-gains tax (a 1031 exchange can defer both). Figures are a year-1 estimate at your 24.0% rate — not tax advice; consult a CPA.
Schools (NCES district)
- District
- Shelbyville Central Schools
- NCES district ID
- 1810140
- Math proficiency
- 40% ▼ -10.00%
- Reading proficiency
- 39% ▼ -9.00%
- Median HH income
- $45,199
- Composite
- 33.63/100
- National rank
- #5402
- State rank
- #148 of 301 in IN
Livability — Shelbyville
- Score
- 63/100
- State rank
- #450
- US rank
- #16051
Category grades
Schools grade is shown separately in the Schools card above.
Census & demographics
- Census place
- Shelbyville, IN
- County
- Shelby County · 28,782 people
- City population
- 28,782
- Metro
- Indianapolis-Carmel-Anderson, IN
- Population (ZIP)
- 28,782
- Household income
- $65,182
- Rent vs Own
- Severe rent burden
- 921.0
Population outlook (Shelby County) Hauer SSP2
- Today (2025)
- 45,020 people
- By 2030
- 44,962 · -0.1%
- By 2040
- 44,126 · -2.0%
- By 2050
- 42,110 · -6.5%
- By 2075
- 37,131 · -17.5%
- By 2100
- 29,714 · -34.0%
Race, ethnicity, and origin ACS 2023
- Neighborhood character
- Predominantly White (88%)
- Race & ethnicity
- White 88% Hispanic / Latino 7% Two or more races 4% Black 2% Asian 1%
- Hispanic origin (detail)
- Mexican 5%
- Common ancestry
- Italian 2% Slovak 1% Lithuanian 1%
- Foreign-born
- 5% · Canada
- Languages at home
- 92% English-only · Spanish 5% German/W. Germanic 1% Other Asian/Pacific 1%
Political lean MEDSL · Shelby
- 2024 margin
- Solid R (+48.0) · D 25.1% · R 73.1% · Other 1.8%
- 2008→2024 swing
- -29.0pp toward R · 2008: -19.0pp · 2024: -48.0pp
- All cycles
- 2024: R+48.0 2020: R+47.7 2016: R+47.2 2012: R+33.5 2008: R+19.0
Not yet ingested
- Civics
- —
Market trends
- HPI YoY
- ▼ -116.59%
- Current HPI
- 227.6747
- Rent YoY
- —
- Metro
- Indianapolis-Carmel-Anderson, IN
- State GDP YoY
- ▲ 2.90%
- F500 in state
- 18
Industry mix (Fortune 500 HQ in IN)
| Industry | F500 HQs | Revenue |
|---|---|---|
| Industrial Machinery | 2 | $37B |
|
||
| Healthcare | 1 | $177B |
|
||
| Pharmaceuticals | 1 | $45B |
|
||
| Metals / Steel | 1 | $18B |
|
||
| Agriculture | 1 | $17B |
|
||
| Packaging | 1 | $12B |
|
||
Price history
2 events — show timeline
- 2026-05-15 Pending — MIBOR as Distributed by MLS Grid
- 2026-04-13 Listed $139,900 MIBOR as Distributed by MLS Grid
Property tax history
+5.6%/yrLatest (2025): $1,769 · +7.1% YoY. Source: county tax records.
Cash-flow waterfall
monthlySold comps — $/sqft
last 12 mo · ≤1 miLoading sold comps…